Transcription
THE 2017 ECONOMIC IMPACT OF THEPORT OF BALTIMORE IN MARYLANDPrepared for the:MARYLAND PORT ADMINISTRATIONWorld Trade Center Institute401 East Pratt Street #1653Baltimore, MD 21202Prepared by:MARTIN ASSOCIATES941 Wheatland Ave., Suite 203Lancaster, PA 17603(717) 295-2428www.martinassoc.netOctober 15, 2018
Maryland Port AdministrationInter-Office MemorandumTO:FileDATE:October 22, 2018SUBJECT: MPA comments concerning the Study of Economic Impacts ofPort of Baltimore in 2017, by Martin AssociatesThe MPA commends the excellent work by Martin Associates in completing a comprehensivereport of the economic impacts of Port of Baltimore’s cargo activity in 2017. The report is datedOctober 15, 2018, and it also includes the prior activity associated with the Port’s cruisebusiness. (A comprehensive report of the cruise impacts was not undertaken because cruiseactivity has been stable since the prior report.)There are two features in the current report that the MPA chooses not to use: induced andindirect related jobs and the total economic activity measure that includes the related jobs.Although other ports may use these attributes, the MPA elects not to include them whenhighlighting the Port’s impacts on the regional economy for the following reasons: The related impacts measure the jobs, personal income, and associated state and localtaxes that occur at each stage of production of exports or consumption/use of importedcargo. This includes induced and indirect related jobs that are supported by the directrelated jobs. The report’s inclusion of total related jobs provides a very comprehensivebut overly broad view of the economic impact of the cargo moving via the Port ofBaltimore. Upon further consideration of the report, the induced and indirect relatedjobs are not consider sufficiently linked to Port activity to be included by the MPA whenit reports the economic impacts of the Port of Baltimore. The Port “total economic activity” should focus on the direct, induced and indirect jobsgenerated by maritime activity. The comprehensive study includes the total economicactivity of all the related jobs also. It is believed that these are too peripheral to becounted.It should be noted that this report of economic impacts is a “snap shot in time” of the Port’swaterborne cargo and cruise activity in 2017. The Port’s cargo volumes and overall activity in2018 continue an upward trend.Attached is a summary of the economic impacts to the State of Maryland from activity at thePort of Baltimore during 2017.
ECONOMIC IMPACTS GENERATED BY THE PORT OF BALTIMOREPeriodically, the Maryland Port Administration updates the economic impacts of the Port of Baltimore on the State ofMaryland. The economic impacts measured for cargo and cruise activity are as follows: (2017 data) Approximately 37,300 jobs in Maryland are generated by port activity. 15,330 are direct jobs generated by cargo and vessel activities at the Port. Examples include jobs withrailroads, trucking companies, terminal operators, cargo handling (International Longshoreman Association),manufacturing, security agencies, towing, pilots, ocean carriers, agents, freight forwarders, Customs and BorderProtection, Coast Guard, etc. 16,780 are induced jobs, i.e. jobs supported by the local purchases of goods and services by directemployees. These jobs would be lost in the short term if the direct jobs were lost. Examples include salesclerks, mechanics, teachers, dry cleaners, restaurateurs, coffeeshop owners, tutors, government employees,dentists, etc. 5,190 are indirect jobs, i.e. jobs supported by the business purchases of the employers who create the directjobs. These jobs, too, would be lost in the short term if the direct jobs were lost. Examples include those whoprovide office supplies and equipment, utilities, communications, repair, legal, architectural, engineering andfinancial services, etc. The Port of Baltimore is a major source of personal and business revenues in the State of Maryland. The Port was responsible for 3.3 billion in personal income. The Port’s average annual salary for the direct job holder is 9.5% higher than the average annual wage for theState of Maryland, (as reported by the U.S. Bureau of Labor Statistics). The Port generated 2.6 billion in business revenues. Activities of the Port generated 395 million in state, county and municipal tax revenues. Approximately 101,880 other jobs in Maryland are directly related to activities at the Port. Related jobs are thosejobs with Maryland companies that chose to import and export their cargo through the Port of Baltimore, but they havethe option of shipping their products or supplies (e.g. containerized items, autos or steel products for construction)through other ports. These companies (e.g. manufacturing firms, distributers, coal mines, automobile dealers, etc.)benefit from having a healthy port nearby in Baltimore to assist their logistics. If the Port of Baltimore were not availableto them, these firms could suffer an economic penalty over the longer term but would likely survive by shipping throughanother port. Note: Although the number of related jobs is high, this category of impact is much less dependent uponthe Port than the impacts that are generated by the direct, induced and indirect jobs. Combining direct, induced and indirect jobs with related jobs, there are over 139,180 jobs linked to the Port.
TABLE OF CONTENTSEXECUTIVE SUMMARY . 1I. OVERVIEW OF THE ANALYSIS AND SUMMARY OF METHODOLOGY – MARINE CARGO . 61. ECONOMIC IMPACT STRUCTURE.61.1 Employment Impact .81.2 Personal Income Impact.81.3 Revenue Impact .91.4 Tax Impacts .92. ECONOMIC IMPACT SECTOR ANALYSIS.102.1 The Surface Transportation Sector.102.2 The Maritime Service Sector.102.3 Shippers/Consignees .122.4 Maryland Port Administration .133. COMMODITIES INCLUDED IN THE ANALYSIS .134. DATA COLLECTION .13II. EMPLOYMENT IMPACTS – MARINE CARGO . 151. TOTAL EMPLOYMENT IMPACT .152. DIRECT JOB IMPACTS .162.1 Direct Job Impacts by Sector .162.2 Direct Job Impacts by Residency .172.3 Direct Job Impacts by Commodity 3.10Containerized Cargo . 20Iron and Steel Products . 20Forest Products . 20Other Break Bulk Cargoes . 20Automobiles . 21RoRo Cargo . 21Coal . 21Other Dry Bulk Cargo. 21Iron Ore . 22Liquid Bulk Products . 222.4 Direct Job Impacts per 1,000 Tons .223. INDUCED JOBS.234. INDIRECT JOBS .245. RELATED JOBS .25III. REVENUE, PERSONAL INCOME AND TAX IMPACTS – MARINE CARGO . 271. TOTAL ECONOMIC ACTIVITY .282. DIRECT BUSINESS REVENUE IMPACT .283. PERSONAL INCOME IMPACTS .314. TAX IMPACTS .32IV. COMPARISONS WITH 2014 MARINE CARGO GENERATED IMPACTS . 341. COMPARISON OF TONNAGE ACTIVITY .342. COMPARISON OF TOTAL IMPACTS .353. COMPARISON OF DIRECT JOB IMPACTS.374. SUMMARY OF IMPACT COMPARISONS .38
THE ECONOMIC IMPACTS OF THE PORT OF BALTIMORE, 2017EXECUTIVE SUMMARYThe Port of Baltimore is a 50 foot deep-water port located on the Chesapeake Bay and consistsof public marine terminals owned by the Maryland Port Administration (MPA) as well as privatemarine terminals. The public marine terminals include Seagirt Marine Terminal, Dundalk MarineTerminal, South Locust Point Marine Terminal, North Locust Point Marine Terminal, Hawkins Pointand the Masonville/Fairfield Terminal area. These terminals handle general cargo commoditiesincluding containerized cargo, automobiles and other roll-on/roll-off cargo, forest products and otherbreak bulk cargoes, such as iron and steel and palletized cargo. A variety of bulk commodities arehandled at MPA’s Hawkins Point and North Locust Point Marine Terminals. The private marineterminals include Curtis Bay Coal and Ore Pier, Consolidation Coal Pier, Chesapeake Terminal,Atlantic Terminal, Rukert Terminals Corporation and Canton Marine Terminal in addition to severalothers. Most of the private terminals handle bulk cargoes, steel and metals, and a small amount ofcontainerized cargo and break bulk cargo including steel, pulp and miscellaneous cargo, whileChesapeake and Atlantic Terminals handle automobiles. In 2017, these public and private marineterminals in the Baltimore Port District handled 44.6 million tons of international and domestic cargofor exporters and importers located within the State of Maryland, as well as throughout the UnitedStates. It is the purpose of this study to quantify the economic impacts generated by the cargo andvessel activity at these marine terminals.In addition to the economic impacts generated by cargo activity handled at the public andprivate marine terminals at the Port of Baltimore, the Maryland Port Administration has developed asuccessful cruise business since the opening of the Cruise Maryland Terminal in 2006. The Port iscurrently served by two of the world’s top cruise lines: Carnival and Royal Caribbean on a year-roundbasis for service to such destinations as Bermuda, the Bahamas and the Caribbean Islands. In 2017,the Port of Baltimore was home to 86 homeport cruises and 10 port of call cruises. A total of 195,743passengers embarked on these 86 homeport cruises, while 14,879 passengers arrived on port of callcruises. The impact of these cruises was estimated as part of this economic impact study and areincluded with the 2017 cargo generated economic impacts in this Executive Summary. However, theremainder of this report focuses only on the Port’s cargo economic impacts during 2017.1
THE ECONOMIC IMPACTS OF THE PORT OF BALTIMORE, 2017Exhibit 1Summary of the Economic Impacts of the Port of 16315,293TOTAL CARGOCRUISE15,11916,6925,10736,9192098881378TOTAL WITHCRUISE15,32916,7805,18837,297 0.062708PERSONAL INCOME (MILLIONS )DIRECTRE-SPENDING/LOCAL CONSUMPTIONINDIRECTTOTAL 574.5 1,272.3 144.1 1,990.9 378.7 838.8 105.8 1,323.4 953.2 2,111.2 250.0 3,314.4 8.0 6.3 2.7 17.0 961.2 2,117.5 252.7 3,331.4 0.063047BUSINESS REVENUE (MILLIONS ) 1,138.0 1,371.7 2,509.8 62.2 2,571.9 4,902.3 348.8 256.1 604.9 5.0 609.9 4,689.4 229.6 162.8 392.4 2.8 395.2LOCAL PURCHASES (MILLIONS )STATE & LOCAL TAXES (MILLIONS )RELATED USER IMPACTS IN-STATERELATED IMPACTSJOBSDIRECTINDUCED/INDIRECTTOTALPERSONAL INCOME/WAGES ( MILLIONS ,995249,875 5,694.6 7,118.2 12,812.7 173.3 216.7 390.0 5,867.9 7,334.9 13,202.7NANANA 5,867.9 7,334.9 13,202.7[This shaded section is not considered by MPA; see Memo to File, dated October 22, 2018]BUSINESS REVENUE/VALUE OF OUTPUT (MILLIONS )DIRECT 28,516.4INDUCED/INDIRECT 28,231.2TOTAL 56,747.6STATE/LOCAL TAXES (MILLIONS )DIRECTINDUCED/INDIRECTTOTAL 603.6 754.5 1,358.2 423.1 418.8 841.9 28,939.4 28,650.0 57,589.5NANANA 28,939.4 28,650.0 57,589.5 18.4 23.0 41.3 622.0 777.5 1,399.5NANANA 622.0 777.5 1,399.5Totals may not add due to rounding.In 2017, cargo and cruise activity at the public and private marine terminals at the Portof Baltimore generated 37,297 direct, induced and indirect jobs: 15,329 are direct jobs. These jobs are generated by activities at the Port, and if such activitiesshould cease, the jobs would be discontinued over the short term. It is these jobs that aremost directly dependent upon the Port of Baltimore. The direct jobs are with the InternationalLongshoremen’s Association, terminal operators, stevedores, trucking firms, railroads,steamship agents, freight forwarders and customhouse brokers, warehousemen, federal andstate government agencies, towing companies, pilot organizations, marine construction2 62,210.4 62,278.9
THE ECONOMIC IMPACTS OF THE PORT OF BALTIMORE, 2017companies, chandlers, etc. The majority, about 60 percent, of the direct jobs are held byresidents of the City of Baltimore and Baltimore County. 16,780 are induced jobs, or those jobs supporting the local purchases made by the 15,329individuals holding the direct jobs due to port activity. Should the direct jobs be lost from theeconomy, the induced jobs supported by the purchases of the direct jobs would also be lost.Jobs with local grocery stores, retail outlets, restaurants, transportation services, localgovernment services, schools and hospitals are examples of induced jobs. The firms’ dependent upon the Port of Baltimore made 609.9 million of local purchases foroffice supplies, equipment, utilities, communications, maintenance and repair services,transportation services, professional services and goods and services. These purchasessupported 5,188 indirect jobs in the Maryland economy. In addition to the direct, induced and indirect job impacts, the port activity supports 249,875jobs within the state that are related to the Port of Baltimore. Of these 249,875 related jobs,101,880 jobs are directly related to the cargo moving via the Port of Baltimore, while thebalance, 147,995 jobs, are indirect and induced related jobs. The direct related jobs are held byemployees of the firms exporting and importing cargo through the Port of Baltimore andinclude such varied entities as manufacturing firms, coal mines, and automobile dealers. Inaddition, the related jobs include the induced and indirect jobs created at each level ofproduction that are related to an imported product (through the Port of Baltimore) used as anintermediate input in a manufacturing activity, as well as the jobs created at each level ofactivity to produce an export product moved via the Port of Baltimore. For consumerimports, the related jobs include all jobs and economic activity that are required to the pointof final sale. These jobs are considered to be related to activities at the Port, but the degreeof dependence on the Port is difficult to estimate and should not be considered as dependenton the Port as are the direct, induced and indirect jobs. If the Port of Baltimore were notavailable to these organizations, they would suffer an economic penalty over the longer term.Such a penalty would vary from a loss of employment opportunities in some cases to anincrease in total transportation costs in other cases, which could, in turn, result in employmentreductions and corporate relocations.Port activity generated 3,331.4 million in personal wage and salary income forMaryland residents. The individual annual earnings in each category multiplied by the corresponding number ofemployees resulted in 961.2 million in personal income, for an average annual salary of about 62,708 per year for each job directly generated by maritime cargo and cruise activity at thePort of Baltimore.1 The Port has over 300 years of longevity, provides employmentThe average salary generated by cargo activity is 63,047, or 10.0 percent higher than the average state-wide salary in2017.13
THE ECONOMIC IMPACTS OF THE PORT OF BALTIMORE, 2017opportunities for a wide range of skill levels, and it is noteworthy that this average annualsalary is 9.5 percent higher than the 2017 average annual wage for the State of Maryland, 57,270, as reported by the U.S. Bureau of Labor Statistics. As a result of the multiplier effects of using a portion of this income for local purchases, 2,117.5 million in induced income and local consumption expenditures were created in thestate.2 The 5,188 indirectly employed received 252.7 million of indirect income. It is to be notedthat these are full time equivalent indirect employees.Businesses providing maritime services at the Port of Baltimore received 2,571.9million of revenue. The 2,571.9 million of revenue received by the businesses providing the services at the Portdoes not include the value of the cargo moving over the marine terminals, since the value ofthe cargo is determined by the demand for the cargo, not the use of the Port of Baltimore. Itis to be emphasized that only the portion of the revenue paid out in direct salaries, in state andlocal taxes, and for local purchases can be identified as a “Maryland impact”. Of the 2,571.9 million, 961.2 million was paid out in terms of direct salaries to the Marylandresidents employed by these firms. A total of 609.9 million of in-state purchases were made by the firms directly dependent onthe Port of Baltimore. These expenditures supported the 5,188 indirect jobs.A total of 395.2 million of state and local tax revenue was generated by port activityin 2017.In total, the economic value of the Port of Baltimore to the State of Maryland is 4,689.4million, which includes the direct business revenue and the re-spending/local consumptionimpact. These two dollar values are independent of each other an hence can be added together torepresent a total economic value to the State.2The multiplier effect represents the spending of a portion of the direct income earned by each directly created job forpurchases of goods and services. A portion of these purchases are used to pay the employees providing the goods andservices, while the other portion of the purchases are for the value of the goods and services provided less than the incomepaid to the induced employees. The total effect of the re-spending or multiplier impact is 2,117.5 million. This total respending impact includes the induced income component received by the induced job holders providing the goods andservices, as well as the value of the goods and services provided at the various levels of re-spending. Therefore, the totalre-spending impact cannot be divided by induced jobs to estimate induced salary, as this would be an overestimate ofpersonal income as it also includes the value of the purchases (less the income paid to the induced job holders).4
THE ECONOMIC IMPACTS OF THE PORT OF BALTIMORE, 2017In addition to the direct, induced and indirect impacts, cargo moving via the Port of Baltimorein 2017 generated 57,589.5 million of related economic activity. This represents the value of theoutput to the State of Maryland that is created due to the cargo moving via the Port of Baltimore’spublic and private marine terminals. This includes the value added at each stage of producing an exportcargo, as well as the value added at each stage of production for the firms using imported raw materialsand intermediate products that flow via the marine terminals and are consumed within the state. Alsoincluded is the revenue generated at each stage of delivery of a consumer import (via the Port) to thefinal sale. Of the 57,589.5 million of related economic activity, 28,939.4 million was directly receivedby the importers and exporters, while the balance was used for the purchase of support goods andservices. The majority of these user impacts are associated with imported containerized cargo via theMaryland Port Administration marine terminals. The 249,875 related direct, induced and indirectusers of the Port of Baltimore received 13,202.7 million of total wages and salaries. Finally, the cargoactivity at the Port of Baltimore generated 1,399.5 million of state and local taxes with the relatedusers.When the related impacts are included, the total economic value of the Port of Baltimore’smarine cargo and cruise operations is estimated at 62,278.9 million. The 62,278.9 million is ameasure of the economic value of the marine cargo and cruise vessel activity at a given point in time,2017, and consists of the direct business revenue impact generated by marine cargo and cruise activitythe public and private terminals, 2,571.9 million, plus the related economic value of the cargo activity, 57,589.5 million, and the induced/re-spending impact generated by the marine cargo activity at thepublic and private terminals and the cruise activity, 2,117.5 million. These components excludedouble counting and represent the total economic value of the cargo activity at the Port of Baltimorepublic and private marine terminals.Comparison of Cargo Generated Economic Impacts – 2014-2017The last economic impact study conducted for the Port of Baltimore was conducted by MartinAssociates in 2014. Since the last study, cargo activity at the public and private marine terminals hasincreased by 9.8 million tons. This increase in tons reflects the growth in coal exports (6.3 milliontons), containerized cargo (1.4 million tons), and other liquid bulk cargo (2.5 million tons) which alsoincludes the LNG exports estimated at Cove Point, MD. During that same period, cruise passengeractivity remained nearly constant, and therefore is not included in the comparisons.As a result of the growth in cargo activity at the Port of Baltimore’s public and private marineterminals, total direct, induced and indirect jobs generated by the marine cargo activity increased by3,442 jobs, business revenue grew by 386.6 million, local purchases increased by 85.2 million andstate and local taxes increased by 85.2 million over the 2014 levels. Of the 3,442 increased total jobs,778 of this job increase was driven by the growth of activity at the marine terminals owned and leasedby the Maryland Port Administration.5
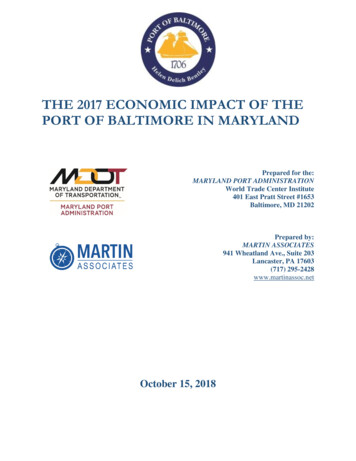
THE ECONOMIC IMPACTS OF THE PORT OF BALTIMORE, 2017I. OVERVIEW OF THE ANALYSIS AND SUMMARY OFMETHODOLOGY – MARINE CARGOMartin Associates was retained by the Maryland Port Administration to update the EconomicImpact Study of the Port of Baltimore conducted in 2014. For the most part, this update uses thesame methodology and impact definitions as the 2014 study, and, hence, the results are directlycomparable to the earlier study.3 Furthermore, a computer model specific to the Port of Baltimorehas been prepared which can be used in evaluating incremental impacts resulting from changes intonnage, labor productivity, labor work rules, commodity mix, inland origins/destinations of commodities and vessel size. In addition, the model will be useful in: Projecting the impacts of the recruitment of a new ocean carrier or a new shipper orconsignee to the Port of Baltimore;Evaluating potential investments in port facilities; andPreparing annual reports on the economic impacts of the Port.The methodology used in this analysis has been developed by Martin Associates and used toestimate the economic impacts of seaport activity at the majority of the seaports in the United Statesand Canada.This chapter presents an overview of the economic impact analysis by defining the following: The types of economic impacts estimated;The four economic sectors for which impacts have been estimated;The commodities/commodity types for which impacts have been estimated; andA summary of the data sources used in the analysis is presented.1. ECONOMIC IMPACT STRUCTUREA deep-water port such as Baltimore contributes to the local, regional and national economiesby providing employment and income to individuals, tax revenues to local and state governments andrevenue to businesses engaged in handling, shipping and receiving cargo via the seaport. Exhibit I-1shows the flow of economic impacts created by seaport activity at the public and private marineterminals at the Port of Baltimore.3 The Local and Regional Economic Impacts of the Port of Baltimore, 2014, prepared for the Maryland PortAdministration, July 30, 2015.6
THE ECONOMIC IMPACTS OF THE PORT OF BALTIMORE, 2017Exhibit I-1Flow of Economic Activity Created by the Port of BaltimoreSeaport ActivityValue ofImports/ExportsBusiness RevenuePayrollDirectJobsRelated UsersOutputRetained Earnings,Dividends rectJobsRelated UserPersonalIncomeRelatedUser JobsState & LocalTaxesActivity at a seaport (i.e., manufacturing, the handling of cargo and the servicing of vessels)initially creates business revenue to firms providing those cargo handling and vessel services.This revenue is in turn used for several purposes: To hire employees to provide the services;To pay stockholders dividends, retire debt, and invest;To buy goods from other firms; andTo pay federal, state, and local taxes.The hiring of employees generates personal income. This personal income is spentthroughout the state, local and national economies to purchase goods and services. This re-spendingof income is known as the multiplier effect, which in turn creates induced jobs throughout theeconomy. Finally, federal, state and local taxes are paid by those directly employed in port activity, aswell as the induced and indirect jobs holders.7
THE ECONOMIC IMPACTS OF THE PORT OF BALTIMORE, 2017The flow of economic impacts throughout an economy creates four separate and non-additivetypes of impacts. These four types of impacts are described below.1.1 Employment ImpactThe employment impact consists of direct jobs, induced jobs, indirect jobs and related jobs.The servicing of the vessels,
clerks, mechanics, teachers, dry cleaners, restaurateurs, coffeeshop owners, tutors, government employees, dentists, etc. 5,190 are indirect jobs, i.e. jobs supported by the business purchases of the employers who create the direct jobs. These jobs, too, would be lost in the short term if the direct jobs were lost. Examples include those who