Transcription
Demographics of Texas and the Aging ofthe PopulationJLL International Real EstateDallas, TXFebruary 22, 2018@TexasDemography
Texas is experiencing significant growth.
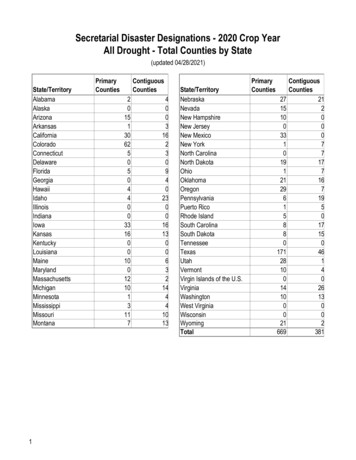
Growing States, 2000‐20172000PopulationUnited 539,687,65310,429,379740,6897.65%North : U.S. Census Bureau. 2000 and 2010 Census Count, 2017 Population Estimates.3
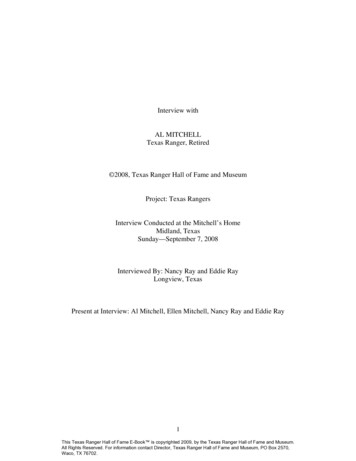
Total Estimated Population by County, Texas, 2016Dallam ShermanOchiltree LipscombHansfordHutchinsonHartley MooreRobertsHemphillOldhamPotter Carson Gray WheelerDeaf Smith RandallDonleyCollingsworthArmstrongParmer CastroBriscoe HallChildressSwisherHardemanWilbargerBailey Lamb Hale Floyd Motley CottleWichitaFoardClayLamarRed RiverMontagueCooke Grayson FanninBowieDeltaTitusJackWise Denton Collin Hunt HopkinsYoakum Terry Lynn Garza ortonRockwall RainsMarionWoodUpshurParker Tarrant DallasGaines DawsonBorden Scurry Fisher JonesStephensKaufmanVan Zandt Gregg HarrisonPalo ws MartinMitchell Nolan ardNavarroHillComancheLoving Winkler Ector ng CokeFreestoneRunnelsColeman rsonMillsSan Augustine SabineCraneCoryellTom GreenUpton ReaganLeon Houston baMcCullochRobertsonMadisonBellBurnetPolk Tyler JasperNewtonSchleicher MenardMilamWalkerPecosJeff DavisBrazosCrockettMason LlanoWilliamsonGrimes San espie Blanco residioHaysKerr KendallJeffersonEdwardsAustinHarrisFayetteVal VerdeRealComal rt BendGalvestonGonzalesLavacaBexarKinney Uvalde MedinaWhartonBrazoriaWilsonDeWittJacksonFrio Atascosa HockleyCrosbyDickens KingLubbockEl PasoHudspeth113 - 10,000Knox Baylor Archer10,001 - 50,000Dimmit50,001 - 100,000McMullenBeeLive OakLa SalleWebb100,001 - 500,000BrooksJim HoggKenedyStarrHidalgoWillacyCameronSource: U.S. Census Bureau, 2016 Vintage Population EstimatesCalhounSan PatricioAransasJim WellsNuecesDuvalKlebergZapata500,001 - 4,589,928Refugio
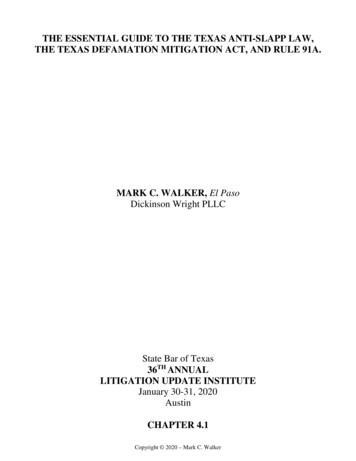
Estimated Population Change, Texas Counties, 2010 to2016Dallam ShermanOchiltreeLipscombHansfordHutchinsonHartley MooreRobertsHemphillOldham96 counties lost populationover the 6 year period.Potter Carson Gray WheelerDeaf Smith RandallDonleyCollingsworthArmstrongParmer CastroBriscoe HallChildressSwisherHardemanWilbargerBailey Lamb Hale Floyd Motley CottleWichitaFoardClayLamarRed RiverMontagueCooke GraysonFanninBowieDeltaTitusYoakum Terry Lynn Garza KentYoung Jack Wise Denton Collin Hunt tonRockwall RainsWood Upshur MarionDallasTarrantParkerGaines DawsonBorden Scurry Fisher JonesStephensKaufman Van Zandt Gregg HarrisonPalo ws MartinMitchell Nolan ardNavarroHillGlasscockComancheLoving Winkler Ector MidlandShelbyBosqueAndersonCherokeeSterling CokeFreestoneRunnelsColeman rsonMillsSan Augustine SabineCraneCoryellTom GreenUpton ReaganLeon Houston baMcCullochRobertsonMadisonBellBurnetSchleicher MenardPolk TylerJasperNewtonMilamWalkerPecosJeff DavisBrazosCrockettMason LlanoWilliamsonGrimes San espie Blanco residioHaysKerr KendallJeffersonEdwardsAustinHarrisFayetteVal VerdeRealComal rt BendGalvestonGonzalesBexarLavacaKinney Uvalde anHockleyCrosbyDickens KingLubbockEl PasoHudspeth-2,010 - 01 - 1,0001,001 - 20,000Knox Baylor ArcherDimmitMcMullenBeeLive OakLa SalleWebbRefugioCalhounSan PatricioAransasJim WellsNuecesDuvalKleberg20,001 - 100,000100,001 - 497,469Source: U.S. Census Bureau, 2016 Vintage Population EstimatesZapataBrooksJim HoggKenedyStarrHidalgoWillacyCameron5
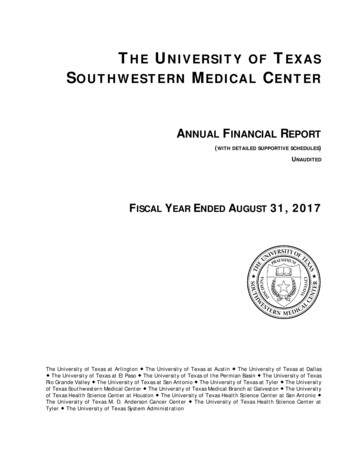
Estimated Percent Change of the Total Population byCounty, Texas, 2010 to 2016Dallam ShermanOchiltreeLipscombHansfordHutchinsonHartley MooreRobertsHemphillOldhamPotter Carson Gray WheelerDeaf Smith RandallDonleyCollingsworthArmstrongParmer CastroBriscoe HallChildressSwisherHardemanWilbargerBailey Lamb Hale Floyd Motley CottleWichitaFoardClayLamarRed RiverMontagueCooke pkinsYoakum Terry Lynn Garza ockmortonRockwall RainsWood Upshur MarionParker Tarrant DallasGaines DawsonBorden Scurry Fisher JonesStephensKaufmanVan Zandt GreggHarrisonPalo ws MartinMitchell Nolan ardNavarroHillGlasscockComancheLoving Winkler Ector MidlandShelbyBosqueAndersonCherokeeSterling CokeFreestoneRunnelsColeman rsonMillsSan Augustine SabineCraneCoryellTom GreenUpton ReaganLeon Houston loch San SabaRobertsonMadisonBellBurnetPolk TylerJasperNewtonSchleicher MenardMilamWalkerPecosJeff DavisBrazosCrockettMason LlanoWilliamsonGrimes San espie Blanco residioHaysKerr KendallJeffersonEdwardsAustinHarrisFayetteVal VerdeRealComal rt BendGalvestonGonzalesLavacaBexarKinney Uvalde MedinaWhartonBrazoriaWilsonDeWittJacksonFrio Atascosa HockleyCrosbyDickens KingLubbockEl PasoHudspeth-4.8% - 0%0.1% - 2.5%2.6% - 5%Knox Baylor ArcherDimmitMcMullenBeeLive OakLa SalleWebbRefugioCalhounSan PatricioAransasJim WellsNuecesDuvalKleberg5.1% - 10%10.1% - 18.1%BrooksZapataJim HoggKenedyStarrHidalgoWillacyCameronSource: U.S. Census Bureau, 2016 Vintage Population Estimates6
Components of Population Changeby Percent in Texas, 1950‐2010MigrationNatural .7%1990s2000s86.7%65.9%41.5%1950s1960sSource: U.S. Census Bureau, Population Estimates1970s1980s
Top Counties for Percent Growth* in opulationChangeKendallHaysComalWilliamsonFort 4%3.1%3.1%Source: U.S. Census Bureau, 2016 Vintage Population Estimates.*Among Counties with 10,000 or more population in 2016.PercentChange fromDomesticMigrationPercentChange 8%8.0%2.5%9.0%2.2%0.7%2.6%8
Top Counties for Numeric Growth in tonFort BendCollinTravisWilliamsonMontgomeryHidalgo*U.S. 0520,65919,76910,529Percent ofChange fromNaturalIncreasePercent Changefrom DomesticMigrationPercent 9.9%Hidalgo County had negative net migration (‐13.5% of total population growth).Source: U.S. Census Bureau, 2016 Vintage Population Estimates.9
Estimated Percent of Total Net‐Migrant Flows to and FromTexas and Other States, 201525.0%22.1%20.0%15.0%13.2%9.5%10.0%7.1%5.1% 5.1%4.5% 4.9%5.0%0.0%‐0.3% ‐0.1%‐5.0%‐2.9% ‐2.8% ‐2.5%‐3.4% ‐2.9%Source: U.S. Census Bureau, 2016. ACS Migration Flows, 20155.9%10.4%
Texas continues to diversify.
Texas Racial and Ethnic Composition,2000, 2010, and 201620002010Hispanic, 32%NH White,53%2016Hispanic,38%NH Black,NH Other,11%1%NH Asian,3%NH White,45%Hispanic, 39%NH White,43%NH Black,NH Other,12%2%NH Asian,4%NH Black,12%NH Other, 2%NH Asian, 5%Source: U.S. Census Bureau. 2000, 2010 Decennial Census and 2016 Population Estimates11
Racial and Ethnic Composition of Texas and Top 10 MostPopulous Counties, 2015NH WhiteTEXAS43.0%NH Black Hispanic NH Asian NH Other11.8%38.8%4.6%1.8%Denton County60.9%9.3%19.2%8.0%2.6%Collin County59.4%9.4%15.2%13.4%2.7%Travis County49.5%8.0%33.9%6.4%2.1%Tarrant County48.6%15.6%28.2%5.3%2.4%Fort Bend County34.6%20.1%24.1%19.2%1.9%Harris County31.0%18.5%42.0%7.0%1.6%Dallas County30.6%22.3%39.5%6.0%1.6%Bexar County28.7%7.3%59.5%2.7%1.7%El Paso County13.1%3.2%81.3%1.2%1.2%Hidalgo County7.0%0.5%91.3%1.0%0.2%Source: U.S. Census Bureau, 2015 Vintage Population Estimates12
Population Pyramids for Hispanics and Non‐HispanicWhites in Texas, 201014
Annual Shares of Recent Non‐Citizen Immigrants toTexas by World Area of Birth, 4%61.0%7.8% 7.0%7.7% 6.5%26.8%59.0%33.0%50.6%25.5%57.4%7.3% 9.1%9.9% 7.2%7.1% 7.8%34.3%50.9%40.4%42.9%33.6%48.6%35.8%44.1%Latin America6.2% 10.4%28.2%57.0%20095.7% 7.6%19.9%66.8%20077.8% 5.5%17.3%69.4%AsiaSource: U.S. Census Bureau, American Community Survey, 1‐Year PUMSEurope9.0% 7.8%8.3%7.1%9.5%13.1%Africa and Other15
Unauthorized and Mexican Immigration, 201516
Texas is young, but aging.
States with the Oldest and Youngest Median Ages,2000, 2010, 2014200020102014RankStateMed AgeRankStateMedian AgeRankStateMedian Age1West nt41.52New Hampshire42.63Maine38.63West Virginia41.33Vermont42.64Pennsylvania384New Hampshire41.14West Virginia42.05 Vermont37.75 Florida40.75 Florida41.8 46California33.3 46California35.2 46Idaho35.747Idaho33.247Idaho34.647North 0Utah30.535.3‐37.2‐‐United StatesUnited StatesUnited States37.7Source: US Census Bureau, 2000 and 2010 Decennial CensusesUS Census Bureau, 2014 Population Estimate by State18
Median Age, Texas Counties, 2012‐2016Hansford OchiltreeDallam ShermanLipscombHemphillHartley MooreRobertsHutchinsonOldham PotterGray WheelerCarsonDeafDonleySmith RandallArmstrongCollingsworthCastroSwisherHall ottleFloydLambFoardMotleyWichita ClayLubbockCooke Grayson Lamar RedBaylor ArcherDickens KingRiver kmortonTerryCollinKentHopkins Titus CassWiseDentonHuntLynn GarzaYoakumYoungHaskellMorrisRockwall Rains Camp WoodParkerUpshurBorden ScurryJones StephensHarrisonGainesPintoDallas VanFisherSmith GreggHood EllisAndrews MartinEastland l PasoGlasscockLovingEctorHillRunnelsComanche BosqueAndersonCulbersonMidland Sterling CokeWinklerFreestoneColeman Brown tonWardSan neLeonIrion Green ConchoReevesFallsTrinitySanMcCullochLampasas Bell Robertson MadisonJasperSabaPolkSchleicher MenardBurnetMilam Brazos Walker SanTylerLlanoPecosJeff DavisCrockettMasonNewtonWilliamson Burleson Grimes JacintoSutton Kimble ington WallerTerrellEdwardsLibertyPresidioKerrKendall Hays BrewsterAustinReal BanderaFort ChambersGuadalupeColorado BendUvaldeGonzalesGalvestonBexarMedinaLavaca WhartonKinneyBrazoriaWilson DeWittJacksonMaverick Zavala Frio AtascosaVictoria MatagordaKarnesGoliad CalhounMcMullenLaLive Bee RefugioDimmitSalleOakAransasJim WellsHockley26-3233-3637-4041-45WebbSource: U.S. Census Bureau, 2016 American Community Survey 5‐Year edyHoggStarrWillacyHidalgoCameron19
Texas Population by Age Group, 2000 to ngeUnder 20.918 to 73429.965 and 6,105,13829.3Source: US Census Bureau, 2000 and 2010 Censuses, QT‐P1 and derived from QT‐P120
Population Projections by Age Group,2010 to 2050Age 5 and 6,7241,365,653293.385 205,501401,647603,6441,061,3431,590,868421.3Total 54,369,297116.2Source: US Census Bureau, 2010 CensusTexas State Data Center, 2014 Projections, 1.0 Migration Scenario21
Population 65 years plus, Texas Counties, 2012‐2016Hansford OchiltreeDallam ShermanLipscombHemphillHartley MooreRobertsHutchinsonOldham PotterGray WheelerCarsonDeafDonleySmith RandallArmstrong CollingsworthCastroSwisherHall ottleFloydLambFoardMotleyWichita ClayLubbockCooke Grayson Lamar RedBaylor ArcherDickens KingRiver kmortonTerryCollinKentHopkins Titus CassWiseDentonHuntLynn GarzaYoakumYoungHaskellMorrisRockwall Rains Camp MarionStonewallDawsonShackelfordTarrant Kaufman Wood UpshurPaloParkerScurryBordenJones StephensHarrisonGainesPintoDallas VanFisherSmith GreggHood EllisAndrews MartinEastland l PasoGlasscockLovingEctorHillRunnelsComanche BosqueAndersonCulbersonMidland Sterling CokeWinklerFreestoneColeman Brown tonWardSan SabineIrion Green ConchoReevesFallsTrinitySanMcCullochLampasas Bell Robertson MadisonJasperSabaPolkSchleicher MenardBurnetMilam Brazos Walker SanTylerLlanoPecosJeff DavisCrockettMasonNewtonWilliamson Burleson Grimes JacintoSutton Kimble ington WallerTerrellEdwardsLibertyPresidioKerrKendall Hays BastropJeffersonHarrisValVerdeComalCaldwell FayetteBrewsterAustinReal BanderaFort ChambersGuadalupeColorado BendUvaldeGonzalesGalvestonBexarMedinaLavaca WhartonKinneyBrazoriaWilson DeWittJacksonMaverick Zavala Frio AtascosaVictoria MatagordaKarnesGoliad CalhounMcMullenLaLive Bee RefugioDimmitSalleOakAransasJim WellsHockleyLess than 5,0005,000 - 14,99915,000 - 29,99930,000 - 74,999WebbDuvalNuecesKleberg75,000 or MoreZapataBrooksJimKenedyHoggStarrSource: U.S. Census Bureau, 2016 American Community Survey 5‐Year EstimatesWillacyHidalgoCameron22
Percent of Population 65 Years Plus, Texas Counties,2011‐2015Dallam ShermanOchiltreeLipscombHansfordHutchinsonHartley MooreRobertsHemphillOldhamPotter Carson Gray WheelerDeaf Smith RandallDonley CollingsworthArmstrongParmer CastroBriscoe HallChildressSwisherHardemanWilbargerBailey Lamb Hale Floyd Motley CottleWichitaFoardClayLamarRed RiverMontagueCooke pkinsYoakum Terry Lynn Garza KentHuntYoungHaskellMorris CassFranklinStonewallThrockmortonRockwall RainsWood Upshur MarionDallasTarrantParkerGaines DawsonBorden Scurry Fisher JonesStephensKaufmanVan Zandt GreggHarrisonPalo ws Martin HowardMitchell Nolan arroHillComancheLoving Winkler Ector ng CokeFreestoneRunnels rdCulbersonMillsSan AugustineSabineCraneCoryellTom GreenUpton ReaganLeon Houston loch San SabaRobertsonMadisonBellBurnetSchleicher MenardPolk TylerJasperNewtonMilamWalkerPecosJeff DavisBrazosCrockettMason LlanoWilliamsonGrimes San espie Blanco residioHaysKerr KendallJeffersonEdwardsAustinHarrisFayetteVal VerdeRealComal rt BendGalvestonGonzalesLavacaBexarKinney Uvalde MedinaWhartonBrazoriaWilsonDeWittJacksonFrio Atascosa nCalhounBeeDimmitLive OakRefugioLa SalleCochranHockleyCrosbyDickens KingLubbockEl PasoHudspeth8% - 10%11% - 15%Knox Baylor Archer16% - 20%WebbSan PatricioAransasJim WellsNuecesDuvalKleberg21% - 25%26% - 34%ZapataBrooksJim HoggKenedyStarrHidalgoWillacyCameronSource: U.S. Census Bureau, 2015 American Community Survey 5‐Year Estimates30
Change in Median Age, Texas Counties, 2000‐2014LipscombHansford OchiltreeDallamShermanChange in Median Age, 2000-2014HartleyOldham1 to 5 Years Younger (27 Counties)HemphillRobertsPotter ndallSwisherParmer CastroNo Change (57 HardemanWilbargerLamb2 to 3 Years Older (100 Counties)4 to 5 Years Older (49 Counties)BaileyCochranHaleLubbockFloyd Motley Cottle FoardCrosbyWichita ClayDickensKingKnox Delta FranklinTitusCassHunt HopkinsMorrisRockwall Rains CampPaloDawsonMarionShackelfordScurryDallasWood UpshurPinto Parker TarrantGainesFisherStephensHarrisonKaufman VanBordenJonesGreggJohnsonHoodZandt SmithCallahanPanolaEastlandEllisHendersonAndrews Martin Howard Mitchell Nolan TaylorRuskErath ndSterlingAnderson NacogdochesBrownHamiltonRunnelsReaganUptonSan eAugustineCraneMcCullochCoryellLeonGreen nitySabaJasperRobertson MadisonBellBurnetPolkSchleicher MenardTylerJeffMilamWalkerCrockettPecosSanMason tonKimbleHardinLeeMontgomeryGillespie Blanco risFayetteBrewsterRealVerdeChambersComal aWilsonDeWittYoakumHockleyTerry WiseFanninDenton CollinGreater than 5 Years Older (21 Counties)El PasoHudspethMaverickZavalaDimmitLa SalleWebbVictoriaAtascosa e BeeRefugioOakJimSan AransasWells PatricioDuvalNuecesKlebergJimZapata Hogg BrooksSource: US Census Bureau US Census Bureau, 2000Decennial Census, SF‐1, Population Estimates 2014 Vintage.StarrHidalgoKenedyWillacyCameron24
Trends in Aging* by County, Texas, 2000‐2014*2000 median age 30 and greater old. 2000 to 2014 determines aging.Source: U.S. Census Bureau, 2000 decennial census and 2014 American Community Survey 5‐Yr estimates.25
Percent of Population 65 plus with Independent LivingDisability, Texas Counties, 2012‐2016Sherman OchiltreeLipscombDallam HansfordHemphillRobertsHartley MooreHutchinson WheelerCarson GrayOldhamPotterCollingsworthDeaf RandallDonleySmithArmstrongParmerSwisherHall ChildressCastro BriscoeHardemanWilbargerBailey Lamb Hale FloydCottleRedFoard Wichita Clay CookeLamar RiverCochran Lubbock Dickens King KnoxMontague GraysonArcherBowieFannin DeltaBaylorYoakum Hockley CrosbyHaskellJack DentonKentTitusCollinYoungTerry LynnCassHunt HopkinsStonewallWiseGarza ScurryThrockmortonRains pshurJonesPintoTarrantHarrisonDawsonZandt SmithTaylor Eastland HoodNolanRusk ath SomervellHowardCallahanCherokeeLovingBosque Hill NavarroEl PasoCokeShelbyEctor Midland SterlingLimestone AndersonRunnels Coleman cLennanHudspeth CulbersonTom Concho BrownMillsWardHouston San AugustineCoryellIrion GreenUptonSabineLeonFallsReevesSan LampasasTrinity AngelinaReaganMcCulloch SabaRobertsonJasperMadisonBurnet BellSchleicher Menard LlanoMilam Brazos Walker Polk Tyler NewtonPecosCrockettJeff y HardinSuttonKimble GillespieTravisWashington onPresidioKerr Kendall HaysHarrisVal VerdeBrewsterWallerReal Bandera Comal CaldwellFayetteChambersColorado FortGuadalupeUvaldeGalvestonBendBexar GonzalesKinneyLavaca WhartonMedinaWilson DeWittJackson BrazoriaVictoria MatagordaMaverick Zavala FrioAtascosa Live GoliadCalhounOakDimmit LaBee RefugioSalle McMullenSan AransasJimWells PatricioWebb DuvalNuecesKleberg10% or Less10.1% - 15%15.1% - 25%25.1% - 35%Greater than 35%Jim BrooksZapata HoggKenedyStarrWillacyHidalgoSource: U.S. Census Bureau, 2016 American Community Survey 5‐Year EstimatesCameron26
27
28
Population Projections
Projected Population Growth in Texas,2010‐20506055Millions5045Zero Net MigrationHalf 2000 ‐20102000 ‐20102010 ‐20154035302520Source: Texas State Data Center, 2016 Preliminary Population Projections30
Projected and Estimated Population Growth in Texas,2010‐20203130Millions29Zero Net MigrationHalf 2000 ‐20102000 ‐20102010 ‐201528Estimates27262524Source: Texas State Data Center, 2016 Preliminary Population Projections and U.S. Census Bureau, 2016 Population Estimates31
Projected Racial and Ethnic Percent, Texas, H‐Other5,000,0000Source: Texas State Data Center 2012 Population Projections , 2000‐2010 Migration Scenario32
4540%4035%3530%3025%2520%2015%151010%55%00%Percent of Total Populationin MillionsPopulation by Age Group and as Percent of the Total TexasPopulation, 1950‐20501950 1960 1970 1980 1990 2000 2010 2015 2020 2030 2040 2050TotalPercent under 18Source: Texas Demographic Center 2014 Population Projections , 0.5 Migration ScenarioPercent 65 and over33
Population Projections 65 Years and Over byRace/Ethnicity, Texas, 2010‐20503,500,0003,000,0002,500,000NH White2,000,000NH BlackHispanic1,500,000NH Source: Texas State Data Center 2014 Population Projections , Half 2000‐2010 Migration Scenario2045205034
Texas Racial and Ethnic Composition, 1980 to 2050Source: U.S. Census Bureau, 1980 to 2010 Decennial Censuses; Texas Demographic Center, 2014 Population Projections, Half Migration Scenario35
Percent of Population by Race/Ethnicity for AgeGroups, 2010 and 205020102050100%100%90%80%80%% NH White70%60%% Black50%40%67.730%20%% Hispanic% NH Other10%Percentage of Age GroupPercent of Age Group90%20.570%4260%50%40%30%20%3510%0%0%Under 18 years18 to 64 years65 years and overAge GroupsSource: US Census Bureau, State Population Estimates, 20140‐17 Years18‐64 Years65 Years and OlderAge GroupsSource: Texas State Data Center, 2014 Projections,1.0 Migration Scenario36
Lila Valencia, Ph.D.Office: (512) .gov@TexasDemography37
Growing States, 2000‐2017 3 2000 Population 2010 Population 2017 Population Numeric Change 2010‐2017 Percent Change 2010‐2017 United States Source: U.S. Census Bureau. 2000 and 2010 Census Count, 2017 Population Estimates.