Transcription
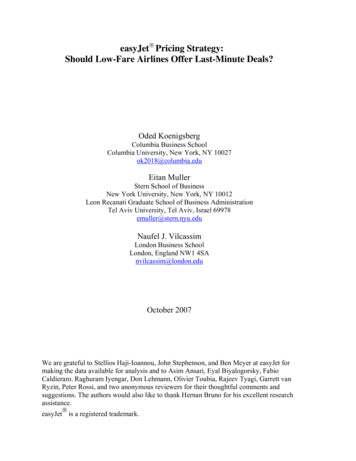
easyJet Pricing Strategy:Should Low-Fare Airlines Offer Last-Minute Deals?Oded KoenigsbergColumbia Business SchoolColumbia University, New York, NY 10027ok2018@columbia.eduEitan MullerStern School of BusinessNew York University, New York, NY 10012Leon Recanati Graduate School of Business AdministrationTel Aviv University, Tel Aviv, Israel 69978emuller@stern.nyu.eduNaufel J. VilcassimLondon Business SchoolLondon, England NW1 4SAnvilcassim@london.eduOctober 2007We are grateful to Stellios Haji-Ioannou, John Stephenson, and Ben Meyer at easyJet formaking the data available for analysis and to Asim Ansari, Eyal Biyalogorsky, FabioCaldieraro, Raghuram Iyengar, Don Lehmann, Olivier Toubia, Rajeev Tyagi, Garrett vanRyzin, Peter Rossi, and two anonymous reviewers for their thoughtful comments andsuggestions. The authors would also like to thank Hernan Bruno for his excellent researchassistance. easyJet is a registered trademark.
easyJet Pricing Strategy:Should Low-Fare Airlines Offer Last-Minute Deals?AbstracteasyJet, one of Europe’s most successful low-cost short-haul airlines, has a simple pricingstructure. For a given flight, all prices are quoted one-way, a single price prevails at any point,and, in general, prices are low early on and increase as the departure date approaches. Weobserve from these policies and from the empirical section of this paper that easyJet employsthree distinct strategies: 1) it does not offer last-minute deals, 2) it offers a single class and letsprice be the sole variable that controls demand, and 3) it varies the time at which tickets arefirst offered for sale (duration of sale). The first two policies are in stark contrast to traditionalairline pricing strategies. Many airlines offer last-minute deals, either directly or via resellers.Second, the current prevailing practice is to control demand via seat allocation to variousclasses rather than by offering a single class and letting price be the sole variable that controlsdemand.The main objective of this research is to study the conditions under which offering a lastminute deal is optimal under the single-price policy. We also learn how the duration of ticketsales is affected by consumer characteristics. We find that, for an intermediate capacity level,uncertainty with respect to the arrival of the business segment will cause the firm to offer lastminute deals and thus partially price-discriminate within the tourist segment. The same is truefor uncertainty with respect to the actual behavior of the firm: if consumers are uncertainwhether the firm will offer last-minute deals, then, in equilibrium, both in a one-shot game andin a repeated game, the firm will, with some probability, offer such deals. In addition, wefound that for an intermediate capacity level, the larger the number of segments (that differ inprice sensitivity), the longer the duration of the period in which tickets are offered for sale.1
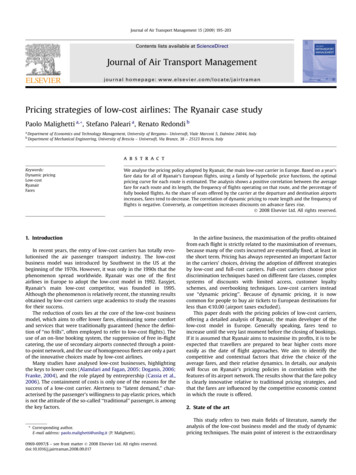
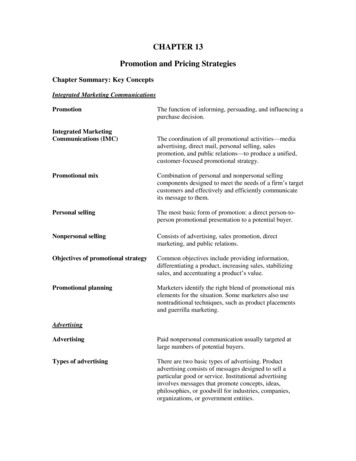
1. IntroductionLow-cost carriers have become major players in the airline industry around the world.Airlines such as easyJet and Ryanair in Europe and Southwest and JetBlue in the U.S. areforcing major changes in pricing schemes. easyJet has emerged as one of the most successfullow-cost airlines in Europe since its launch in 1995. One key aspect of its marketing strategy isa simple fare structure in which all fares are quoted one-way and a single price is quoted forall seats on a given flight at any point in time and without any restrictions (such as a requiredSaturday-night stay). However, the price charged for a seat on a given flight changes over theperiod between seats on the flight being made available for booking and the date of departure.All easyJet sales are booked directly either online or by telephone. The company’s website(www.easyJet.com) describes its pricing policy as being “based on supply and demand, andprices usually increase as seats are sold on every flight. So, generally speaking, the earlier youbook the cheaper the fare will be.”In Figures 1a and 1b, we plot over time the number of seats sold on a given date and theprice charged per seat for a flight between Liverpool, England, and Alicante, Spain, departingon a Monday in the winter of 2003 and another between Stansted (a London airport) andEdinburgh, Scotland, departing on a Monday in the summer of 2003. Certain distinct patternsare evident from Figures 1a and 1b. We note that seat sales in both cases exhibit a discretepattern: for the Liverpool-Alicante flight, sales are spread out over time but there is a surge insales two to three weeks after the flight becomes available for booking; for the LondonEdinburgh flight, sales are sparse in the first half of the period, followed by a surge in sales ona certain date and then moderate activity toward the end of the period. Thus, there seems to be1
some uncertainty in the pattern of demand. Moreover, while in both cases there is a clearupward trend in the price charged, there is a distinct difference in the magnitude of the change.Figure 1a: Seats sold and prices paid (in British pounds) for a one-way ticket fromLiverpool to Alicante (flight date January 27, 2003)Figure 1b: Seats sold and prices paid (in British pounds) for a one-way ticket fromLondon to Edinburgh (flight date July 21, 2003)For the Liverpool-Alicante flight, the price increases about 2.5 times, from about 40 to 100, whereas the price increase for the London-Edinburgh flight is about 4.5 times, fromaround 20 to a high of 90.2
We observe from these policies and from the empirical section of this paper that easyJetemploys three distinct strategies: 1) it does not offer last-minute deals, 2) it offers a singleclass and lets price be the sole variable that controls demand, and 3) it varies the time at whichtickets are first offered for sale (duration of sale). The first two policies are in stark contrast totraditional airline pricing strategies. Many airlines offer last-minute deals, either directly or viaresellers. For example, in some European airports, one can buy tickets at greatly reducedprices for same-day flights. Second, as we show in the next section, the current prevailingpractice is to control demand via seat allocation to various classes rather than by offering asingle class and letting price be the sole variable that controls demand.The main objective of this research is to study the conditions under which offering a lastminute deal is optimal under a single-price policy. We also learn how the duration of ticketsales affects the consumer characteristics. We find that, for an intermediate capacity level,uncertainty with respect to the arrival of the business segment will cause the firm to offer lastminute deals and thus partially price-discriminate within the tourist segment. The same is truefor uncertainty with respect to the actual behavior of the firm. That is, if consumers areuncertain whether the firm will offer last-minute deals, then, in equilibrium, both in a one-shotgame and in a repeated game, the firm will, with some probability, offer such deals. Inaddition, for an intermediate capacity level, we found that the larger the number of segments(that differ in price sensitivity), the longer the duration of the period in which tickets areoffered for sale.The rest of this paper is organized as follows; in section 2, we relate our research to theextant literature on airline pricing. In section 3, we describe our empirical study that analyzesthe pattern of the data to construct the model’s assumptions. In section 4, we present thestructure of the model and its underlying assumptions. This presentation is followed by the3
derivation of our primary analytical results in section 5. In section 6, we conclude byidentifying issues for future research.2. Airline Ticket Pricing and Yield ManagementOur research on airlines’ low-fare strategies draws from the literature on airline pricing ineconomics (Dana 1998, 1999; Kretsch 1995; Borenstein and Rose 1994; Morrison andWinston 1990) and marketing (Biyalogorsky et al. 1999, 2005 Carpenter and Hanssens 1994)and on revenue-management literature in operations research. Our modeling of consumers’choices is in line with that of Dana (1998), who assumed that there are two types ofconsumers—leisure travelers and business travelers—who have differing (point) valuations forthe service and differing probabilities of usage. In our model, we assume that the consumersegments’ valuations are derived from differing (uniform rather than point) distributionfunctions. Like Dana (1998), we also assume that the two segments have differing levels ofuncertainty regarding flights. We assume that leisure consumers regard the flight withcertainty but that business consumers have uncertainty regarding the need to take the flightand thus the value placed on it. A major difference between our model and Dana’s (1998) isthat, when demand exceeds capacity, Dana’s model resolves excess demand by rationingwhile in our model the firm uses price to control demand. The resulting continuousdistribution allows us to let price depend on remaining capacity and thus control remainingdemand.The analysis here also ties into operations research literature on revenue (yield)management. McGill and van Ryzin (1999) provide a detailed survey of revenue managementwherein they discuss four areas: forecasting, overbooking, seat inventory control, and pricing.4
Traditionally, the operations literature on airline revenue management has been concernedwith seat inventory and capacity-planning problems (see Talluri and van Ryzin (2004) for anextensive review). This is in contrast to revenue management in other industries; Talluri andvan Ryzin (2004) noted that “some industries use price-based RM (retailing), whereas othersuse quantity-based RM (airlines). Even in the same industry, firms may use a mixture of priceand quantity-based RM. For instance, many of the RM practices of the new low-cost airlinesmore closely resemble dynamic pricing than the quantity-based RM of the traditional carriers”(p. 176).Recently, a growing body of revenue-management research has examined pricingdecisions, including Talluri and van Ryzin (2004), You (1999), Feng and Gallego (1995),Gallego and van Ryzin (1994, 1997), and Watherford and Pfeifer (1994). The majority of thisresearch assumes that consumers are myopic. In a recent survey on dynamic pricing,Elmaghraby and Keskinock (2003, p. 1298) wrote that “An important element that is largelymissing, both in most of the academic literature and price optimization software, is theconsideration of strategic customer behavior” and that “An interesting but equally challengingresearch direction would be to incorporate into the models customers’ strategic purchasingbehavior in response to the firm’s pricing strategy.” For example, while Talluri and van Ryzin(2004) focus almost exclusively on myopic consumers, when they do consider strategicconsumers they consider only the case in which the firm has no capacity constraint. Recentexceptions that include strategic consumers are the working papers by Jerath, Netessine andVeeraraghavan (2007), Ovchinnikov and Milner (2007), and Liu and van Ryzin (2006).Our research thus differs from past research in several aspects. First, we assume thatconsumers are forward-looking and therefore behave strategically. Note that although airlinetickets are a perishable good, there are some similarities to the strategic behavior of consumers5
in durable goods (see Desai, Koenigsberg and Purohit (2004), and Shulman and Coughlan(2007) for recent examples). Second, under the condition in which the single-price businessmodel is used by low-cost carriers, we investigate the conditions under which it pays to offerlast-minute deals. Third, in most other yield-management models, demand exceeding capacitywas resolved by rationing while in our model firms use price to control demand.3. Empirical AnalysisIn this section we utilize data from a European low-cost carrier, easyJet, first to observeits pricing and demand patterns. Using these observations, we learn about the existence ofmarket segments that vary by price sensitivity, a central assumption of our model.For our empirical analysis, we collected data on twenty-three easyJet flights between sixdifferent European city pairs during the year 2003, some in winter and others in summer. Theflights departed on two different days of the week, Monday and Sunday. For each flight, thedata include the number of seats sold per day (if any) and the price at which each seat wassold, from the first day on which seats went on sale through the date of departure. This periodranged from 63 days for a flight between Liverpool, England, and Alicante, Spain, to 211 daysfor a flight between East Midlands, England, and Barcelona, Spain. Additionally, we receiveddata on the total number of seats available for each of easyJet’s flights between the city pairs.Since we later assume the existence of two segments of consumers (tourists and businesstravelers), the first phase of analysis was to test the validity of this assumption. The datasuggest that customers arrive at discrete points in time, so a latent-class Poisson regressionmodel is an appropriate method (Wedel et al. 1993).6
The negative binomial (NB) distribution also has been used in previous research to modelaggregate demand for airline seats as it overcomes some well-known limitations of a Poissonmodel. We note that an aggregate NB model for demand can be derived by assuming thatdemand is Poisson at the individual level and by accounting for heterogeneity amongindividuals using a gamma distribution. In our analysis, we model demand at the individuallevel using a Poisson model but account for heterogeneity using a latent-class approach, whichalso can be interpreted as providing a finite approximation to any mixing distribution, such asthe gamma. Therefore, the demand model we use is quite flexible. We also added a timedimension to the Poisson regression so as to capture the fact that both bookings as well asprice increase towards final flight time.Let the index j denote the relevant latent segment. If the customers’ arrival rate is givenby λ j λ j0 exp(β j p g j (t ) ), for some increasing continuous function g(t), then theprobability that in any given period y customers buy tickets at a price p is(L) θ j λ yj exp( λ j )/ y! ,P Y y / p, β j , θ j j 1Lwhere θ j 1j 1In the preceding equation, θj is the probability that the arriving customer belongs to thelatent class, or segment j 1, 2, , L. Since we noted from the data that bookings seem toincrease at an increasing rate with time, we have the specified the function g(t) as a quadraticequation of time. We estimate the parameters of the latent-class Poisson regression modelusing maximum-likelihood methods. Because the number of segments is unknown, weincrementally add segments until there is no improvement in the fit of the model as measuredby the Bayesian information criterion (BIC); in other words, we increase the number of7
segments from one to two to three and so on until the BIC value is minimized (seeChintagunta, Jain, and Vilcassim (1991)). The results of the estimation are shown in Table 1.We note from Table 1 that the fit of the Poisson regression model improves considerablywhen going from one segment to two segments in all cases except for two. For all flights, thetwo-segment solution fits the data better than the three-segment solution. Thus, there is strongempirical support for our modeling assumption of two segments of customers.Table 1: Bayesian information criterion for the twenty-three flightsFlight Number1234567891011121314151617181920212223BIC ValuesOne 2.4142.4160.4161.5Two 38.2148.1141.6Three 5.0153.1165.2159.4We next examine the relationship between airline seat prices and time and how the natureof this relationship depends on available seat capacity. For each time period (Timeit, a week inthis case) and for each flight (twenty-three flights in all), we estimate the following regressionmodel for the price variable: Pr iceit α i β i Timeit ε it .8
To determine how the preceding relationship varies with seat capacity, we letβ i ν η C i δ Summer Dummy λ Sunday Dummy μ iwhere Ci denotes the capacity of flight i and where Summer Dummy {1 if the flight is in thesummer and 0 if it is in the winter} and Sunday Dummy {1 if the flight is on a Sunday and0 if it is on Monday} are two control variables that we introduce because they could affect therate at which price changes. The results of the regression are given in Table 2.Table 2: Regression results: Price vs. capacityRegression AnalysisPrice – TimeRegressionFlightInterceptNumber (αι)PriceSlope 640.7060.8890.6791.061VariableInterceptPrice Slope – CapacityRegressionEstimate(standard error)6.597(2.569)Capacity–4.058(1.967)Summer Dummy–1.148(0.623)Sunday Dummy0.051(0.617)R-Square925.8%
We see from Table 2 that, in the price versus time regression, twenty of the twenty-threeslope coefficients (βi) are positive and the overall mean is positive (1.061). Thus, priceincreases over time. We also note from the price-slope-versus-capacity regression in Table 2that the coefficient of the capacity variable is significantly different from zero and negative,implying that the rate at which price changes decreases as capacity increases.Another way to look at the relationship between price and capacity is to regress priceagainst remaining capacity. For each time period (Timejt, a week in this case) and for each pairof cities (six pairs), we estimate the following six regression models for each city pair (fourflights per city for five city pairs and three flights per city pair for a single flight) for theremaining capacity variable (RemCapjt, j 1, 2, . . . J).Pr ice jt α i γ j Re mCap jt δ Summer Dummy λ Sunday Dummy ξ jt .Table 3: Regression results: Price vs. remaining capacityRouteLondon (Stansted) – EdinburghNo. ofFlights4γ - Effect of RemainingCapacity on PriceR-square(standard error)–0.31675.4%(0.026)East Midlands– Edinburgh4–0.15574.6%(0.011)London (Stansted) – Rome (Ciampino)4–0.12885.8%(0.023)East Midlands– Barcelona4–0.2587.7%(0.029)Liverpool– Alicante4–0.13765.2%(0.098)London (Luton)– Malaga3–0.14549.6%(0.041)Based on the previous result, our hypothesis is that the parameters γ j are negative. Theresults of the regression are given in Table 3. We see from Table 3 that, for price versusremaining capacity, all of the slope coefficients ( γ j ) are negative with an overall mean of10
-0.189. In addition, the fit of the models as measured by the R-Squared values suggests thatthis relationship between capacity and price is well captured.To summarize, our main descriptive empirical findings are that ticket prices increase overtime and that the rate of increase varies negatively with remaining seat capacity. Also, we findclear evidence for at least two segments of consumers that vary according to their arrivaltimes. In addition, we observe that easyJet does not resort to any last-minute deals to clearcapacity. The interesting question we address next is whether and under what conditions thesepricing polices are optimal.4. Model DevelopmentWe consider a one-way airline route between two cities with a monopoly serviceprovider. We assume two segments of customers: Higher valuation and lower valuationconsumers. We define higher valuation consumers as business travelers (denoted by B) andlower valuation consumers as tourist travelers (denoted by T) although as Talluri and vanRyzin (2004, p. 517) note, in practice the distinction between business and leisure travels isnot so clear cut. The consumers can arrive in two, three, or four time periods depending onwhether the firm offers last-minute deals, on the duration of the sales period, and on consumercharacteristics (as specified later). The tourists’ utility from the travel is uniformly distributedover an interval of (0, α). The business travelers’ utility from the travel is distributeduniformly over an interval of (α , α ) .Both tourist and business consumers arrive in the first two periods. Tourist consumerswho did not purchase tickets in period 1 or 2 also arrive during the third period. Since ourmain interest is in the proportion of business and tourist travelers, we assume that all tourists11
and a fraction γ of the business segment arrive during the first period. The remainder (1 – γ) ofthe business segment appears in the second period (alternatively, we could have made the dualassumption that business consumers arrive in both periods and only a fraction of the touristsarrive in the first period). The business consumers who arrive during the second period haveuncertainty with respect to their utility. With probabilityθ, the business segment learns duringperiod 2 that business meetings that require air travel will be held at the destination city and itsutility is distributed over the interval of (α , α ) . With probability (1 – θ), these businessmeetings are not held and the utility from the air travel thus equals zero. To create a clear-cutsegmentation between business travelers and tourists, we assume that the upper bound of thevaluation of the business traveler is much higher than that of the tourist; in other words,α α /2.There are two events in period 1: first the airline announces the price and then consumersdecide whether to buy. There are three events in period 2: the airline announces the price,uncertainty about the state of the business passengers is resolved, and, finally, consumersdecide whether to buy tickets. In period 3 (if it exists), the firm may announce a price andtourist consumers who have a higher valuation than this price purchase tickets. Let fi (x) (i B,T) be the density of consumer distribution. Because the tourist customers are distributeduniformly in the interval (0, α), if the price in period 1, 2, or 3 is p, then the tourists whoseutility is greater than the price will buy tickets. Thus, the proportion of tourists who buy seatsαat price p is represented by f T ( x)dx (α p) / α . Similarly, the proportion of businesspαpassengers buying tickets at price p is represented by fp12B( x) dx (α p ) /(α α ) .
When we define the number of tourist passengers as MT and the number of businesspassengers as MB, their respective demands at price p are given by MT (α - p) /α and MB ( α -p)/ ( α -α). To simplify notations, we normalize the market sizes as follows: NT MT /α and ΝΒ MB / ( α - α). An important part of our model is that consumers are forward looking, andBtherefore will decide to purchase a ticket in period i (i 1, 2, 3) if the utility in the period willbe positive and higher than the utility of purchasing in other periods. Therefore, the followingequations represent demand in the three periods:period 1 N T LT 1 (α p1 ) γ M BD1 γ N B LB1 (α p1 )period 2 N T LT 2 (α p 2 ) (1 γ ) M BD2 (1 γ ) N B LB 2θ (α p 2 )period 3 N T LT 3 (α p 3 )D3 0if p1 αif α p1 αif p 2 αif α p 2 αif p 3 αif p 3 αLji is an identity function that equals one if and only if segment j (j T, B) purchases theproduct in period i; it is zero otherwise. Without loss of generality, let the marginal cost ofsupplying the seat be zero. Let the capacity (the number of airline seats) be fixed at C.Restrictions on capacity play a dominant role in our analysis, as will be explained later.5. AnalysisWe start this section with analysis of the simpler case in which tourist consumers do notarrive during the third period. Analysis of this case will provide the necessary intuition foranalysis of the more complicated cases. Later, in section 5.2, we analyze the extended model13
in which there are three periods and forward-looking tourist consumers, who, when makingtheir first-period purchasing decisions, take into account the option of waiting until the thirdperiod and purchasing tickets at a reduced price if such tickets are available.5.1. Two-period gameIn this case, we consider two scenarios that relate to the proportion of business and touristconsumers: if the business segment that arrives during the first period is large enough(γNB NT), then, regardless of capacity, the airline charges a high price and sells only toBbusiness consumers in both periods and completely ignores the tourist segment. Optimal pricesare given by p1 p 2 α Cfor C C1 and p1 p2 α / 2 for C1 C whereN B (θ γ (1 θ ))C1 N B α (θ γ (1 θ ) ) / 2 is the optimal quantity to sell to the business segment. The proofof this case is the same as the proof of Proposition 1, mutatis mutandis. All proofs are given inthe appendix, which is available to download at easyjetpricing.homestead.com.If the tourist segment is large enough (NT γNB), however, the airline should considerBthree cases. In the first case, capacity is so low that the airline sells only to businessconsumers. In the second case, capacity is binding but high enough that the airline caneffectively discriminate so it sells to both markets. In the third case, capacity is high enoughand is not effectively binding. To set the boundaries of these cases, we define S(C) asS (C ) αN T / 2 N B [γ (α α ) (1 γ )θ α ] / 2 C . We later show that S(C) is the capacityshortage or the difference between demand (at unconstrained prices) and capacity.Proposition 1: With low capacity, C C2, the firm sells only to the business segment. Withintermediate capacity, C2 C C3 , the optimal pricing scheme is to increasethe price over time so as to discriminate between the two segments whilerestricting demand for both segments. With excess capacity, C C 3 , the14
airline price discriminates between the two segments while adjusting the firstperiod price to take into account early-arriving business consumers.In the following, we expand on the intuition behind this result.Prices and profits with low capacity: When capacity is low, the airline is better offselling exclusively to business consumers, who have higher valuations and thus will pay more.This case can be divided into two subsections: low capacity and very low capacity. Considerthe extreme case in which the airline has only one seat available. Obviously, the airline wouldrather sell it to a business consumer who has the higher valuation. As we increase capacity,this policy remains valid until capacity exceeds the optimal quantity to sell to the businesssegment C1. To find the value of C2 , note that, when capacity equals C1 , the airline chargesthe optimal monopoly price p α 2 and sells only to the business segment. When capacityincreases further, the airline does not immediately decrease the price in period 1 to capturemore demand from the tourist segment and compensate by increasing price in period 2 to thebusiness segment. The airline employs this policy only when the additional revenue from thetourist segment compensates for the loss in revenue from the business segment. Up to thiscapacity (defined as C2 ), the airline keeps the price constant at p α 2 in both periods andserves only the business segment. We derive the value of C2 in the appendix.Prices and profits with intermediate capacity: Recall that, without capacityconstraints, if an airline could perfectly discriminate between the two segments, it wouldcharge monopoly prices α 2 to the tourist segment and α 2 to the business segment. Onemight have expected that when capacity increases above C2 the airline would continue to sellto business consumers at a price of p α 2 and start to sell to tourist consumers at a reducedprice as fillers to increase utilization of the airplane. However, this approach is problematic; if15
the airline reduces the price to attract tourists, seats are “unfortunately” sold at the reducedprice to business consumers who arrive during the first period. Therefore, the optimal behavioris to decrease the price in period 1 below α α / 2 and increase the price in period 2above α 2 . In this section, we show that the optimal pricing scheme is to increase the priceover time so as to discriminate between the two segments when the capacity is intermediate invalue, C2 C C3 , where C3 is given by S (C3) 0 (i.e., for any capacity for which C C3,there is no shortage).Prices and profits with high capacity: Finally, when the capacity constraint is notbinding, the airline discriminates between the two segments by charging monopoly prices.With these prices, it is straightforward to compute the overall demand D:D αN T / 2 N B [γ (α α ) (1 γ )θ α ] / 2 . It is now clear that S(C) is indeed thedifference between demand and capacity (D – C), or, the capacity shortage.In the high-capacity case, the airline practices price discrimination between the twosegments. In the intermediate case, the airline adjusts the level of prices for both segments.That is, it does not serve the business consumer first and use the tourists as a buffer in case ithas some excess capacity. Rather, it restricts the demand for both segments (by raisingappropriate prices) so as to equate capacity to expected demand. Only in the low-capacity casedoes the airline forgo the tourist segment and serve the business segment exclusively. We alsonote that, when capacity is high, prices in the two periods are independent of capacity and
more closely resemble dynamic pricing than the quantity-based RM of the traditional carriers" (p. 176). Recently, a growing body of revenue-management research has examined pricing decisions, including Talluri and van Ryzin (2004), You (1999), Feng and Gallego (1995), Gallego and van Ryzin (1994, 1997), and Watherford and Pfeifer (1994).