Transcription
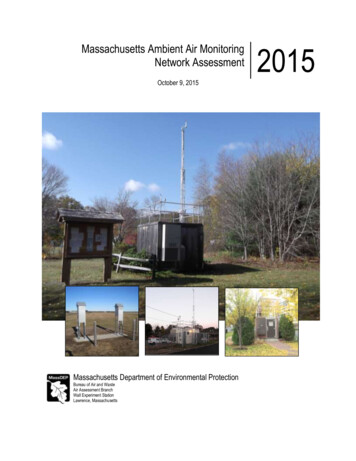
Massachusetts Ambient Air MonitoringNetwork AssessmentOctober 9, 2015Massachusetts Department of Environmental ProtectionBureau of Air and WasteAir Assessment BranchWall Experiment StationLawrence, Massachusetts2015
CONTENTSI. SUMMARY2II. NETWORK PURPOSE AND DESCRIPTION6III. Massachusetts Population16Population Growth19Sensitive Populations24IV. AIR QUALITY SUMMARY36National Ambient Air Quality Standards37Emissions Inventory Summary38V. POLLUTANT NETWORK STATUS42Particulate Matter (PM)43Ozone66Carbon Monoxide (CO)86Sulfur Dioxide (SO2)91Nitrogen Dioxide (NO2)96Lead (Pb)104Meteorology106Technology Issues108MassDEP 2015 Network Assessment1 of 110
I. SUMMARYIntroductionThe Massachusetts Department of Environmental Protection (MassDEP) has prepared this 2015Ambient Air Monitoring Network Assessment pursuant to 40 CFR 58.10(d). The Federal CleanAir Act established a joint Federal-State partnership for protecting the quality of our nation’s air.A key component of this partnership is the national system of ambient air quality monitors. Stateand local air pollution control agencies maintain a network of air monitoring stations thatmeasure ambient concentrations of pollutants for which the U.S. Environmental ProtectionAgency (EPA) has established a National Ambient Air Quality Standard (NAAQS). Thosepollutants, which are known as “criteria pollutants,” include ozone (O3), particulate mattersmaller than 10 microns (PM10), particulate matter smaller than 2.5 microns (PM2.5), nitrogendioxide (NO2), sulfur dioxide (SO2), carbon monoxide (CO), and lead (Pb). The monitoringnetwork is designed to determine if air quality meets the NAAQS as well as to provide dataneeded to identify, understand, and address ambient air quality problems. EPA promulgatesregulations that define minimum monitoring requirements as well as monitoring techniques andprocedures.Monitoring networks are designed to achieve, with limited resources, the best possible scientificdata to inform the protection of public health, the environment and public welfare. The number,location, and types of monitors needed to achieve this goal depends on a myriad of factorsincluding demographics, pollution levels, air quality standards, monitoring technology, budgets,and scientific understanding. These factors all change over time. In accordance with EPAmonitoring regulations, state and local air pollution control agencies must conduct an assessmentof their monitoring networks every 5 years in order to determine: if the network meets the monitoring objectives defined in Appendix D of 40 CFR 58.10,whether new monitoring sites are needed,whether existing sites are no longer needed and can be discontinued, andwhether new technologies are appropriate for incorporation into the ambient airmonitoring network.The network assessment must consider the ability of existing and proposed monitoring sites toprovide relevant data for air quality characterization for areas with relatively high populations ofsusceptible individuals (e.g., children with asthma). The assessment also must show the impactsof proposals to discontinue any sites on data users other than the agency itself, such as nearbystates and tribes or organizations conducting health effects studies. For the criteria pollutantPM2.5, the assessment also must identify needed changes to population-oriented sites.MassDEP’s Air Assessment Branch maintains an ambient air quality monitoring network thatcurrently has 24 monitoring stations located in 19 cities and towns monitors and monitorsambient concentrations of all criteria pollutants. The Wampanoag Tribe of Gay Head(Aquinnah) operates an air monitoring station on Martha’s Vineyard. In addition, MassDEPMassDEP 2015 Network Assessment2 of 110
monitors ambient levels of toxic air pollutants and ozone precursors, which are substances thatreact in the atmosphere to form ground-level ozone, as well as meteorological conditions.MassDEP operates one monitoring site that is part of the National Air Toxics Trends Sites(NATTS) network, four that are part of the Photochemical Assessment Monitoring Stations(PAMS) network, and one that is part of the PM2.5 Speciation Trends Network (STN).MassDEP’s air monitoring network places an emphasis on monitoring ozone and PM2.5 levels.In the past, Massachusetts air quality has been in nonattainment of the ozone standard and hasbeen close to the PM2.5 standard. Today, air quality meets all standards, although theCommonwealth still experiences days with elevated levels of both pollutants. On October 1,2015, EPA lowered the 8-hour ozone NAAQS from 0.075 ppm to 0.070 ppm, so ozonemonitoring will continue to be a top priority. The network is designed to measure theconcentrations of ozone and its precursors in-state, as well as provide insight into ozoneformation and the transport of ozone and its precursors into and out of the state. MassDEP alsoexpects to continue to place priority on monitoring PM2.5 concentrations due to occasionalexceedances of the 24 hour PM2.5 NAAQS in some parts of the state.Figure 2-1 shows the location of monitoring stations. All of these sites have been approved byEPA as meeting applicable siting criteria, as specified in Subpart B of 40 CFR Part 58. Asrequired by EPA, all criteria pollutants are monitored using Federal Reference Methods (FRMs)or Federal Equivalent Methods (FEMs) and monitors are operated according to the proceduresspecified in Quality Assurance Project Plans (QAPPs) that have been approved by EPA.MassDEP’s monitors meet EPA guidelines and requirements for characterizing micro-scale (upto 100 square meters), middle-scale (a few city blocks), neighborhood (up to 4 square kilometer),urban (a city), and regional (up to hundreds of square kilometers) air quality and for measuringthe greatest population exposures and the highest exposures.Update on 2010 Network AssessmentMassDEP prepared its first Network Assessment in 2010. The 2010 Assessment identified newEPA monitoring requirements associated with new NAAQS for SO2, NO2, CO and Lead.MassDEP has complied with these requirements by establishing a near-road NO2 monitoringstation in Boston on Von Hillern Street in 2013 (with sampling for NO2, ozone, PM2.5, CO, blackcarbon), adding lead PM10 sampling at the Boston NCore Site (Harrison Avenue), and bycompleting a year-long lead monitoring study at Nantucket Memorial Airport. MassDEPcurrently is evaluating a location for a second (phase 2) near-road site in the Boston Area. Thethird phase of near-road sites in the Worcester and Springfield areas is being re-evaluated byEPA and may be unnecessary. Beyond the next phases of near-road requirements, MassDEP hasno additional new EPA monitoring requirements.The 2010 Network Assessment also identified Franklin and Barnstable counties as potential gapsin the PM2.5 monitoring network. In 2014, MassDEP established a new PM2.5/ozone monitoringstation in Greenfield (Franklin County). This has resulted in better spatial resolution of the PM2.5and ozone networks in Western Massachusetts and also enabled MassDEP to close the Amherstozone monitor (which had become redundant). MassDEP also established a new PM2.5/ozonemonitoring station in Brockton in 2013, which added to the continuous PM2.5 and ozoneMassDEP 2015 Network Assessment3 of 110
monitoring networks and also helped offset the closure of the Boston-Long Island ozone site in2014 (due to the bridge closure).MassDEP established an ozone monitoring station in Fall River in 2012 after the loss of theoriginal Fairhaven site in 2012, and then established a new Fairhaven ozone monitoring stationin 2013, bolstering the ozone measurement capabilities on the South Coast. MassDEP iscurrently working on replacing three sites in Berkshire County (including the recently closedAdams ozone site) with a single site in the Pittsfield Area. MassDEP also began ozonemonitoring at the EPA laboratory in Chelmsford, which helped offset the closure of the Stowozone site/upper air profiler in 2011.2015 Network Assessment ResultsMassDEP’s review of the Massachusetts monitoring network indicates that the network meets orexceeds EPA’s minimum monitoring requirements, that the network is well designed andoperated, and adequately characterizes air quality in Massachusetts. Air quality in Massachusettscurrently attains the 2008 8-hour ozone NAAQS (although Dukes County is still designated asmarginal nonattainment), and MassDEP continues to make ozone monitoring a priority toconfirm the downward trend in ozone concentrations and to determine attainment status with thenew 2015 ozone standard.MassDEP operates a robust PM2.5 monitoring network due to the significant health effects posedby PM2.5, the growing use of wood heating, and occasional exceedances of the PM2.5 standard insome parts of the state. In 2013 and 2014, MassDEP established PM2.5 monitoring sites at keylocations (e.g., near-road and rural area affected by wood smoke) where PM2.5 levels areexpected to be higher than at other monitoring locations.MassDEP has reviewed changes in population and pollutant emissions, which also confirms thatMassDEP’s existing monitoring network is properly designed. County-by-county review of thedata show that emissions have decreased fairly uniformly across the state. The growth inpopulation also has been fairly uniform across the state. Massachusetts population centersremain the same, although they are larger; the road network is relatively unchanged, although itis carrying more vehicles; and stationary sources of pollution are distributed in roughly the samepattern, although they emit less and there are fewer of them. The absence of major shifts in thesefactors indicates that adjustment of the basic design of the air monitoring network isunwarranted.In addition, review of the distribution of sensitive populations (such as children) and of theincidence of various diseases associated with air pollution (such as asthma, respiratory disease,lung cancer, and circulatory diseases), as well as environmental justice populations, indicatesthat the existing distribution of monitoring sites adequately supports air quality characterizationin areas with high numbers of sensitive populations.MassDEP has used the analytical tools developed by EPA and the Lake Michigan Air DirectorsConsortium (LADCO) for identifying potential new sites for all PM and ozone monitors in thestate. These tools address correlations between existing site measurements, distance betweenMassDEP 2015 Network Assessment4 of 110
sites, and the likelihood of the site exceeding a standard; evaluate the correlation between sitemeasurements and removal bias (i.e., the difference between the measured concentrations at asite and those that would be estimated for that site based on data from surrounding sites); andcreate maps for voronoi polygons that show the coverage area of each monitor. (A voronoipolygon is the shape formed when a line is drawn equidistant between each monitor and each ofthe monitors closest to it.) These tools show that Barnstable County on Cape Cod andMiddlesex and Northern Worcester Counties along Route 2 are potential gaps in the existingPM2.5 monitoring network. Asthma rates are higher than the statewide average in these areas,although they are less populated than other areas in the state. There are also EJ populations inthe Route 2 area and a high number of elderly in Barnstable County. Since MassDEP meetsminimum EPA requirements for PM2.5 monitoring and PM2.5 levels are not expected to besignificantly higher in these areas compared to monitored areas, MassDEP is not proposingchanges to the monitoring network at this time. MassDEP will continue to evaluate the need formonitoring stations in these locations.Looking ForwardMassDEP will continue to optimize the monitoring network and the locations of its sites.MassDEP has streamlined operations by optimizing travel routes, maintenance schedules, andrelying on automated continuous monitors for a number of parameters. Two measuresimplemented from the 2010 network assessment include relying on continuous FederalEquivalent Method (FEM) PM2.5 monitors and reducing the workload associated withmonitoring PAMS parameters. MassDEP now uses continuous FEM PM2.5monitors forcompliance with the NAAQS while continuing work to ensure that these monitors and the filterbased FRM monitors agree more closely.MassDEP consolidated PAMS monitoring by discontinuing canister sampling sites in 2012, twoyears ahead of EPA’s recommendation to discontinue this sampling. MassDEP is operating twoType 2 PAMS sites (Lynn and Chicopee) in 2015 to facilitate quicker turnaround of PAMSozone season data and enable greater focus on the technical aspects of ozone precursormeasurements. The Type 3 PAMS sites (Ware and Newburyport) will be operated less and datafrom these sites will be processed and submitted as resources allow. Future PAMS monitoringplans will be developed in accordance with monitoring requirements for the new 2015 ozoneNAAQS.To increase automation, MassDEP upgraded its Data Acquisition System (DAS) in 2012. Thishas involved significant ongoing work to incorporate the new DAS into the existing data systemand to train and familiarize staff with the new system. MassDEP is beginning to take greateradvantage of the automation features, enhanced quality control and assurance, and improvedcommunications the new system provides. The DAS upgrade will not only save time for fieldand laboratory staff, but also will improve the timeliness and quality of data.MassDEP 2015 Network Assessment5 of 110
II. NETWORK PURPOSE AND DESCRIPTIONThe Massachusetts ambient air quality monitoring network serves several purposes: Provide information about air quality to the public. MassDEP’s website providesnear real-time data from continuous monitoring sites, explanations of the health effects ofpollution, information about the National Ambient Air Quality Standards (NAAQS), andthe
Introduction. The Massachusetts Department of Environmental Protection (MassDEP) has prepared this 2015 Ambient Air Monitoring Network Assessment pursuant to 40 CFR 58.10(d). The Federal Clean Air Act established a joint Federal-State partnership for protecting the quality of our nation’s air.