Transcription
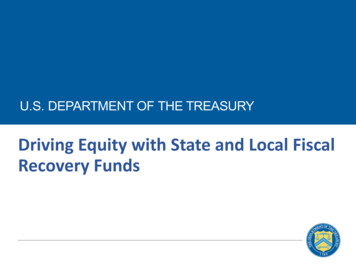
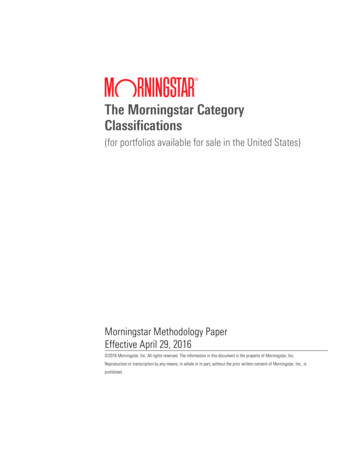
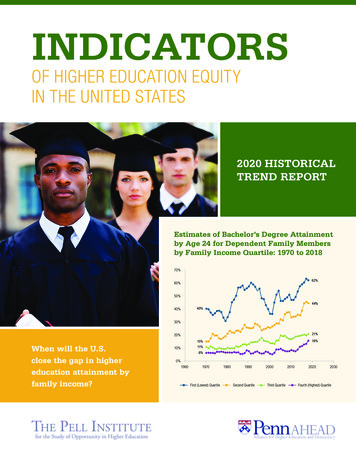
INDICATORSOF HIGHER EDUCATION EQUITYIN THE UNITED STATES2020 HISTORICALTREND REPORTEstimates of Bachelor’s Degree Attainmentby Age 24 for Dependent Family Membersby Family Income Quartile: 1970 to 201870%62%60%50%44%40%40%30%21%20%16%15%When will the U.S.close the gap in highereducation attainment byfamily income?11%10%6%0%19601970First (Lowest) Quartile19801990Second Quartile2000Third Quartile201020202030Fourth (Highest) Quartile
The Pell Institute for theStudy of Opportunity inHigher Educationconducts and disseminates research and policy analysis toencourage policymakers, educators, and the public to improveeducational opportunities and outcomes of low-income,first-generation students, and students with disabilities. ThePell Institute is sponsored by the Council for Opportunity inEducation (COE). The Pell Institute shares the mission of theCouncil to advance and defend the ideal of equal opportunity inpostsecondary education. As such, the focus of the Council isto ensure that the least advantaged segments of the Americanpopulation have a realistic chance to enter and graduate from apostsecondary institution.www.pellinstitute.orgAlliance for Higher Educationand Democracy, University ofPennsylvania (PennAHEAD)is dedicated to advancing higher education policy and practicesthat foster open, equitable, and democratic societies. Drawing onthe intellectual resources of the University of Pennsylvania and aglobal alliance of higher education and academic leaders, PennAHEAD achieves its mission by creating knowledge, improvingpractice, and building capacity. Through engagement withpolicymakers, institutional leaders, scholars, and practitioners,AHEAD produces research and applies research-basedknowledge to address the most pressing issues pertaining tothe public purposes of higher education in the U.S. and acrossthe globe.www.ahead-penn.org
CONTENTS6 INTRODUCTION11 SETTING THE STAGEWhat Are the Contexts for Examining Equity in Postsecondary Education inthe United States?39 EQUITY INDICATOR 1Who Enrolls in Postsecondary Education?78 EQUITY INDICATOR 2What Type of Postsecondary Educational Institution Do Students Attend?98 EQUITY INDICATOR 3Does Financial Aid Eliminate the Financial Barriers to Paying College Costs?117 EQUITY INDICATOR 4How Do Students in the United States Pay for College?142 EQUITY INDICATOR 5How Do Educational Attainment Rates and Early Outcomes Vary byFamily Characteristics?175 EQUITY INDICATOR 6How Does Educational Attainment in the U.S. Compare with Other Countries?181 WHAT DOES IT MEAN? The Search for Solutions-Shared Dialogues EssaysWill the Dual Crises of Climate Change and the COVID-19 Pandemic be Portals toWidening Opportunity or Will the Doors Close Even Tighter? Strategies for a Transition toa More Equitable, Resilient, and Ecologically Sustainable US Higher Education Systemby Margaret CahalanPell Institute for the Study of Opportunity in Higher EducationWhere Do We Go from Here? Reflections on the Impact of COVID-19 and HigherEducation from Two Recent TRIO Graduatesby Marisha Addison and Chelsea MurrayPell Institute for the Study of Opportunity in Higher Education198 REFERENCES AND RESOURCES206 APPENDIX AAdditional Methodological Notes and Figures
DEDICATION &SPONSORSSPECIAL DEDICATIONARNOLD MITCHEM & TOM MORTENSONThe 2020 Indicators of Higher Education Equity in the UnitedStates report is once again dedicated to Arnold Mitchem and TomMortenson. Without the work of these two individuals, the reportwould not have been possible. Both have dedicated their careersto creating greater equity in educational opportunity. By producingthis 2020 volume and continuing the Search for Solutions SharedDialogues, we honor the legacy of their work and the seeds theyhave sown for increasing equity in higher education opportunityand outcomes in the United States.SPECIAL THANKS FOR SUPPORT FROM:The Pell Institute and PennAHEAD thank Lumina Foundation and the Bill and MelindaGates Foundation (BMGF) for their financial support of the Indicators of Higher EducationEquity in the United States: 2020 Historical Trend Report and the accompanying Searchfor Solutions Shared Dialogues. While we heartily acknowledge their support, any errorsof omission or interpretation and the opinions expressed in the report are the soleresponsibility of the authors.
ACKNOWLEDGEMENTSThis report represents an ongoing collaboration between the Pell Institute for the Studyof Opportunity in Higher Education of the Council for Opportunity in Education (COE)and the Alliance for Higher Education and Democracy at the University of Pennsylvania(PennAHEAD). We are most grateful for the contributions of many persons andorganizations. We acknowledge first the teams of the U.S. government and contractorstatisticians, data collectors, and data processors who have painstakingly used theirtechnical expertise over many years to produce the historical and current estimatesincluded in the Indicators reports. We thank the past and present staff from the CurrentPopulation Survey (CPS) and American Community Survey (ACS) from the U.S. CensusBureau and past and present government and contractor staff from the National Centerfor Education Statistics (NCES) studies including: High School Longitudinal Studiesprogram, National Postsecondary Student Aid Study (NPSAS), Beginning PostsecondaryStudents Longitudinal Study (BPS), Baccalaureate and Beyond Longitudinal Study(B&B), and Integrated Postsecondary Education Data System (IPEDS). We especiallythank Tara Spain of Travelers, Susan Johnson, Wendy Sedlak, and Katherine Wheatle ofLumina Foundation, and Jamey Rorison and Jennifer Engle of the Bill and Melinda GatesFoundation for their advisory guidance over the years since this series was begun andthe financial support of the organizations they represent. We also heartily acknowledgethe feedback, technical assistance, and suggestions for future reports provided by theImproving Equity in Higher Education Advisory Panel listed on the back of this report.A number of persons at COE and Penn contributed to various aspects of this 2020report. We especially thank Maureen Hoyler, President of COE, Kim Jones, HollyHexter, and Terrance Hamm of COE for their assistance, feedback, and productionsupport. This report series owes much to Colleen O’Brien, former Director of the PellInstitute and author of the 2004 and 2005 Indicators reports. Much of the trend datapresented in this and earlier reports was originally compiled by Tom Mortenson, SeniorScholar at the Pell Institute, with the assistance of Nicole Brunt, for inclusion in thePostsecondary Education Opportunity Newsletter.Suggested Citation: Cahalan, Margaret W., Perna, Laura W., Addison, Marisha,Murray, Chelsea, Patel, Pooja R., & Jiang, Nathan. (2020). Indicators of Higher EducationEquity in the United States: 2020 Historical Trend Report. Washington, DC: The PellInstitute for the Study of Opportunity in Higher Education, Council for Opportunity inEducation (COE), and Alliance for Higher Education and Democracy of the University ofPennsylvania (PennAHEAD).
FOREWORDIn 2004 and 2005, the Pell Institute for the Study of Opportunity in Higher Education(Pell Institute), sponsored by the Council for Opportunity in Education (COE), publishedtwo editions of Indicators of Opportunity in Higher Education. In 2015, we renewed thecommitment to documenting trends in higher education equity by publishing an expandedannual trend report and initiating the Search for Solutions Shared Dialogues. The Indicatorsof Higher Education Equity in the United States: 2020 Historical Trend Report, the sixth inthis series, directly follows on these earlier efforts. This publication brings together againin partnership the Pell Institute with the Alliance for Higher Education and Democracy ofthe University of Pennsylvania (PennAHEAD). Both organizations have a core mission topromote a more open, equitable, and democratic system of higher education. The PellInstitute, with its historical and ongoing ties to the federal TRIO programs, has a specialmission to promote more equitable opportunity for low-income and first-generationstudents, and students with disabilities. These reports draw from multiple sourcesof existing data to provide, in one place, indicators that describe trends in equity inpostsecondary enrollment, choice, and degree attainment, as well as indicators of collegeaffordability.Purposes of the Indicators Project. The purposes of this equity indicators project are to: Report the status of higher education equity in the United States and identifychanges over time in measures of equity; Identify policies and practices that promote and hinder progress, and Illustrate the need for increased support of policies, programs, and practicesthat not only improve overall attainment in higher education but also creategreater equity in higher education opportunity and outcomes.Focus on Inequities by Family Income. The first Indicators report in 2015 focused onequity in higher education based on measures of family income. Family income remainsthe primary focus of the subsequent reports. Recognizing the need to also addressinequity based on other interrelated demographic characteristics, reports since 2016include selected indicators that highlight differences by race/ethnicity and socioeconomicstatus (SES). In these reports, SES is primarily measured by an index comprised of familyincome, parents’ education, and parents’ occupation developed by the National Center forEducation Statistics (NCES).Inclusion of State Data. The 2018 Indicators report added data describing highereducation equity by U.S. state. The 2019 and 2020 Indicators reports continue theinclusion of state data. Considering indicators of equity by state is essential given themany differences across the 50 states in historical, demographic, economic, and politicalcharacteristics, as well as the characteristics of their K-12 and higher education systems.
Inclusion of Dependency Status. Indicators reports 2015 to 2019 presented a numberof indicators for all students and for dependent students. In the 2020 Indicators report,we add disaggregation by dependency status (dependent and independent withoutdependents, and independent with dependents) where data are available.Methodological Issues. This Indicators report presents data as far back as comparabledata warrant, often beginning with 1970. The Methodological Appendix A providesadditional notes, tables, and figures that help in understanding the trend data in thebody of the report. Throughout the report, we include methodological notes concerningqualifications and limitations of the data over time.The Search for Solutions Shared Dialogues, Essays and Blog. In addition to providinglongitudinal indicators of equity, the Indicators project is also intended to advanceproductive conversation about effective policies and practices for improving equity inhigher education opportunity and outcomes. To this end, the 2015 to 2017 Indicatorsreports include essays intended to connect the indicators to current policy debates. In2018, the Indicators project launched the Improving Equity in Higher Education Search forSolutions Blog hosted by PennAHEAD (https://www.ahead-penn.org/) intended to furtheradvance discussion of how to create meaningful improvements in higher education equity.2020 Essays. In-light of the public health COVID-19 pandemic which has upended muchof everyone’s lives in a concluding “What Does it Mean?” section to the 2020 report, weinclude two new essays entitled: Will the Dual Crises of Climate Change and the COVID-19 Pandemic be Portalsto Widening Opportunity or Will the Doors Close Even Tighter? Strategies fora More Equitable, Resilient, and Ecologically Sustainable US Higher EducationSystem, and Where Do We Go from Here? Reflections on the Impact of COVID-19 andHigher Education from Two Recent TRIO GraduatesOnline Tools. To download the EXCEL files used to produce the figures in this report, findlinks to the 2016 to 2020 reports, and access to the Search for Solutions Shared DialoguesEssays that periodically accompany the Indicators reports, please visit the Equity IndicatorsWebsite hosted by the Pell Institute: http://pellinstitute.org/indicators/.New for 2020 Infographics and Interactive Data Tool. Throughout 2020, we will beadding to the Indicators website additional data visualizations and infographic storiesfor selected Indicators. Please visit the Equity Indicators Website http://pellinstitute.org/indicators/ to access these materials.
IntroductionAs this report is going to press, we are in the public health emergency of the COVID-19 pandemic. By mid-May2020 worldwide there were over 4 million confirmed COVID-19 cases, and well over 400,000 deaths. Within theU.S. the number of cases had reached over 1.3 million, with over 80,000 deaths. By the May 20, 2020 date onwhich this report is scheduled to be released, we know these statistics will be even more stark. Although none ofus can predict what the outcomes of the pandemic will be, we do know that the statistics reported in the futureIndicators reports will be greatly impacted. Award winning author, Arundhati Roy has recently released a video ofa selection from her forthcoming book.1 She states:“Historically, pandemics have forced humans to break with the past and imagine their world anew. This oneis no different. It is a portal, a gateway between one world and the next.”This 2020 report and the associated shared solutions dialogues for 2020 are dedicated to the hope thatCOVID-19 will indeed be a portal that will lead us together to “recover, reimagine and rebuild” a more equitable,resilient, and ecologically sustainable higher education system.Renewed Commitment in the Light of Dual Emergencies of COVID-19 and Climate Change. As we begin thesixth report in this series in the light of the new reality of COVID-19, as well as the related increasingly apparentemergency of human induced environmental destruction and climate change, we renew our original purposein starting the equity Indicators series of historical reports. Our hope remains that, by pulling together availablehistorical statistics, we can understand how to foster the evolution of a more sustainable and resilient highereducational system that provides equity of opportunity while respecting the diversity of talents and gifts among us.Commitment of Non-Zero-Sum Game Higher Education Opportunity in Which Each Person DevelopsTalents and Contributes to Unique Time in History. The youth in our society and the non-traditional olderlearners (who currently make up 50 percent of the students in higher education) are faced with very heavychallenges in 2020. We renew our firm belief that each person should have the opportunity to learn about, thrivein, and contribute to their unique time in history. In these times, we are committed to fostering a higher educationsystem that does not function as a zero-sum game in which the provision of opportunity for one individual orgroup means that another individual or group has less opportunity.The historical statistical trends and recent data suggest that creating a more equitable higher educationsystem has been and is a major challenge, even without the pandemic and climate change. However, takingan “empathetic inquiry systems perspective,” in facing new challenges, we keep our hope that we can evolve16Arundhati Roy (forthcoming September 2020) Azadi: Freedom. Fascism. Fiction. Haymarket, Video excerpt link retrieved April 2020https://youtu.be/7hgQFaeaeo0.2020 Equity Indicators Report
toward a stronger place by thinking, learning, and communicating together about our education system.2 Wehope that an empathetic inquiry will lead to an awareness that everyone benefits from the development of a moreegalitarian, ecologically sustainable, inclusive, and diverse higher educational system.Civil Rights Perspective. As adopted under President Jimmy Carter in the late 1970s, the original stated missionof the U.S. Department of Education reflected a clear civil right focus to “ensure equal access to education.”3This historical trend report series and the associated dialogue pieces on our website continue to draw inspirationfrom this original mission statement and from other historical statements concerning equal access to education.In this introduction, we briefly review again some of these articulations to highlight the current challenges andopportunities pertaining to equity in higher education in the United States.The Dangers of a Higher Educational System that Functions to Sort Students. In the original report of thisseries we included a quote from the forward to President Truman’s 1947 Commission on Higher Education that calledattention to the dangers of a higher education system that functioned not to provide opportunity but to sort students:If the ladder of educational opportunity rises high at the doors of some youth and scarcely rises at thedoors of others, while at the same time formal education is made a prerequisite to occupational and socialadvance, then education may become the means, not of eliminating race and class distinctions, but ofdeepening and solidifying them.4As in previous Indicators reports, the data in the 2020 Indicators show persisting inequality in higher educationopportunity based on family income, race/ethnicity, parent education, geographic location and dependencystatus. While there has been an increase in postsecondary attainment since these words were articulated in thelate 1940s, new forms of inequity and stratification are evolving, as education becomes one of the chief ways ofdifferentiating wages and salaries and quality of life indicators.5Higher Education as an International Human Right. Article 13 of the International Covenant on Economic,Social, and Cultural Rights of the United Nations declares:Higher education shall be made equally accessible to all, on the basis of capacity, by every appropriatemeans, and in particular by the progressive introduction of free education.62Richmond, B. Introduction to Systems Thinking, STELLA 1992-1997, 2000, 2001, 2004, 2005 isee systems, Inc. “Being able to empathizeis a skill that can be developed—and is in some ways, the ultimate Systems Thinking skill because it leads to extending the boundaryof true caring beyond self (a skill almost everyone could use more of).” (p.30). “The key to evolving our education system lies in tappingthe potential synergies that exist in the mutually reinforcing processes of thinking, communicating and learning.” (p.33) Retrieved from:https://www.fi.muni.cz/ xpelanek/IV109/jaro07/IST.pdf.3The U.S. Department of Education’s mission statement was revised in 2005 under President Bush to “promote student achievement andpreparation for global competitiveness by fostering educational excellence and ensuring equal access.” It can be found at .html.4Truman, H.S. “Statement by the President making public a report of the Commission on Higher Education,” December 15, 1947. Retrievedfrom n-higher-education.5Data from BLS document this trend and the increase in the gap in earnings by education level. 6Tomaševski, K. (2001). Special Rapporteur Report on the Right to Education Mission to the United States of America, United NationsCommission on Human Rights, Economic, Social, and Cultural Rights. Retrieved from s/cescr.aspx. President Carter signed the U.N. Covenant in 1977, but thus far no President, Democrat or Republican, has presentedthe Covenant for ratification by the U.S. Senate. The U.N. Covenant has been ratified by 166 countries worldwide but the United States isone of a handful of counties worldwide that has not become a binding party to the Covenant.Introduction7
In the wake of growing student debt and a renewed focus on the rise of economic inequity in the United States,in recent years a number of proposals have been advanced for “tuition free” and “debt free” higher education.7Scholars and politicians have begun again to speak of high-quality higher education as a human right.8The U.S. has a core constitutional and founding commitment to equality of opportunity for all citizens. The U.S.Supreme Court has made rulings barring discrimination based on race/ethnicity within the United States andhas ruled in favor of increasing diversity for the good of the institution in college admissions decisions in Fisherv. Texas. Thus far, the courts have not ruled on inequities in access to higher education based on family income,parents’ education, or socioeconomic status. If postsecondary education is necessary to obtain work that pays aliving wage, then all individuals, regardless of family income, parents’ education, socioeconomic status, or otherdemographic characteristics, should have equal opportunity to participate, complete, and benefit.9The United States has higher levels of income and wealth inequality and lower levels of measuredintergenerational mobility than many other developed nations.10 Inequality is negatively related to various healthand well-being indicators – indicators that are also falling in the U.S. relative to many other developed countries.11A Question of Will. In 1967, in Where Do We Go from Here? Reverend Martin Luther King, Jr. argued that: “Thereis no deficit in human resources, the deficit is in human will.” 12 Fifty years later, these words could be applied tomany current social problems, including persisting inequality in higher education opportunity and outcomes. This2020 report and the dialogue questions we pose seek to place the Indicators in the wider discussion of equityand in the context of the role that higher education is playing in a society under conflict and stress.Whether or not we believe that higher education is a civil right, an essential element of a full democratic society,or a fundamental requirement for achieving the American dream, the 2020 Indicators report, like previous reports,shows that higher education opportunity and outcomes remain highly inequitable across family income groups.On many indicators, gaps are larger now than in the past. The disinvestment of state funds for public colleges87An example is the Debt Free College Act of 2019, which was introduced in the U.S. Senate by Senator Brian Schatz of Hawaii te-bill/672/text). The bill proposes to establish a federal-state grant program that wouldrequire state public institutions to provide students with the full estimated “cost of attendance,” including books, transportation, roomand board and living expenses; extend Pell Grant eligibility to DREAMer students; repeal suspension of federal aid eligibility for drugrelated offenses; require state public institutions to tie cost increases to the consumer price index, and provide additional support forminority-serving institutions.8With a stated goal of improving college affordability, several states (including Tennessee, Oregon, and New York) have adopted sometype of “free tuition” programs. “Free community college” programs are also being created in local communities across the U.S. For adatabase of current programs see: ge-promise.9The Truman Commission report foreshadows more recent arguments that question the validity, justice, and utility for a democracy ofour education system’s focus on measuring merit and ranking at every level. In the wake of increasingly apparent difficulties in fairlyimplementing the so called “merit” system of admissions, these policies are receiving more critical interest. Lani Guinier (2016) arguesin the Tyranny of the Meritocracy, Democratizing Higher Education in America, that: “The merit systems that dictate and justify the collegeadmissions are functioning to select and privilege elite individuals” and exclude others rather than “creating learning communities gearedto advance democratic societies.”10Major, L.E., & Manchin, S. (2018). Social Mobility: And Its Enemies. Pelican Books. With a focus on England, Lee Elliot Major andStephan Manchin advocate a lottery system for students meeting transparent entrance requirements. Their views are summarized in ashort blog: Why we should select students by lottery; ents-by-lottery/.11It is not only the absolute level of income that reduces well-being, but also the degree of income inequity that is manifest in the state ornation. See Kerry, B., Pickett, K.E. & Wilkinson, R. (2010, August). The Spirit Level: Why Greater Equality Makes Societies Stronger. ChildPoverty Insights, Social and Economic Policy, UNICEF Policy and /Insights August2010 ENG(1).pdf.12Especially in the final years of his life Dr. King increasingly spoke of the interrelationships between civil rights and education, theeconomic system, poverty, militarism, and racism. 1/King-quotes-2-page.pdf.2020 Equity Indicators Report
and universities since the 1980s and the declining value of federal student grant aid have aided in the creation ofa higher education system that is stained with inequality.Once known for wide accessibility to and excellence within its higher education system, the U.S. now has aneducational system that sorts students in ways that have profound implications for later life chances. More workis required to ensure that all youth have opportunity to use their creative potential to realize the many benefits ofhigher education and advance the well-being and progress of the nation.13The equity indicators tracked in this report address the following fundamental questions:1. Equity Indicator 1: Who enrolls in postsecondary education? How do college participation rates of high school leavers vary by family income? How do college participation rates of high school graduates vary by family income? How do rates of postsecondary enrollment differ by race/ethnicity? How do rates of postsecondary enrollment differ by race/ethnicity and family income? How do the percentages of young adults that have not enrolled in postsecondary education within 8 to 10years of expected high school graduation vary by parents’ socioeconomic status (SES)? How do the rates of enrollment vary by parent education or first-generation status? What are the differences by state in estimated participation of low-income students in college? How do rates of postsecondary enrollment differ by state? What is the dependency status of those enrolled in postsecondary education and how do dependent andindependent students differ in demographic characteristics and completion risk factors?2. Equity Indicator 2: What type of postsecondary educational institution do students attend? How does the level of institution attended vary by Pell or other Federal Grant receipt? How does the control of institution attended vary by Pell or other Federal Grant Receipt? How does Pell or other Federal Grant receipt and dependency status vary by institutional level and control? How does the selectivity of institution attended vary by family income? How does the representation of low-income students vary by institutional selectivity? How does selectivity of institution attended vary by dependency status?3. Equity Indicator 3: Does financial aid eliminate the financial barriers to paying college costs? What are the trends in cost of attendance nationally and by state? What is the maximum Pell Grant relative to average college costs? What level of Pell Grant would be necessary to meet college costs? How much would this cost each year? What is the total number of dependent and independent Pell Grant Recipients? What is the unmet need by family income for dependent and independent students?4. Equity Indicator 4: How do students in the United States pay for college? What share of higher education costs is paid by students and their families? What is the net price of attendance by family income?13Jeanna Smialek (2019) examines the business arguments for a more equitable system in “Inequality is Holding Economies Back.Education Could be One Solution in Countries Where Lack of Opportunity Mixed with High Inequality See Slower Growth.” uality.Introduction9
What is the percentage of family income needed to pay for college for dependent and independentstudents? What percent of students borrow and how much do they borrow nationally and by state? What is the level of state need-based aid?5. Equity Indicator 5: How do educational attainment rates and early outcomes vary by student characteristics? How does dependent individuals’ bachelor’s degree attainment by age 24 vary by family income? How does students’ bachelor’s degree completion within 6 years of entering college vary by familyincome and dependency status? How does the distribution of associate’s, bachelor’s, master’s and doctoral degrees relative to thepopulation differ by race/ethnicity? Are there differences in post-baccalaureate enrollment and average income for recent graduates by familyincome and dependency status? How do degree attainment rates vary by state?6. Equity Indicator 6: How does educational attainment in the U.S. compare with other countries? What percentage of 25- to 34-year-olds has completed a type A (bachelor’s or above) tertiary degree? What percentage of 25- to 34-year-olds has completed a type A (bachelor’s or above) or a type B (shortcycle or associate’s) tertiary degree?102020 Equity Indicators Report
Setting the Sta
In 2004 and 2005, the Pell Institute for the Study of Opportunity in Higher Education (Pell Institute), sponsored by the Council for Opportunity in Education (COE), published two editions of Indicators of Opportunity in Higher Education. In 2015, we renewed the commitment to documenting trends in higher education equity by publishing an expanded