Transcription
white paperCommunications Service ProvidersService AssuranceAccenture* Integrates a PlatformTelemetry Solution for OpenStack*Using open source software and Intel Xeon processor-based servers, AccentureCloud Innovation Center has created a service assurance solution that meets theneeds of a tier one communication service provider.IntroductionCommunications service providers (CommSPs) are transitioning to virtual servicesbased on network functions virtualization (NFV) and software defined networking(SDN). Virtualized services based on virtual network function (VNF) software canbe deployed locally or in the cloud, and redeployed when it makes sense. Thetransition has progressed through the proof of concept and trial phases whereCommSPs developed the network architecture and the initial orchestrationmechanisms and processes. These functions need to be managed and monitored,as do the underlying hardware and virtualization resources hosting the new virtualservices. The ability to manage and operate virtual networks in the same manner asphysical network technologies is an essential requirement to realize full operationalefficiency benefits.These management and operational needs are becoming more critical as theseservices are entering the production phase. Intel Network Builders ecosystempartner Accenture* developed a service assurance system based on open sourcesoftware that delivered dynamic and comprehensive Intel platform telemetry datafor virtual network infrastructure.Adapting Service Assurance to Virtualized NetworksTable of ContentsIntroduction . . . . . . . . . . . . . . . . . . . . . 1Adapting Service Assuranceto Virtualized Networks. . . . . . . . . . . 1Accenture’s IntegratedService Assurance Solution . . . . . . . 2Accenture Solution Poweredby Intel Xeon Processors . . . . . . . . 4Conclusion. . . . . . . . . . . . . . . . . . . . . . . 4About Accenture . . . . . . . . . . . . . . . . . 5About Intel Network Builders. . . . . 5Telecommunications service assurance systems provide insights into serviceutilization and malfunctions that can cause disruptions to service levels. Typically,the scope of these service assurance systems covers fault, capacity, accounting,performance, and security (FCAPS) attributes of the network. Network engineers canuse the data from service assurance systems to promptly resume operation in theevent of a failure. While bringing many benefits, transformation to the virtualizednetwork paradigm increases general platform complexity by introducing additionalvirtualization-related layers. The health and available capacity status of varioushardware and software platform components is likely to have a direct effect on thequality of service delivered by the entire NFV solution. Delivering a comprehensiveset of platform statistics is essential to operating a telecommunications servicewith the performance and network uptime that customers expect.Communications services providers utilize long-established service assurancemethodologies with multiple systems to collect data at intervals and provide itto a reporting framework. These systems typically come from multiple vendorsand are configured in a defined service chain and based in a central office. Theseframeworks have worked well for legacy services, but they need to evolve to matchthe decentralized and dynamic nature of NFV/SDN-based virtualized services.
White Paper Accenture* Integrates a Service Assurance Solution for OpenStack*NFV orchestrators and SDN controllers used in virtualizednetworks can relocate virtual network functions (VNFs), reroute data traffic, or reconfigure services on demand. Serviceassurance systems must also be configurable and adaptableto continue to measure the health of these virtualized services.Systems have to be aware of the operating status of theunderlying hardware infrastructure hosting the virtual servicesin order to give an accurate assessment of what is going on inthe network.To offer complete service assurance, service assurance toolsmust provide the following: Automated service optimization and remediation Closed loop feedback to assure service integrity Dynamic service level agreement (SLA) management tomonitor SLAs in real time even as the service evolves andchangesAll of these features must tie into analytics capabilities thatinclude performance roll-ups and trend analysis as well assnapshots of the service at any point in time.For its NFV deployments based on OpenStack* virtualizationtechnology, Accenture integrated a Collectd*/Graphite*/Grafana* stack to provide infrastructure service assurancewith a single integrated solution.Accenture’s Integrated Service AssuranceSolutionAs a first step Accenture outlined its service assurancesolution features, in accordance with most commoncustomers’ needs collected during the NFV journey, asfollows: Adjustable and granular sampling intervals: The servicesbeing monitored need frequent data samples (a sampleless than every 20 seconds) to ensure that service issuesare exposed as early as possible. Comprehensive set of metrics: The system needs tocapture a set of metrics large enough to provide insightinto the performance of both physical and virtual servers. Customizable visualization: Assurance dashboards needto be flexible and enable the building of new dashboardgraphs and metrics to reflect new monitoring needs forservices. No vendor lock in: This was accomplished by the use ofopen source software for key parts of the solution.Accenture developed its solution based on Collectd,Graphite, and Grafana, three open source tools that providea framework for collecting, reporting, and visualizing timeseries data such as service assurance data. Each of the toolsprovided a specific capability: Data collecting: The solution used an API-basedcustomization for Collectd that ran on the hypervisorto gather metrics from the operating system of thevirtualization platform, and enabled collection ofVNF metrics without any kind of agent that runs onthe guest VM. Data collection was extended alsoto external infrastructure and applications throughCollectd distribution and configuration, which enableda centralized visualization console for the entire stack.Collectd is a Unix* daemon able to store these metricslocally or make them available to a time series database,which is how Accenture configured the system. Datagathered by Collectd is used to monitor systems andprovide performance analysis and capacity monitoring.Collectd can scale to handle hundreds of thousands ofmetrics and offers more than 100 plugins that give itflexibility in data gathering and display. Accenture madeuse of plugins from Barometer,* an open source projectthat provides a set of tested and validated plugins.Barometer, formerly known as Software Fastpath ServiceQuality Metrics, aims to let carriers enforce SLAs or detectviolations, faults, or performance degradation of networkfunctions virtualization infrastructure (NFVI) resources sothat events and relevant metrics are reported to higherlevel fault management systems. Barometer is designedto add the ability to monitor traffic and performanceof physical and virtual networking interfaces as well asto monitor key hardware platform performance levels,including CPU, memory, load, cache, thermals, fan speeds,voltage, machine check exceptions, etc. Data storage: Graphite is an enterprise-ready time-seriesdatabase designed to make it easy to store, retrieve,share, and visualize time-series data. Data visualization: Grafana is an open source platformfor analytics and monitoring of time series data. Grafanaallows users to visualize and understand trends withinvast amounts of metrics data. Visualizing data helpsteams monitor their environment, detect patterns, and actwhen identifying anomalous behaviors.In case of diagnostics and after-the-fact root cause analysis,visualizing performance data helps operators understandwhat happened at a given point in time on the entireinfrastructure and find possible correlations.Grafana has tools that allow the user to query data from anumber of databases, then to create dashboards that can beshared to examine the trends in that data.To build the fully integrated OpenStack service assuranceprogram using these applications, Accenture had to firstcustomize some Collectd plugin configurations provided byBarometer and build custom scripts to retrieve additionalinformation from hypervisor CLI and ensure that data wasstored in the correct format. That was necessary to improvedata analysis capabilities through metric names display andobject relationships. The Graphite database also neededto be configured to customize user credentials and specificretention/aggregation customer policies. Accenture alsoneeded to develop drivers (variables, regular expressions,naming convention) that could be used with Grafana toenable the building of easy-to-use and fully parametricdashboards that enabled scaling without any reconfigurationas the number of monitored servers or VNFs expanded.Usually siloed (one for each technology vendor orcomponent) solutions require the use of multiple databases,agents, and consoles that limit hardware platforms statisticsto counters available via simple network managementprotocol (SNMP) or intelligent platform managementinterface (IPMI), and granularity is usually set to 288 samplesper day.2
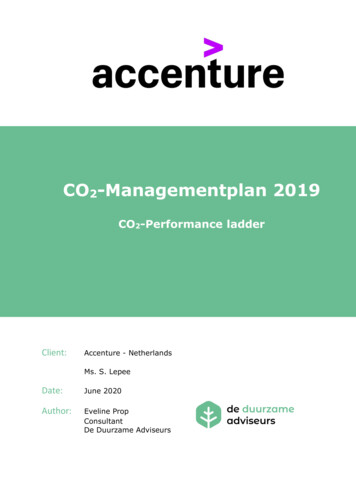
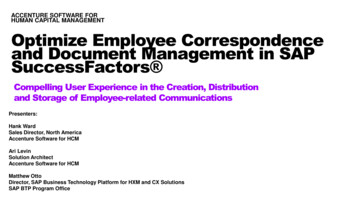
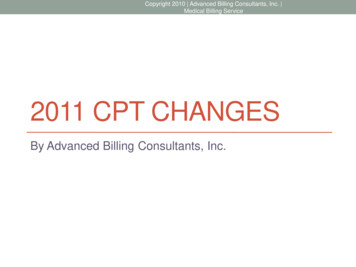
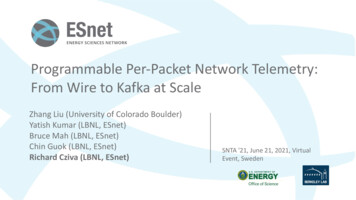
White Paper Accenture* Integrates a Service Assurance Solution for OpenStack*The Accenture solution, shown in Figure 1, includes a Collectd agent on each storage, compute, and controller/directorelement in the server. These agents provide the performance management information that is essential to service assuranceapplications. The design provides a complete undercloud/overcloud solution with a single database for metrics collection anda single console for graphing and data visualization. This solution maximizes information manageability and customization asmetric sets can be expanded, if necessary, through Collectd plugins and visualizations/data aggregations are configurable inGrafana via Graphite REST API.Figure 1. Accenture integrated service assurance platform*¹Figures 2 to 5 show the Grafana view of the hardware platform statistics (CPU, memory, and disk space) that are available afterthe new service assurance system is in place. These dashboards were built from scratch using Grafana web GUI. Each widgetwas configured specifying Graphite as data source and selecting specific Collectd metrics and statistic/temporal aggregationsfor series.Figure 2. Hardware platform data visualization²3
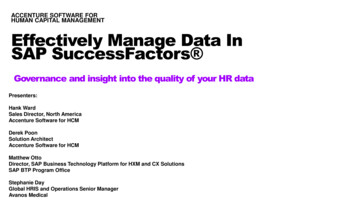
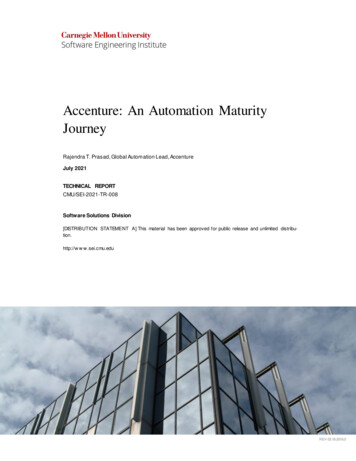
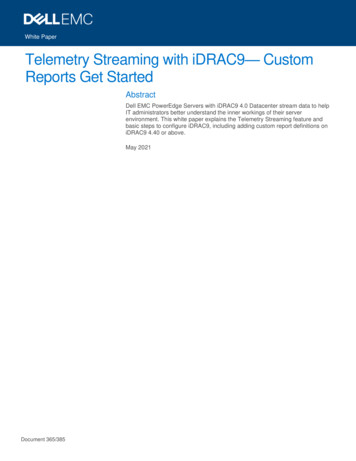
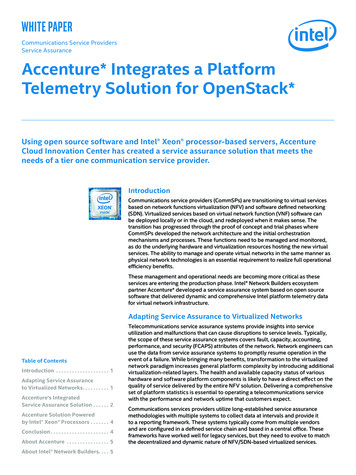
White Paper Accenture* Integrates a Service Assurance Solution for OpenStack*Figure 3. Hardware platform data visualization²Figure 4. Hardware platform data visualization²Figure 5. Hardware platform data visualization²Accenture Solution Powered by Intel Xeon ProcessorsAs a result of successful collaboration with Intel NetworkBuilders, Accenture developed the service using serverspowered by Intel Xeon processors E5-2600, using multiplegenerations of the processors in its work. Critical to thechoice of these CPUs were both the CPUs’ high performanceand Intel-provided Collectd plugins available as a part ofOPNFV* Barometer that made available Intel platformspecific telemetry data essential for the platform healthand performance. Intel is active in open source communityenabling service assurance features via its open sourcecontributions to Barometer.Intel is actively developing and contributing new plug-insto enable an increasingly rich set of system resource datafor use in network management and service assurance. Thelatest Intel Xeon Scalable processors are available with upto 28 cores. The CPUs feature Intel Virtualization Technology(Intel VT), a portfolio of technologies that provide hardwareassist to virtualization software, such as OpenStack, tominimize virtualization performance overhead in cache, I/O,and memory. Each generation processor will typically offernew metrics capability, and Intel provides the plug-ins toenable these for service assurance usages.ConclusionService assurance is a critical part of the service providernetwork that is just now becoming important for virtualizedservices. Accenture, using Intel Xeon processor-basedservers, has integrated a carrier-grade solution from opensource components that is able to proactively show aunique trend of resource usage, provide information aboutresource allocation and support decision making aboutcapacity change and network troubleshooting for a livevirtualized network service.4
White Paper Accenture* Integrates a Service Assurance Solution for OpenStack*About AccentureAbout Intel Network BuildersAccenture is a leading global professional services company,providing a broad range of services and solutions in strategy,consulting, digital, technology, and operations. Combiningunmatched experience and specialized skills across morethan 40 industries and all business functions—underpinnedby the world’s largest delivery network—Accenture works atthe intersection of business and technology to help clientsimprove their performance and create sustainable valuefor their stakeholders. With 459,000 people serving clientsin more than 120 countries, Accenture drives innovation toimprove the way the world works and lives. Visit us atwww.accenture.com.Intel Network Builders is an ecosystem of infrastructure,software, and technology vendors coming together withcommunications service providers and end users toaccelerate the adoption of solutions based on networkfunctions virtualization (NFV) and software definednetworking (SDN) in telecommunications and datacenter networks. The program offers technical support,matchmaking, and co-marketing opportunities to helpfacilitate joint collaboration through to the trial anddeployment of NFV and SDN solutions. Learn more athttp://networkbuilders.intel.com.¹ Figures provided courtesy of Accenture.² Testing completed by Accenture. Configurations: CPU for the compute server was an Intel Xeon CPU E5-2660 v2 at 2.20GHz; CPU for the controller server was an Intel Xeon CPU E5-2670 v3 at2.30GHz; CPU for the Neutron-Ceph server was an Intel Xeon CPU E5-2680 v4 at 2.40GHz. The compute server featured 192 GB of RAM and the other servers had 130GB of RAM. Each serverhad 500GB hard drive (MM0500GBKAK).Software and workloads used in performance tests may have been optimized for performance only on Intel microprocessors.Performance tests, such as SYSmark and MobileMark, are measured using specific computer systems, components, software, operations and functions. Any change to any of those factors maycause the results to vary. You should consult other information and performance tests to assist you in fully evaluating your contemplated purchases, including the performance of that productwhen combined with other products. For more complete information visit www.intel.com/benchmarks.Performance results are based on testing as of July 31, 2018, and may not reflect all publicly available security updates. See configuration disclosure for details. No component or product can beabsolutely secure.Intel technologies’ features and benefits depend on system configuration and may require enabled hardware, software or service activation. Performance varies depending on systemconfiguration. No computer system can be absolutely secure. Check with your system manufacturer or retailer or learn more at intel.com.Intel does not control or audit third-party benchmark data or the web sites referenced in this document. You should visit the referenced web site and confirm whether referenced data areaccurate. Intel Corporation. Intel, the Intel logo, and Xeon are trademarks of Intel Corporation or its subsidiaries in the U.S. and/or other countries.* Other names and brands may be claimed as the property of others.0119/DO/H09/PDFPlease Recycle338649-001US5
White Paper Accenture* Integrates a Service Assurance Solution for OpenStack* Figure 4 . Hardware platform data visualization² Figure 5 . Hardware platform data visualization² Accenture Solution Powered by Intel Xeon Processors As a result of successful collaboration with Intel Network Builders, Accenture developed the service using servers