Transcription
Technical OverviewPerformance Equivalence of theD1000 ScreenTape Assays on theAgilent TapeStation SystemsIntroductionAgilent TapeStation systems are well-established automated electrophoresissystems for fast and reliable analysis of nucleic acids for multiple applications.The platform integrates a benchtop electrophoresis-based instrument,data-processing TapeStation software, and reagents, used in concert withapplication-specific ScreenTape sample-processing consumable devices.DNA and RNA samples can be analyzed with minimal handling effort and fullyscalable throughput from 1 to 96 samples. The entire Agilent ScreenTapeportfolio for TapeStation systems is a vital tool for sample quality control (QC) atdifferent checkpoints in next-generation sequencing (NGS) workflows.To provide users with continued improvements and benefits to the TapeStationplatform, Agilent has recently introduced a technology update to the Agilent4200 TapeStation instrument. For example, all instruments manufactured fromspring 2021 are equipped with a modified ScreenTape nest, enabling users toeasily exchange the electrode cartridge during the yearly, mandatory, preventivemaintenance service. Thus, the modified ScreenTape nest secures an optimizedcost of ownership. In addition, a modified instrument optical system allowsfor a better match with the application-specific fluorescent dyes. All existingScreenTape applications as well as plastic consumables are fully compatiblewith the new 4200 TapeStation system.This technical overview highlights the performance of the Agilent D1000ScreenTape assay and the Agilent High Sensitivity D1000 ScreenTape assayon the new 4200 TapeStation system. Analytical assay specifications likesensitivity, sizing, quantification, and molarity delivered by the new instrumentwere evaluated and compared with the results obtained on the legacy 4200 and4150 TapeStation systems to demonstrate data equivalency between all threemodels.
Analytical specificationsSizing, quantification, and molaritywere compared between threeTapeStation models using the providedcorresponding ScreenTape ladders assamples, a 300 bp DNA fragment, andsheared human genomic DNA (gDNA).Table 1 summarizes the analyticalspecifications of the D1000 and HighSensitivity D1000 ScreenTape assays.ExperimentalMaterialsThe 4150 TapeStation (p/n G2992AA),legacy 4200 TapeStation (p/n G2991AA),and new 4200 TapeStation (p/nG2991BA) systems with the AgilentD1000 ScreenTape (p/n 5067-5582),D1000 Reagents (p/n 5067-5583), AgilentHigh Sensitivity D1000 ScreenTape (p/n5067-5584), and High Sensitivity D1000Reagents (p/n 5067-5585) were obtainedfrom Agilent Technologies Inc. NoLimits300 bp DNA fragments (p/n SM1621),the Qubit 2.0 Fluorometer, and Qubit1X dsDNA HS (High Sensitivity) AssayKit (p/n Q33231) were purchased fromThermo Fisher Scientific Inc. Humangenomic DNA (p/n G304A) was acquiredfrom Promega. The M220 Focusedultrasonicator and the microTUBEs wereobtained from Covaris Inc.Sample preparationDNA fragments were prepared bydiluting the commercially availableDNA from Promega in 10 mM TrisHCl (pH 8.0) to achieve a desirednumber of concentrations within thequantitative ranges of both D1000ScreenTape assays (Table 1). HumangDNA provided by the vendor was2Table 1. Comparison of analytical specifications of the Agilent D1000 ScreenTape assay and the AgilentHigh Sensitivity D1000 ScreenTape assay.Analytical SpecificationsSizing RangeTypical ResolutionSensitivity1Agilent D1000ScreenTape AssayAgilent High Sensitivity D1000ScreenTape Assay35 to 1,000 bp35 to 1,000 bp35 to 300 bp: 15%300 to 1,000 bp: 10%35 to 300 bp: 15%300 to 1,000 bp: 10%0.1 ng/µL5 pg/µLSizing Precision25% CV5% CVSizing Accuracy2,3 10% 10%Quantitative Precision0.1 to 1 ng/µL: 15% CV1 to 50 ng/µL: 10% CV15% CVQuantitative Accuracy2 20% 20%0.1 to 50 ng/µL10 to 1,000 pg/µLQuantitative Range¹Signal-to-noise 3 (single peak)²Measured using one ladder per ScreenTape device3Sizing accuracy for analysis with electronic ladder: 20%utilized to generate DNA smears. ThegDNA was sheared in the microTUBEson the Covaris instrument according tothe manufacturer’s recommendations.A shearing time of 110 seconds wasselected to achieve a target peak sizeof approximately 300 bp. The finalsmear sample was diluted in 10 mMTris-HCl (pH 8.0) to prepare differentconcentrations satisfying the respectivespecifications1. Nominal concentrationsof all analyzed samples were determinedon the Qubit Fluorometer with Qubit 1XdsDNA HS Assay Kit. The respectiveDNA ScreenTape ladders were usedas samples without any additionaltreatment.DNA analysisThe D1000 and High Sensitivity D1000ScreenTape assays were utilized forsample analysis on three new 4200TapeStation instruments, and on singlelegacy 4200 and 4150 TapeStationsystems, respectively. Samplepreparation for both assays wereperformed according to the Agilent quickguide instructions2,3. The DNA sampleswere analyzed in replicates of nine onall TapeStation systems using AgilentTapeStation software 4.1.
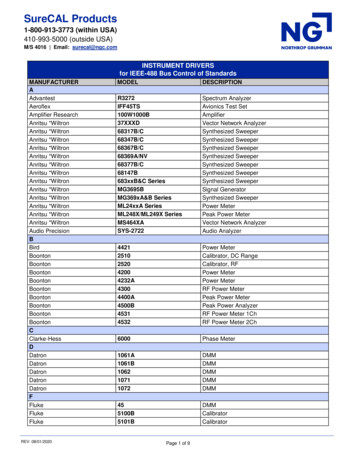
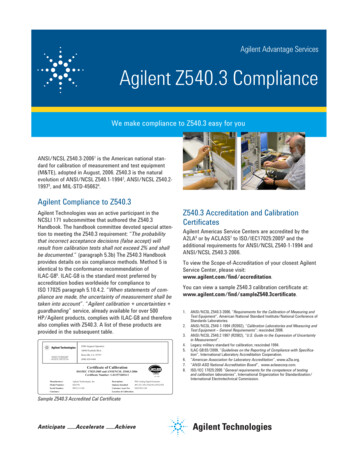
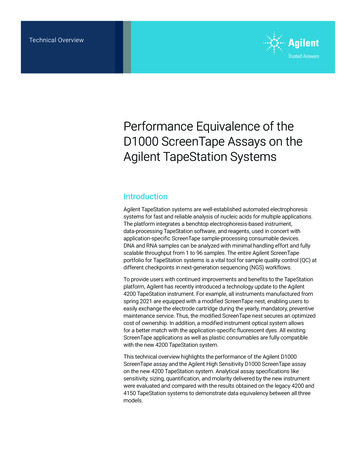
Results and discussionSensitivity750 pg/µL250 pg/µL100010 pg/µL800600400Upper markerLower marker200Size[bp]1500100070050040030020010050025An enlarged section shows the overlayof the technical replicates (n 9) at aconcentration of 5 pg/µL, correspondingto the specified limit of detection(Table 1). The respective fragment peakof 300 bp was clearly detected for all9 replicates with signal-to-noise ratiogreater than 3. Thereby, the sensitivity ofthe High Sensitivity D1000 ScreenTapeassay using a commercially availablefragment was confirmed on the new4200 TapeStation system. Likewise, thesensitivity of 0.1 ng/µL was verified forthe D1000 ScreenTape assay (data notshown).1,000 pg/µL5 pg/µL500 pg/µLSample Intensity [Normalized FU]A dilution series of a 300 bp DNAfragment with six concentrations from 5to 1,000 pg/µL was analyzed on a new4200 TapeStation system using the HighSensitivity D1000 ScreenTape assay.The electropherogram overlay of all usedconcentrations demonstrated single anddistinct peaks (Figure 1).1200Figure 1. A 300 bp DNA fragment dilution series (5 to 1,000 pg/µL) was analyzed using the Agilent HighSensitivity D1000 ScreenTape assay on the new Agilent 4200 TapeStation system. The enlarged imageshows the overlay of individual electropherograms at the specified limit of detection of 5 pg/µL (n 9).3
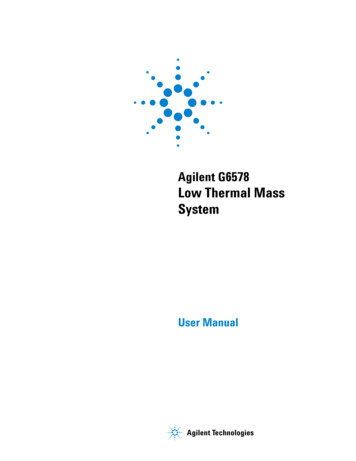
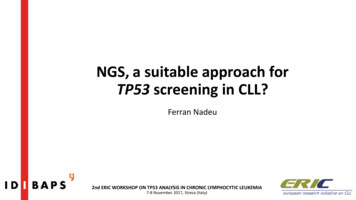
Absolute sizes were determined on threenew 4200 TapeStation instruments andcompared with the results obtainedon both the legacy 4200 and 4150TapeStation systems for all fragmentsconstituting the correspondingladders. The sizing performance of allinstruments is presented as an individualbar chart for each assay with nominalladder fragment sizes supplied by Agilenton the X-axes (Figure 2).Agilent D1000 ScreenTape assay1,000800Determined size (bp)The analytical specifications of theD1000 and High Sensitivity D1000ScreenTape assays are summarized inTable 1. Differing in quantitative range,both D1000 assays allow for accurateseparation of DNA fragments andsmears ranging from 35 to 1,000 bp inlength. Previously, sizing specificationsof the D1000 DNA assays were evaluatedon the legacy 4200 TapeStationsystem using two commerciallyavailable ladders4. In this study,sizing performance on the new 4200TapeStation instrument was evaluatedusing the D1000 and High SensitivityD1000 ScreenTape assay ladders assamples, as described for the 4150TapeStation system5, and the results ofall TapeStation models were al size (bp)B4150 TapeStationLegacy 4200 TapeStationNew 4200 TapeStation (1)New 4200 TapeStation (2)New 4200 TapeStation (3)Agilent High Sensitivity D1000 ScreenTape assay1,000Determined size minal size (bp)4150 TapeStationLegacy 4200 TapeStationNew 4200 TapeStation (1)New 4200 TapeStation (2)New 4200 TapeStation (3)Figure 2. Sizing results for eight DNA fragments of the corresponding Agilent ScreenTape assay ladderanalyzed on three new Agilent 4200 TapeStation instruments and on both the legacy Agilent 4200TapeStation instrument and the Agilent 4150 TapeStation instrument (n 9) compared to nominal sizes.(A) Agilent D1000 ScreenTape assay and (B) Agilent High Sensitivity D1000 ScreenTape assay.4
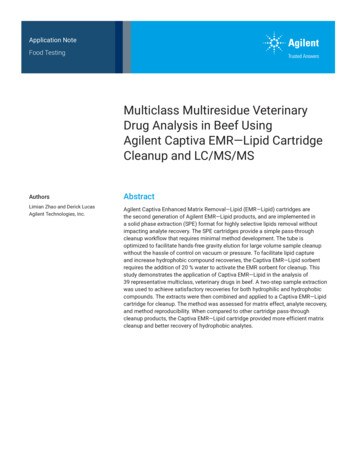
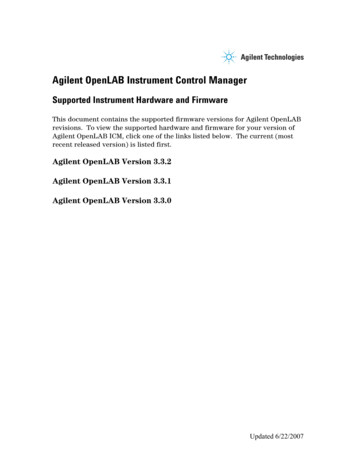
]1500100070050040030020010050025The average size of a sample is a criticalparameter of an NGS library to beprepared for multiplex sequencing, as itis required for molarity calculation. Theaverage size of a library can be easilydetermined with the region analysisfunction of the TapeStation analysissoftware. In comparison to peak sizedetermination, which is well suited for asymmetrical size distribution, the regionanalysis is more accurate for shearedDNA with a tailing on either side. Aset region, flanking the entire smear,provides an average smear size thatexcludes a potential bias associatedwith uneven size distribution. Figure 3illustrates how the region functionality ofthe TapeStation system can be applied toa sheared DNA sample. The average sizeof a smear is automatically reported bythe TapeStation analysis software in theregion table.1000Sample Intensity [Normalized FU]Sizing accuracy and precision for theD1000 and the High Sensitivity D1000ScreenTape assays were evaluated onthe new 4200 TapeStation instrumentsin direct comparison with valuesobtained on the legacy 4200 andthe 4150 TapeStation instruments.Sizing accuracy was 2.6% or lessfor both ScreenTape assays on allTapeStation instruments, well withinassay specifications ( 10%). Sizingprecision did not exceed a coefficient ofvariation (%CV) of 1.1% for the D1000,and 2.1% for the High Sensitivity D1000ScreenTape assays on all three differentTapeStation models, which is within thespecified sizing precision of 5% for bothassays.Figure 3. An example electropherogram of a sheared DNA sample analyzed on the new Agilent 4200TapeStation system with the Agilent High Sensitivity D1000 ScreenTape assay using Agilent TapeStationanalysis software region function. The region from 45 to 1,000 bp was established to flank the entiresmear.5
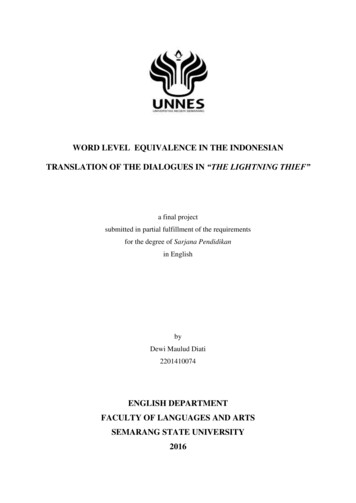
Figure 4 shows the comparison of sizingresults of the D1000 and High SensitivityD1000 ScreenTape assays delivered bythe 4150, legacy 4200, and three new4200 TapeStation systems, respectively.The results of all TapeStation modelswere comparable throughout thenominal concentrations and highlyconsistent between the three new 4200TapeStation instruments. The D1000and High Sensitivity D1000 ScreenTapeassays demonstrated reproducible sizingwith a maximum %CV of 2.6% and 3.7%,respectively. Both DNA ScreenTapeassays met the specified analyticalspecifications of 5%.Accurate and precise sizing performanceof the D1000 and the High SensitivityD1000 ScreenTape assays was fullyvalidated with multiple sample typeson the new 4200 TapeStation system.The sizing results obtained on the newinstrument were equivalent to the resultsdelivered by the other two TapeStationmodels.AAgilent D1000 ScreenTape assay400350Average size (bp)300250200150100500550100Nominal concentration (ng/µL)B4150 TapeStationLegacy 4200 TapeStationNew 4200 TapeStation (1)New 4200 TapeStation (2)New 4200 TapeStation (3)Agilent High Sensitivity D1000 ScreenTape assay400350Average size (bp)Sheared gDNA samples of differentconcentrations were prepared tobe within the previously specifiedquantitative range for smears1. Thesamples were separated with boththe D1000 and the High SensitivityD1000 ScreenTape assays on all threeTapeStation models and demonstratedexcellent sizing performance withrespect to smear analysis. An identicalsmear analysis region ranging from 45 to1,000 bp was set for both assays withinthe TapeStation analysis software.3002502001501005005007,50015,000Nominal concentration (pg/µL)4150 TapeStationLegacy 4200 TapeStationNew 4200 TapeStation (1)New 4200 TapeStation (2)New 4200 TapeStation (3)Figure 4. Comparative analysis of average size for sheared DNA throughout the respective dilution series.(A) Agilent D1000 ScreenTape assay. (B) Agilent High Sensitivity D1000 ScreenTape assay.6
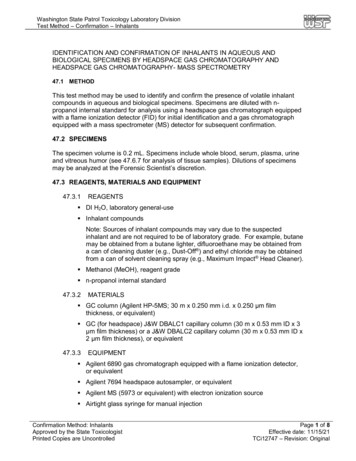
Quantitative performance of the D1000ScreenTape assays on the legacy 4200TapeStation system was previouslyevaluated using the respective dilutionsof a commercially available 600 bp DNAfragment³. Similarly, serial dilutions ofa 300 bp DNA fragment covering theentire specified quantitative range wereused to assess quantitative capabilitiesof the D1000 assays on the new 4200TapeStation system. Direct comparisonof the quantitative results between thenew and the legacy 4200 TapeStationsystems as well as between thenew 4200 and the 4150 TapeStationsystems is shown in Figure 5. As thequantitative ranges of the D1000 andHigh Sensitivity D1000 ScreenTapeassays overlap, the data generated byboth assays were presented together,on a logarithmic scale. The scatterplotsdemonstrated excellent linearity,confirming accurate measurementswithin the specified quantitative ranges(Table 1). Concentrations measuredon the new 4200 TapeStation systemwere consistent with those reportedby the other two TapeStation systemsand the measurements showed strongcorrelation between all three models,with R2 values of 99.9 to 100%.100,000High Sensitivity D1000 ScreenTape assayD1000 ScreenTape assay10,000Concentration (pg/µL)New 4200 TapeStation systemThe D1000 ScreenTape assays enableprecise determination of sampleconcentration within quantitativeranges from 10 to 1,000 pg/µL for highsensitivity and from 0.1 to 50 ng/µL forstandard sensitivity assays, respectively.Quantitative accuracy and precision forboth ScreenTape assays are outlined inTable 1.A1,000y 0.9729xR2 0.999810010y 1.0006xR2 111101001,00010,000100,000Concentration (pg/µL)Legacy 4200 TapeStation systemB100,000High Sensitivity D1000 ScreenTape assayD1000 ScreenTape assay10,000Concentration (pg/µL)New 4200 TapeStation systemQuantification1,000y 0.9631xR2 0.999410010y 0.9651xR2 0.999911101001,00010,000100,000Concentration (pg/µL)4150 TapeStation systemFigure 5. Quantification of a 300 bp fragment in a dilution series from 10 to 50,000 pg/μL. The fragmentswere analyzed with the Agilent High Sensitivity D1000 ScreenTape assay and the Agilent D1000ScreenTape assay. (A) Comparison of the quantification on the legacy (X-axis) and new Agilent 4200TapeStation systems (Y-axis). (B) Comparison of the quantification on the Agilent 4150 TapeStationsystem (X-axis) and the new 4200 TapeStation system (Y-axis).7
AAgilent D1000 ScreenTape assay15%CV10500.15254050Nominal concentration (ng/µL)4150 TapeStationLegacy 4200 TapeStationNew 4200 TapeStation (1)New 4200 TapeStation (2)New 4200 TapeStation (3)Agilent High Sensitivity D1000 ScreenTape assayB1510%CVThe quantitative specificationspresented in Table 1 were evaluatedon the new 4200 TapeStation systemin comparison with the legacy 4200and 4150 TapeStation systems.Quantitative results on the new 4200TapeStation instrument were achievedwith accuracy relative to the legacy 4200TapeStation instrument of 3.2% orless for the D1000 and 2.1% or less forthe High Sensitivity D1000 ScreenTapeassays, respectively. All TapeStationmodels demonstrated accuratequantitative results across the entireconcentration range of both assaysand met the corresponding analyticalspecifications (Table 1). Quantitativeprecision was below 5% for the D1000and below 6% for the High SensitivityD1000 ScreenTape assays for allconcentrations. As shown in Figure 6, allsystems met the specified quantitativeprecision for both assays. Highlycomparable results were also deliveredby analysis of sheared gDNA at differentconcentrations within the specifiedquantitative range of each assay (datanot shown). Quantitative precisionwas 3% or less for the D1000 and 4%or less for the High Sensitivity D1000ScreenTape assays. Overall, consistentand reliable quantitative results weredelivered by all three TapeStationmodels.50102505007501,000Nominal concentration (pg/µL)4150 TapeStationLegacy 4200 TapeStationNew 4200 TapeStation (1)New 4200 TapeStation (2)New 4200 TapeStation (3)Figure 6. Quantification precision of the 300 bp fragment over five concentrations analyzed with.three new Agilent 4200 TapeStation instruments and on both the legacy Agilent 4200 TapeStationinstrument and the Agilent 4150 TapeStation instrument. The orange lines indicate the correspondingspecified quantitative precision. (A) Quantification precision of the Agilent D1000 ScreenTape assay. (B)Quantification precision of the Agilent High Sensitivity D1000 ScreenTape assay.8
To assess the equivalence of thecalculated molarity data on the new4200 TapeStation system, a shearedgDNA sample with a nominal averagesize of 300 bp was analyzed with boththe D1000 and High Sensitivity D1000ScreenTape assays. The molarity valuesof the new 4200 TapeStation instrumentwere plotted pairwise against the valuesdelivered by the legacy 4200 (Figure7A) and 4150 TapeStation systems(Figure 7B). As shown in Figure 7, bothplots demonstrated excellent molaritycorrelation by the regression analysis,with R² values of 99.9 to 100%.1,000High Sensitivity D1000 ScreenTape assayD1000 ScreenTape assayMolarity (nmol/L)New 4200 TapeStation systemMolarity is determined by both theaverage size and the concentration ofa DNA smear. Even minor differencesin both values greatly change themolar concentration of the sample.Accurate estimation of molarity isessential for successful multiplexsequencing. NGS sequencing protocolsrequire normalization of the librariesprior to volumetric pooling. Onlyequimolar pooling can ensure an evenread distribution of all samples. TheTapeStation software automaticallydelivers molarity values, eliminating aneed for additional calculations.A100y 1.0205xR2 0.999810y 0.9872xR2 0.999911101001,000Molarity (nmol/L)Legacy 4200 TapeStation systemB1,000High Sensitivity D1000 ScreenTape assayD1000 ScreenTape assayMolarity (nmol/L)New 4200 TapeStation systemMolarity100y 0.9828xR2 110y 0.9472xR2 111101001,000Molarity (nmol/L)4150 TapeStation systemFigure 7. Molarity correlation of sheared gDNA samples in serial dilutions obtained with the Agilent HighSensitivity D1000 assay and Agilent D1000 ScreenTape assay. Molarity was calculated using the regionfunctionality. (A) Comparison of the sample molarities obtained with the legacy (X-axis) compared to thenew Agilent 4200 TapeStation systems (Y-axis). (B) Comparison of the sample molarities obtained with theAgilent 4150 TapeStation system (X-axis) and the new Agilent 4200 TapeStation system (Y-axis).9
8004150 TapeStationLegacy 4200 TapeStation700Sample Intensity [Normalized FU]Figure 8 shows an exampleelectropherogram overlay generatedby a separation of sheared DNA usingthe High Sensitivity D1000 ScreenTapeassay on all three TapeStation models.The new and legacy 4200 and the4150 TapeStation systems providedan equivalent smear pattern. Likewise,the size distribution was observed tobe the same between the three new4200 TapeStation instruments (Figure9). All TapeStation systems reportedconsistent molarity values and providedidentical smear patterns, verifying highreplicability across the instruments. Bydelivering identical results, the new andthe legacy 4200 TapeStation systemsdemonstrated equal performance inrelation to analysis of DNA smears.New 4200 040030020010050250Figure 8. Electropherogram overlay of a smear sample analyzed using the Agilent High Sensitivity D1000ScreenTape assay on the Agilent 4150 TapeStation system, legacy Agilent 4200 TapeStation system, andnew Agilent 4200 TapeStation system.8004150 TapeStationLegacy 4200 TapeStationSample Intensity [Normalized FU]700New 4200 0010050250Size[bp]Figure 9. Electropherogram overlay of a smear sample analyzed using the Agilent High Sensitivity D1000ScreenTape assay on three new Agilent 4200 TapeStation systems.10
ConclusionReferencesThis technical overview demonstratesthe equivalent performance of the AgilentD1000 ScreenTape assay and the AgilentHigh Sensitivity D1000 ScreenTape assayfor the separation of DNA fragmentsand smears among Agilent TapeStationinstruments. The electrophoretic analysisof the DNA fragments between 35 and1,000 bp in length provided accuratesizing, precise quantification, and highsensitivity down to 5 pg/µL, fully meetingthe assay analytical specifications.Furthermore, highly reliable andreproducible results were delivered forsheared gDNA samples with respect toaverage size, concentration, and molarity.1.Comparison of DNA Assays Using the 4200 TapeStation Systems and 2100Bioanalyzer System. Agilent Technologies technical overview, publication number5991-9093EN, 2018.2.Agilent D1000 ScreenTape Quick Guide for TapeStation Systems. AgilentTechnologies, publication number G2991-90031, 2018.3.Agilent High Sensitivity D1000 ScreenTape Quick Guide for TapeStation Systems.Agilent Technologies, publication number G2991-90131, 2018.4.Performance of the Agilent D1000 and the Agilent High Sensitivity D1000ScreenTape Assay for the Agilent 4200 TapeStation System. Agilent Technologiestechnical overview, publication number 5991-6903EN, 2016.5.Performance Characteristics of the D1000 and High Sensitivity D1000ScreenTape Assays for the 4150 TapeStation System. Agilent Technologiestechnical overview, publication number 5994-0277EN, 2018.The performance of the D1000ScreenTape assays was equivalentbetween the new and legacy Agilent4200 TapeStation systems, ensuring fullcompatibility. In addition, the same highcorrelation for sizing, quantification, andmolarity was noted between the new4200 and the Agilent 4150 TapeStationsystems. Overall, this technical overviewconfirms the analytical specificationsof both the D1000 and High SensitivityD1000 ScreenTape assays on thenew 4200 TapeStation system anddemonstrates data equivalency betweenthe three different TapeStation models.11
www.agilent.com/genomics/tapestationFor Research Use Only. Not for use in diagnostic procedures.PR7000-7800This information is subject to change without notice. Agilent Technologies, Inc. 2021Printed in the USA, March 31, 20215994-3114EN
on the Qubit Fluorometer with Qubit 1X dsDNA HS Assay Kit. The respective DNA ScreenTape ladders were used as samples without any additional treatment. DNA analysis The D1000 and High Sensitivity D1000 ScreenTape assays were utilized for sample analysis on three new 4200 TapeStation instruments, and on single legacy 4200 and 4150 TapeStation