Transcription
Spotlight on StatisticsU.S. BUREAU OF LABOR STATISTICSJANUARY 2017STEM Occupations: Past, Present, And FutureStella Fayer, Alan Lacey, and Audrey WatsonNot that long ago, if you were planning a trip to another country, you would probably go to the library to do someresearch, pick up a foreign phrasebook, and go to the travel agent to book your flight and a hotel. But now, all youhave to do is reach for a smart phone. We made just a short leap in time, but an enormous leap in technologicaladvances. Today, it would be difficult to imagine our daily lives without smart phones, applications (“apps”), onlineshopping, and many other conveniences made possible by the men and women working in science, technology,engineering, and mathematics (STEM) occupations. This Spotlight on Statistics uses data from OccupationalEmployment Statistics and Employment Projections to take a closer look at STEM occupations.Page 1
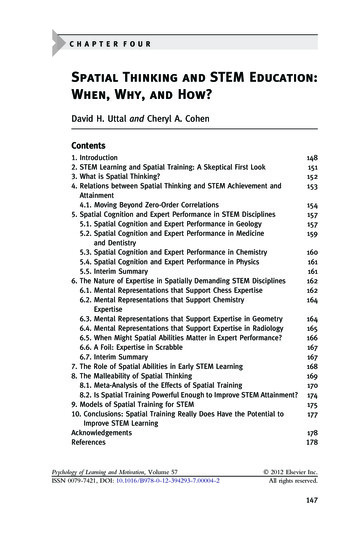
Spotlight on StatisticsU.S. BUREAU OF LABOR STATISTICSNearly 8.6 million STEM jobs in 2015There were nearly 8.6 million STEM jobs in May 2015, representing 6.2 percent of U.S. employment. Computeroccupations made up nearly 45 percent of STEM employment, and engineers made up an additional 19 percent.Mathematical science occupations and architects, surveyors, and cartographers combined made up less than 4 percentof STEM employment.Page 2
Spotlight on StatisticsU.S. BUREAU OF LABOR STATISTICSSeven out of the ten largest STEM occupations were computer relatedMost of the largest STEM occupations were related to computers and information systems. With employment ofnearly 750,000, applications software developers was the largest STEM occupation. Computer user supportspecialists and computer systems analysts each accounted for over a half a million jobs.Wholesale and manufacturing sales representatives of technical and scientific products (334,010) was the largestSTEM occupation not related to computers. Mechanical engineers and civil engineers, also non-computer-relatedSTEM occupations, each accounted for over a quarter of a million jobs.But not all STEM occupations were large. Some were among the smallest occupations in the country, includingmathematical technicians, with only 820 jobs. Astronomers, postsecondary teachers of forestry and conservationscience, and mathematical science occupations, all other, each had employment of less than 2,000.Page 3
Spotlight on StatisticsU.S. BUREAU OF LABOR STATISTICSPage 4
Spotlight on StatisticsU.S. BUREAU OF LABOR STATISTICSPage 5
Spotlight on StatisticsU.S. BUREAU OF LABOR STATISTICSNinety-three out of 100 STEM occupations had wages above the nationalaverageWages for STEM occupations varied vastly. The national average wage for all STEM occupations was 87,570,nearly double the national average wage for non-STEM occupations ( 45,700). Ninety-three out of 100 STEMoccupations had wages significantly above the national average wage for all occupations of 48,320. Petroleumengineers was the highest paid STEM occupation, with an annual mean wage of 149,590, over 100,000 higher thanthe national average across all occupations. Physicists ( 118,500) was also among the highest paid STEMoccupations.Seven STEM occupations had annual mean wages near or below the national average. Environmental science andprotection technicians, including health, and biological technicians had mean wages of 46,540 and 45,230,respectively. Agricultural and food science technicians and forest and conservation technicians each earned below 40,000 per year on average.Page 6
Spotlight on StatisticsU.S. BUREAU OF LABOR STATISTICSSTEM occupations had above-average growthEmployment in STEM occupations grew by 10.5 percent, or 817,260 jobs, between May 2009 and May 2015,compared with 5.2 percent net growth in non-STEM occupations. Computer occupations and engineers were amongthe types of STEM occupations with the highest job gains. Employment in computer occupations was nearly 3.2million in May 2009 and nearly 3.9 million in May 2015. Employment of engineers was nearly 1.5 million in May2009, compared with over 1.6 million in May 2015. Some STEM occupations lost jobs. In 2009, there were nearly478,000 jobs in STEM-related sales occupations, compared with approximately 406,000 in 2015.Page 7
Spotlight on StatisticsU.S. BUREAU OF LABOR STATISTICSPage 8
Spotlight on StatisticsU.S. BUREAU OF LABOR STATISTICSPage 9
Spotlight on StatisticsU.S. BUREAU OF LABOR STATISTICSProjected growth rates for types of STEM occupationsThe STEM group that is projected to grow fastest from 2014 to 2024 is the mathematical science occupations groupat 28.2 percent, compared with the average projected growth for all occupations of 6.5 percent. This group includesoccupations such as statisticians and mathematicians. Since this group has the lowest employment among the STEMgroups in 2014, this growth will result in only about 42,900 new jobs over the period. The only STEM group that isprojected to show little or no change is drafters, engineering technicians, and mapping technicians, with a slightprojected decline of 1.4 percent, a decline of about 9,600 jobs.Page 10
Spotlight on StatisticsU.S. BUREAU OF LABOR STATISTICSProjected new jobs for types of STEM occupationsEmployment in computer occupations is projected to increase by 12.5 percent from 2014 to 2024, and due to its largeemployment size, this growth is expected to result in nearly half a million new jobs, far more than any other STEMgroup. The group projected to add the second largest number of new jobs from 2014 to 2024 is engineeringoccupations, with 65,000 new jobs.Page 11
Spotlight on StatisticsU.S. BUREAU OF LABOR STATISTICSProjected job openings for types of STEM occupationsJob openings show the combination of new jobs and jobs expected to result from workers permanently leavingoccupations and needing to be replaced. The computer occupational group is projected to yield over 1 million jobopenings from 2014 to 2024. The smallest number of job openings projected are in the architects, surveyors, andcartographers group, at only 52,500 projected openings.Page 12
Spotlight on StatisticsU.S. BUREAU OF LABOR STATISTICSSTEM occupations had high educational requirementsOver 99 percent of STEM employment was in occupations that typically require some type of postsecondaryeducation for entry, compared with 36 percent of overall employment. Occupations that typically require a bachelor’sdegree for entry, like software developers and engineers, made up 73 percent of STEM employment, but only 21percent of overall employment. Over half of the remaining STEM employment was in occupations that typicallyrequire an associate’s degree for entry, like web developers and engineering technicians. Surveying and mappingtechnicians, for which the typical entry level requirement is a high school diploma or the equivalent, is the onlySTEM occupation that does not typically require postsecondary education for entry.Page 13
Spotlight on StatisticsU.S. BUREAU OF LABOR STATISTICS10 fastest growing STEM occupations that require a bachelor’s degreeNearly all of the 10 fastest growing STEM occupations that require a bachelor’s or higher degree for entry are in thecomputer and mathematics groups. Statisticians are projected to grow fastest from 2014 to 2024 with a growth rate of33.8 percent. Biomedical engineers is projected to be the fastest growing engineering occupation at 23.1 percent.Operations research analysts and cartographers and photogrammetrists are expected to grow rapidly due to increaseduse of data analytics and map technology by businesses and governments as part of their decision making.Page 14
Spotlight on StatisticsU.S. BUREAU OF LABOR STATISTICS10 fastest growing STEM occupations that do not require a bachelor’sdegreeOf those STEM occupations that typically require less than a bachelor’s degree for entry, the two fastest growing areweb developers (26.6 percent) and computer user support specialists (12.8 percent). Four of the fastest growingoccupations shown here are drafters or engineering technicians: electrical and electronics drafters, civil engineeringtechnicians, environmental engineering technicians, and aerospace engineering and operations technicians. Nine ofthe ten occupations shown here typically require an associate’s degree for entry. Computer user support specialiststypically require some college.Page 15
Spotlight on StatisticsU.S. BUREAU OF LABOR STATISTICSSTEM jobs accounted for more than half of employment in five industriesSTEM occupations made up 6.2 percent of overall national employment, but between one- and two-thirds ofemployment in some industries. Over 66 percent of employment in the computer systems design and related servicesindustry was in STEM occupations. STEM occupations also made up over 60 percent of employment in architectural,engineering, and related services and software publishers. The computer and peripheral equipment manufacturingindustry had nearly 60 percent STEM employment. Two other manufacturing industries, communications equipmentmanufacturing and semiconductor and other electronic component manufacturing, had nearly 40 percent STEMemployment.Page 16
Spotlight on StatisticsU.S. BUREAU OF LABOR STATISTICSNew STEM jobs by industryBetween May 2009 and May 2015, over 800,000 net STEM jobs were added to the U.S. economy. The computersystems design and related services industry increased its STEM employment by over 300,000 jobs. Employmentservices, an industry that helps job seekers to find temporary or permanent employment, added over 86,000 STEMjobs. The data processing, hosting, and related services industry added almost 31,000 STEM jobs, and colleges,universities, and professional schools added over 29,000 STEM jobs. STEM employment in general medical andsurgical hospitals increased by slightly more than 23,000 jobs.Page 17
Spotlight on StatisticsU.S. BUREAU OF LABOR STATISTICSSTEM jobs accounted for two-thirds of employment in computer systemsdesign industrySTEM occupations made up nearly 67 percent of employment in the computer systems design and related servicesindustry. Applications software developers, who design or customize software to meet clients’ computer operationalneeds, made up about 14 percent of industry employment. The largest STEM occupations in this industry alsoincluded computer systems analysts (167,830), systems software developers (130,630), computer user supportspecialists (125,440), and computer programmers (117,720). Computer and information systems managers, who plan,direct, or coordinate information technology activities, made up nearly 74,000 jobs in this industry.Page 18
Spotlight on StatisticsU.S. BUREAU OF LABOR STATISTICSProjected percent change of largest STEM occupations in computersystems design and related servicesSome of the fastest growing STEM occupations are in computer systems design and related services. The rapidgrowth projected for these occupations is due in large part to the projected growth for the industry of 23 percent.Computer programmers are projected to decline in this industry from 2014 to 2024 due to the ongoing trend ofoutsourcing the work to firms located overseas to cut costs.Page 19
Spotlight on StatisticsU.S. BUREAU OF LABOR STATISTICSNearly 900,000 STEM jobs were in the architectural, engineering, and relatedservices industryWith 897,850 STEM jobs, the architectural, engineering, and related services industry was among the largestindustries for STEM employment. Civil engineers was the largest STEM occupation in this industry. Two otherengineering occupations, mechanical engineers (63,070) and electrical engineers (41,880), also were among thelargest STEM occupations. The largest occupations in this industry also included several types of engineeringtechnicians: civil engineering technicians (33,140), surveying and mapping technicians (32,230), and electrical andelectronics engineering technicians (20,720). Architectural and civil drafters and architects, except landscape andnaval had employment in this industry of 71,240 and 81,320, respectively.Page 20
Spotlight on StatisticsU.S. BUREAU OF LABOR STATISTICSProjected growth in largest STEM occupations in architectural, engineering,and related servicesThe architectural, engineering, and related services industry is projected to grow by 8.0 percent from 2014 to 2024.The projected growth is due to firms from other industries contracting architectural and engineering services fromfirms in this industry rather than employing engineers and technicians themselves. Emphasis on automation andsoftware will lead to relatively fast growth in this industry for mechanical engineers. Demand for civil engineersworking in this industry will come from the need to improve infrastructure such as roads, bridges, and transit systems,as the population grows.Page 21
Spotlight on StatisticsU.S. BUREAU OF LABOR STATISTICSTen industries combined employed over 300,000 computer user supportspecialistsComputer user support specialists provide technical assistance to computer users in person, over the telephone, orelectronically. National employment for this occupation was 585,060. The computer systems design and relatedservices industry had the highest employment of this occupation (125,440). Industries with the highest employment ofcomputer user support specialists also included management of companies and enterprises (31,440), elementary andsecondary schools (30,630), and the employment services industry (30,180). Colleges, universities, and professionalschools had over 26,000 jobs in this occupation. Each of the remaining industries employed 20,000 or fewer computeruser support specialists.Page 22
Spotlight on StatisticsU.S. BUREAU OF LABOR STATISTICSMechanical engineers were employed in a variety of industriesMechanical engineers work on a wide variety of projects, ranging from planning and designing engines to overseeingthe installation of heating and cooling systems. Nationwide, their employment was 278,340. The architectural,engineering, and related services industry (63,070) had the highest employment of this occupation. Over 18,000 wereemployed in the scientific research and development services industry. Mechanical engineers worked in severalmanufacturing industries, including aerospace product and parts manufacturing (14,850); motor vehicle partsmanufacturing (12,760); navigational, measuring, electromedical, and control instruments manufacturing (10,820);other general purpose machinery manufacturing (10,250); and metalworking machinery manufacturing (7,920).Page 23
Spotlight on StatisticsU.S. BUREAU OF LABOR STATISTICSIndustries with more STEM employment had higher wagesIndustries with higher shares of STEM occupations typically had higher wages. STEM occupations made up overone-third of employment in professional, scientific, and technical services, which includes activities like computersystems design, engineering services, and research and development services. This industry also had one of thehighest average wages, 77,570 across all occupations. Information ( 70,440), utilities ( 73,100), and management ofcompanies and enterprises ( 79,600) also had both high overall average wages and high shares of STEMemployment. The industries with the lowest shares of STEM employment had among the lowest average wages: retailtrade ( 31,280) and accommodation and food services ( 24,340).Page 24
Spotlight on StatisticsU.S. BUREAU OF LABOR STATISTICSStates with higher shares of STEM jobs had higher wagesAs a share of total employment, STEM employment varied from 3.3 percent in Nevada and Mississippi to over 9percent in Maryland, Washington, and the District of Columbia. In general, higher shares of STEM employment wereassociated with higher wages. For example, the District of Columbia had both the highest overall average wage( 80,150) and one of the highest shares of STEM occupations. However, STEM employment wasn’t the only factoraffecting wage differences. In addition to high concentrations of STEM occupations like statisticians, physicists, andenvironmental scientists, the District of Columbia also had above-average shares of other high-wage occupations likelawyers and management analysts, which contributed to its high wage level. New York was one of the highest payingstates, but had a below-average share of STEM occupations.Page 25
Spotlight on StatisticsU.S. BUREAU OF LABOR STATISTICSCalifornia added nearly 161,000 STEM jobs since 2009Between May 2009 and May 2015, states that added the largest numbers of STEM jobs included California(160,950), Texas (102,190), New York (42,980), and Michigan (41,100). Several states had STEM employmentgrowth of more than 20 percent, compared with national STEM employment growth of 10.5 percent. These statesincluded North Dakota (26 percent), Tennessee (25 percent), and Oklahoma (24 percent).Page 26
Spotlight on StatisticsU.S. BUREAU OF LABOR STATISTICSPage 27
Spotlight on StatisticsU.S. BUREAU OF LABOR STATISTICSPage 28
Spotlight on StatisticsU.S. BUREAU OF LABOR STATISTICSSTEM occupations made up over one-fifth of employment in some areasAlthough STEM occupations made up 6.2 percent of national employment, they made up nearly 23 percent ofemployment in California-Lexington Park, Maryland, and over 22 percent of employment in San Jose-SunnyvaleSanta Clara, California. Huntsville, Alabama; Boulder, Colorado; and Corvallis, Oregon, also had among the highestemployment shares of STEM occupations. At the other end of the spectrum, STEM occupations made upapproximately 1 percent of employment in Hammond, Louisiana; Brownsville-Harlingen, Texas; Gadsden, Alabama;and Ocean City, New Jersey.Page 29
Spotlight on StatisticsU.S. BUREAU OF LABOR STATISTICSSTEM employment patterns differed by areaAmong metropolitan areas with high shares of STEM employment, the specific STEM occupations that wereprevalent differed. As a share of total employment, California-Lexington Park, Maryland, had nearly 49 times asmany aerospace engineers as the United States as a whole, as well as high concentrations of several other types ofengineers and engineering technicians. San Jose-Sunnyvale-Santa Clara, California, had high concentrations ofoccupations related to computers and information technology, such as computer hardware engineers, computer andinformation research scientists, and software developers. Corvallis, Oregon, had high shares of occupations related toconservation, wildlife, and agriculture, including zoologists and wildlife biologists, agricultural and food sciencetechnicians, and soil and plant scientists.Page 30
Spotlight on StatisticsU.S. BUREAU OF LABOR STATISTICSPage 31
Spotlight on StatisticsU.S. BUREAU OF LABOR STATISTICSPage 32
Spotlight on StatisticsU.S. BUREAU OF LABOR STATISTICSPage 33
Spotlight on StatisticsU.S. BUREAU OF LABOR STATISTICSFor more informationStella Fayer and Audrey Watson are economists in the Division of Occupational Employment Statistics, U.S. Bureauof Labor Statistics. Email: fayer.stella@bls.gov and watson.audrey@bls.gov. Alan Lacey is an economist in the Division ofOccupational Employment Projections, U.S. Bureau of Labor Statistics. Email: lacey.thomas@bls.gov.This Spotlight on Statistics presents May 2015 estimates from the Occupational Employment Statistics survey and2014–24 employment projections from the Employment Projections program.Occupational Employment Statistics estimates are published annually and measure occupational employment andwage rates for over 800 occupations for the nation, states, and nearly 600 metropolitan and nonmetropolitan areas;and for more than 460 industry classifications at the national level. The survey covers wage and salary workers innonfarm establishments and does not include the self-employed and owners, partners, and proprietors ofunincorporated businesses. More information about the survey is available in our frequently asked questions and in thetechnical documentation. Publicly available data are at www.bls.gov/oes/.The Employment Projections program develops industry and occupation employment projections at the national levelfor over 800 occupations and over 300 industries. The projections are released every two years and are 10-yearprojections. EP also develops the Occupational Outlook Handbook, the federal government’s principal careerguidance publication. The Handbook includes information about job duties, education and training, and careeroutlook for hundreds of occupations. More information about employment projections data is available at www.bls.gov/emp/. The Handbook is available at www.bls.gov/ooh/.This Spotlight uses one of many possible definitions of STEM occupations. "STEM" is defined in this Spotlight toconsist of 100 occupations, including computer and mathematical, architecture and engineering, and life and physicalscience occupations, as well as managerial and postsecondary teaching occupations related to these functional areasand sales occupations requiring scientific or technical knowledge at the postsecondary level. A list of occupationsincluded in the STEM definition used for this Spotlight is available at www.bls.gov/oes/stem list.xlsx. Guidance onalternative definitions can be found on our Standard Occupational Classification page. The STEM data used in thisSpotlight are available with our downloadable spreadsheets.Although this Spotlight presents selected 2009–15 employment comparisons using the Occupational EmploymentStatistics data, the data are not designed for making comparisons through time, and such comparisons should beinterpreted with caution. More information on the data and time series analysis is available in our frequently askedquestions.Data on employment by the typical education level needed to enter an occupation are based on education and trainingcategories from the BLS Employment Projections program. See the detailed definitions of these education and trainingcategories. Education and training levels assigned to each occupation are available at cupation.htm.Location quotients are the ratio of an occupation’s employment share in a state or area to its national share. Forexample, an occupation that makes up 6 percent of state employment and 2 percent of national employment wouldhave a location quotient in that state of 6/2 3. A location quotient greater than 1 means the occupation has a highershare of state or area employment than the national average.More information on STEM occupations is also available in the following articles and publications:Page 34
Spotlight on StatisticsU.S. BUREAU OF LABOR STATISTICS An overview of employment and wages in science, technology, engineering, and math (STEM) groups, Beyond the Numbers,April 2014 Science, technology, engineering, and mathematics (STEM) occupations: a visual essay, Monthly Labor Review, May 2011 STEM 101: Intro to tomorrow’s jobs, Career Outlook, March 2014 Occupational Outlook HandbookPage 35
U.S. BUREAU OF LABOR STATISTICS Spotlight on Statistics Page 1 JANUARY 2017 STEM Occupations: Past, Present, And Future Stella Fayer, Alan Lacey, and Audrey Watson Not that long a