Transcription
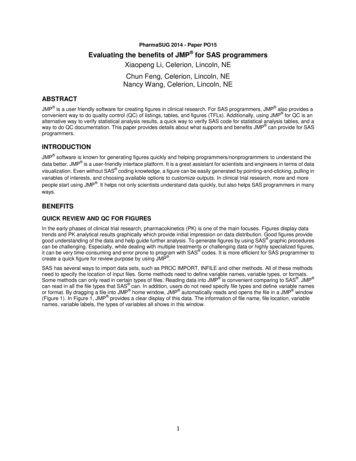
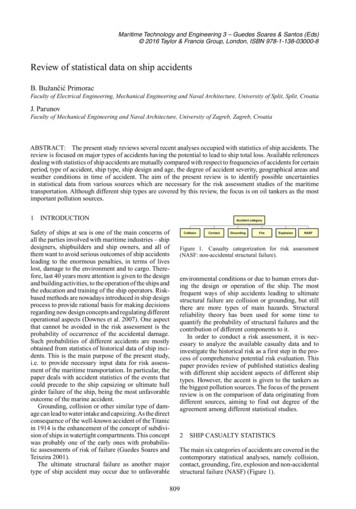
Maritime Technology and Engineering 3 – Guedes Soares & Santos (Eds) 2016 Taylor & Francis Group, London, ISBN 978-1-138-03000-8Review of statistical data on ship accidentsB. Bužančić PrimoracFaculty of Electrical Engineering, Mechanical Engineering and Naval Architecture, University of Split, Split, CroatiaJ. ParunovFaculty of Mechanical Engineering and Naval Architecture, University of Zagreb, Zagreb, CroatiaABSTRACT: The present study reviews several recent analyses occupied with statistics of ship accidents. Thereview is focused on major types of accidents having the potential to lead to ship total loss. Available referencesdealing with statistics of ship accidents are mutually compared with respect to frequencies of accidents for certainperiod, type of accident, ship type, ship design and age, the degree of accident severity, geographical areas andweather conditions in time of accident. The aim of the present review is to identify possible uncertaintiesin statistical data from various sources which are necessary for the risk assessment studies of the maritimetransportation. Although different ship types are covered by this review, the focus is on oil tankers as the mostimportant pollution sources.1INTRODUCTIONSafety of ships at sea is one of the main concerns ofall the parties involved with maritime industries – shipdesigners, shipbuilders and ship owners, and all ofthem want to avoid serious outcomes of ship accidentsleading to the enormous penalties, in terms of liveslost, damage to the environment and to cargo. Therefore, last 40 years more attention is given to the designand building activities, to the operation of the ships andthe education and training of the ship operators. Riskbased methods are nowadays introduced in ship designprocess to provide rational basis for making decisionsregarding new design concepts and regulating differentoperational aspects (Downes et al. 2007). One aspectthat cannot be avoided in the risk assessment is theprobability of occurrence of the accidental damage.Such probabilities of different accidents are mostlyobtained from statistics of historical data of ship incidents. This is the main purpose of the present study,i.e. to provide necessary input data for risk assessment of the maritime transportation. In particular, thepaper deals with accident statistics of the events thatcould precede to the ship capsizing or ultimate hullgirder failure of the ship, being the most unfavorableoutcome of the marine accident.Grounding, collision or other similar type of damage can lead to water intake and capsizing.As the directconsequence of the well-known accident of the Titanicin 1914 is the enhancement of the concept of subdivision of ships in watertight compartments. This conceptwas probably one of the early ones with probabilistic assessments of risk of failure (Guedes Soares andTeixeira 2001).The ultimate structural failure as another majortype of ship accident may occur due to unfavorableFigure 1. Casualty categorization for risk assessment(NASF: non-accidental structural failure).environmental conditions or due to human errors during the design or operation of the ship. The mostfrequent ways of ship accidents leading to ultimatestructural failure are collision or grounding, but stillthere are more types of main hazards. Structuralreliability theory has been used for some time toquantify the probability of structural failures and thecontribution of different components to it.In order to conduct a risk assessment, it is necessary to analyze the available casualty data and toinvestigate the historical risk as a first step in the process of comprehensive potential risk evaluation. Thispaper provides review of published statistics dealingwith different ship accident aspects of different shiptypes. However, the accent is given to the tankers asthe biggest pollution sources. The focus of the presentreview is on the comparison of data originating fromdifferent sources, aiming to find out degree of theagreement among different statistical studies.2SHIP CASUALTY STATISTICSThe main six categories of accidents are covered in thecontemporary statistical analyses, namely collision,contact, grounding, fire, explosion and non-accidentalstructural failure (NASF) (Figure 1).809
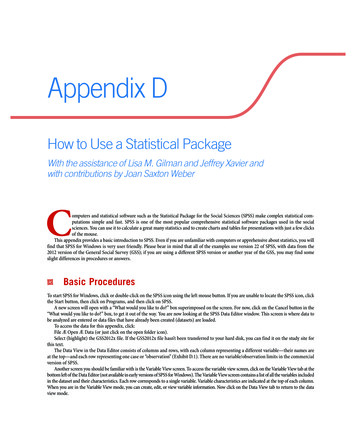
2.1General statistics of serious accidentsand total ship lossesTotal loss analysis is performed by Guedes Soaresand Teixeira (2001) for the purpose of Formal SafetyAssessment (FSA). They considered the operationalfleet at risk, covering all ships larger than 100 grosstons, except fishing vessels. The fleet at risk has beensteadily increasing although from 1978 to 1986 thetendency has slowed. The total loss rates per ship yearwere calculated by dividing the total yearly number ofaccidents by the number of ships operational in thatyear (annual fleet at risk). An evident decreasing trendof the ship losses rate is found.The number of total annual losses of all ships forperiod 1997–2013 are published in two independentstudies performed by Southampton Solent University (Butt et al., 2013) and Allianz Insurance (AllianzGlobal Corporate & Specialty) (AGCS, 2014).Number of the total vessel losses for the period1997–2011 is nearly constant according to Butt et al.(2013). On the other hand, the AGCS (2014) analysisshows firstly constant trend followed by significantdecrease. Comparing the values of these two statistics for the overlapping period 2002–2011, the AGCSstatistic presents higher total loss values from 2002to 2008, while much lower annual number of lossesbetween 2009 and 2013.Accident data extracted from the InformationHandling Services (IHS) Seaweb database and operational fleet at risk calculated from the Lloyd’s Registerof Shipping database, for ships of different typesbuilt after 1980, regardless ship size, are presentedby Papanikolaou et al. (2015). In total, 10841 seriousaccidents were considered for the period 1990–2012,among which 960 total losses. Total number of shipsin fleet at risk for that period reads 602998. Fromthat, one may calculate average annual accident frequency of 1.8E–02, while average annual frequencyof total losses reads 1.6E–03. Concerning large oiltankers, average annual frequency of serious accidentsin period 2000–2012 reads 1.28E–02. Total losses oflarge crude oil tankers are so rare, that average annualfrequency of their total losses is equal to zero.One interesting conclusion by Papanikolaou et al.(2015) is that frequency of accidents has increased formost ship types for period 2000–2012 compared to1990–2012 .The increase was explained by growth ofthe traffic intensity in some areas in the case of navigational accidents and by improving of the practice ofaccident recording in the last decade.Annual frequencies of total losses by GuedesSoares & Teixeira (2001), Butt et al. (2013) and AGCS(2014) are presented together in Figure 2, for thecomparative purpose.2.2 Accident statistics considering the type ofaccidentComparison of the relative values of ship losses foreach accident category in relation to the total numberof losses is presented in Figure 3. It appears thatFigure 2. Comparison of frequencies of total losses (blue –Guedes Soares & Teixeira, 2001; green – Butt et al., 2013;red – AGCS, 2014).Figure 3. Percent of total losses by accident category fordifferent periods (blue – Papanikolaou et al., 2015; green –Butt et al., 2013; red – AGCS, 2014).percent of losses due to foundering is very high, i.e.between 40% and 50% of losses. Foundering is definedas sinking due to rough weather, leaks or breaking intwo. The next most important accident is stranding,followed by collision and fire/explosion.Comparison of the numbers of large and mediumoil tanker accidents by accident categories is given byPapanikolaou and Eliopoulou (2008) and Eliopoulouet al. (2010). The highest percentage are collisionaccidents (33% of all accidents), while grounding accidents are on the second place (24% and 28% forlarge and medium oil tankers respectively). Contactaccidents, which are often considered together withcollision, represent 11% and 16% of all accidents forlarge and medium oil tankers respectively.Obviously, the level of susceptibility of certainship type relating kind of casualty is different. Theanalysis of initial events preceding total loss is performed for tankers, bulk carriers and containershipsin the period 1983–1993 (Guedes Soares and Teixeira2001). The most important initial cause of accidents was fire/explosion for tankers while grounding,fire/explosion and hull problems for bulk carriers.810
Table 1. Percent of total losses by common ship types(Papanikolaou et al., 2015; Butt et al., 2013; AGCS, 2014).2.5 Accident statistics considering the degree ofaccident severityShip type1990–20121997–20112002–2013General CargoBulk e degree of accident severity can be expressed interms of loss of lives/injuries, environmental pollutionand loss of property.Overview of the number of lives/injuries by shiptype is shown by Papanikolaou et al. (2015). Number ofrecorded fatalities (i.e. sum of “killed” and “missing”persons) per ship type, shows that about 64% is relatingthe ships carrying a relative large number of personson board.The main parameters of environmental pollutionusually used for evaluation of the risk are number of oilspills, volume of oil spilt and the spill rates in tonnesper ship-year. The spills are generally categorised bysize, i.e. 7 tonnes, 7–700 tonnes and 700 tonnes. Itis interesting to mention that, according to IMO FSA(2008), tanker accidents participate with only 4.7% inthe entire pollution quantity.According to International Tanker Owners Pollution Federation (ITOPF) database of oil spills fromtankers, combined carriers and barges, excluding thoseresulting from acts of war, approximately 5.74 million tonnes of oil were lost in the period 1970–2014(ITOPF, 2015). The same reference shows that thenumber of oil spills and volume of oil spilt aresignificantly reduced through the decades.Eliopoulou et al. (2013) compared the amount ofoil spilt in the case of medium and large oil tankersin the period 1990–2009. They concluded that accidental LOWIs of large ships result in the more severeenvironmental pollution for all types of damages. Pollution caused by medium-size tankers was primarilyattributed to the accidents of the oil tanker Thanassisin 1994 and Erika in 1999, while the consequencesof the accident of large-size tanker Prestige in 2002,resulted in stricter controls of tanker operations andthe accelerated phase-out of single-hull tankers fromEuropean waters.2.3 Accident statistics considering the ship typeComparison of percentages of total losses by ship typespublished by three different authors is given in Table1. The highest percent belongs to general cargo shiptype and it amounts around 40–50% of total losses.As general cargo ships can carry a multitude cargo,they are often operating short sea shipping routes andnavigating in congested coastal areas with the higherrisk of being damaged by submerged reefs and rocks.Samuelides et al. (2009) have analyzed probabilityof occurrence of grounding, based on a database ofaccidents involving Greek ships from 1992 to 2005.The calculated yearly grounding probabilities for different ship types in the period 1995–2005 are asfollows: Cargo – 1.43E–02, Tankers – 6.94E–03, Passenger and other ship types – 8.33E–03. These valuesare slightly reduced for period 2001–2005, except thatfor tankers this value is reduced by factor of two.2.4Influence of the regulation on the accidentstatisticsMajority of the present databases, statistic analysis andprojects relate to tankers, as the biggest environmental pollutants if we consider all ship types. As theresult of the attention given to the tragic accidentsinvolving tankers over the last decades, the influenceof the regulations development and enhancement canbe qualified as very positive. Navigational accidentrates for Aframax tankers are shown with accent onregulation influence over the period 1978–2003 byEliopoulou and Papanikolaou (2007) and IMO (2008).The effect of the regulations is noticeable with somephase-lag in relation to the years of their implementation. Papanikolaou and Eliopoulou (2008) presenteddecrease of the accident rate by the main accident categories (LOWI) for all tanker types over the period1980–2007.There was a significant reduction of accidentsoccurrence in the post-90 period due to the introduction of a series of regulations (with the mostprominent one being OPA 90) on the prevention andmitigation of accidents. Eliopoulou and Papanikolaou(2007) showed, taking into account accidents with serious consequences only, including ship total losses, aconsiderable reduction of accident frequencies in thepost-1990 period. Thus, for all types of tankers, frequency of serious accidents or total losses was reducedfrom about 2.0E–02 to about 8.0E–03 for pre-1990 andpost-1990 period respectively.2.6 Accident statistics considering ship designAs a consequence of catastrophic accident of ExxonValdez in 1989, only one year later the new doublehull (DH) concept was introduced by adoption of thefirst major regional agreement OPA 90 (Eliopoulouet al. 2013) . This document had a significant influenceon regulatory developments in the post-1990 period,resulting in the significant decrease of the frequencyof tanker accidents.Considering the spillage into the sea as ship accident consequence, in relation to ship’s basic design,it is obviously highly dependent for all types ofaccidents, because the DH concept gives a lowernon-pollution probability for accidents with smallhull penetrations in the cargo area (Papanikolaou andEliopoulou 2008).Furthermore, the analysis of the relationshipbetween the accident frequency as the risk parameterand ship’s design, shows that only in the cases of NASF,it may differ significantly depending on the hull type,811
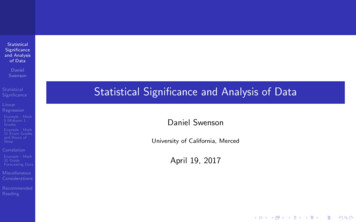
because only this accident category is highly relatedto the ship’s internal structure.In year 2006, Common Structural Rules (CSR)for Tankers are adopted as the consequence of structural defects statistics presented in ABS et al. (2005).Damage statistics for double hull tankers was performed by Classification Societies based upon theirdamage database records for all tankers of 150 m inlength or greater. By relating the number of ships withsome structural defects to number of ships in class,the following percents are obtained: Product – 8%,Panamax – 13%, Aframax – 18%, Suezmax – 26%,VLCC – 21%. Altogether 15% of the ships in thefleet had some type of structural damage. The consequences, in term of damage statistics, of applicationof CSR are still not known, but it will be interesting tosee such data in the future years.2.7 Accident statistics considering the age of shipsAnalysis performed for large oil tankers accidentsfrom the period 1990–2007 is presented by Papanikolaou and Eliopoulou (2008). They concluded thatthe frequency of navigational accidents increases forships of 15 years and older. But the highest frequencies of accidents have young ships, within first 5 yearsof their lifetime. According to authors of that study,high accident frequencies of young ships are related tocrew’s proper training, communication problems andto crew’s ability to handle new technology equipment.In the case of fire and explosion, higher frequenciesare calculated for higher ship ages independently of thehull type.Considering NASF and ship’s age of all large oiltankers, it is concluded that frequency of accidentssteadily increases after the ships reach the age of10 years. A peak for Aframax and Suezmax tankersis noticed at the age group 11–15, which might beattributed to insufficient maintenance of the ship’shull structure when approaching her assumed designeconomic life of about 20 years. Surprisingly, youngships of age up to 5 years, show remarkable structuralfailure rate for all large tanker subtypes, except forVLCC/ULCC. Additionally, it would be important tomention, that for period 1990–2007, all the DH shipsinvolved in accidents during bad weather conditionswere at the group age up to 5 years, too early for themaintenance problems.As the part of the tanker defects statistics presentedin ABS et al. (2005), the distribution of defects over theships life for each ship size category is given. It seemsimportant to notice that almost 37% of the tankers withdefects were 5 to 9 years old, while in more than 80%cases, defects have been recorded on ships youngerthan 15 year.According to statistic for period 1997–2006, presented by ISSC (2009) Committee for ConditionAssessment of Aged Ships and Offshore Structures,non-accidental hull damage ranks the top five causesleading to total vessel loss for vessels greater than 500GT, with the increasing trend during the last four years2002–2006. In that report, statistical analysis of totallosses for tankers and bulk carriers shows the increasing trend of vessel losses related to the age of thevessels, although the previous ISSC reports mentionedthat the average age of vessels lost was only slightlymore than the average age of the existing fleet.2.8 Accident statistics considering the adverseweather conditionsDatabase compilation and statistical analysis of marineaccidents in heavy weather conditions for differentship types and period 1990–2013 are presented byVentikos et al. (2015). 239 accidents were analyzed.It was found that number of accidents involvingRo-Ro ships (24% of accidents) is relatively muchhigher comparing to the number of Fleet at Risk forthese ships (8%).Also, there are significantly less Container ships accidents (4%) comparing to Fleet at Risknumber (12%).Considering type of accident and location, it wasfound that the highest percents belong to accidentsdue to grounding and accidents which took place in theports. Most accidents that happened in the port involveRo-Ro Ferries (19%), General Cargo Ships (14%) andBulk Carriers (10%). High frequency of accidents forGeneral Cargo Ships is explained by trading routeswith frequent port calls, while for Ro-Ro Ferries highwind profile area is the most influencing factor in thehampering the ship under adverse weather conditions.Ventikos et al. (2015) reported also increasing trendin number of accidents up to 2007, which is mostlycaused by greater number of ships that were in serviceduring that period, i.e. increase of demand for cargoesfor China’s infrastructure development influenced theincrease of 230% for Bulk Carrier Fleet at Risk and40% for General Cargo Fleet at Risk in the period2001–2010.2.9 Accident statistics considering the geographicareaRegarding the geographic areas in which accidentshave occurred, the IHS Sea-web database uses the “SISzones” topological system, according to which, thesurface on earth has been divided into 31 zones i.e. themajor areas of interest. 18 geographic areas with morefrequent accidents are identified and signed according to SIS zones system: South China, Indo China,Indonesia and Philippines (12); East Mediterraneanand Black Sea (4); Japan, Korea and North China(13); British Isles, North Sea, Eng. Channel and Bayof Biscay (1); Arabian Gulf and approaches (8); WestAfrican Coast (19); (West Mediterranean (5); WestIndies (23); EastAfrican Coast (9); Bay of Bengal (11);Canadian Arctic and Alaska (27); Baltic (2); GreatLakes (26); Gulf of Mexico (25); North AmericanWest Coast (21); Iceland and Northern Norway (29);Newfoundland (28); U.S. Eastern Sea Board (24).The comparative statistics of different authors forthese areas is presented in Figure 4. From Figure 21 itcan be concluded that areas 1, 12, 13 and 4 are the most812
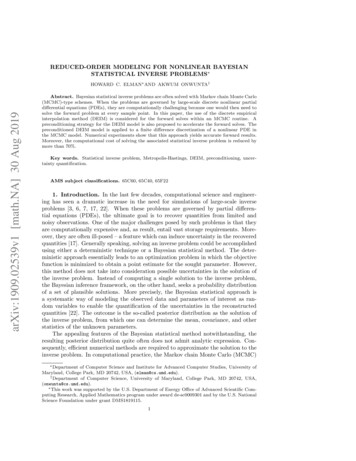
Table 3. Annual accident probabilities of oil tankers usedin structural reliability studiesFigure 4. Percents of total losses by geographical regionsfor periods 1999–2011 and 2002–2013 (blue – Papanikolaouet al., 2015; green – Butt et al., 2013; red – AGCS, 2014).Table 2. Average incident rates per shipyears and probability of LOWI for Aframax tankers (1990–2003) (Downeset al., 2007).Incident typeAverage rate% of LOWIStructural –0329.816.723.818.61.0012.8accidentally risky area. Percentages of total losses inFigure 4 represent the number of total losses for certaingeographical area in relation to number of all totallosses.2.10Importance of accident statistics for shipstructural risk and reliability analysisThe accident scenarios define possible situations, realistic as closely as possible regarding the risk to the shipand/or environment. As some incidents have majorimplications to the ship and/or environment, whereasothers with less severe consequences occur much morefrequently, the probability of occurrence should betaken into account. One of the approaches typicallyused for deriving the accident scenarios and theirassociated probability of occurrence is statistics fromhistorical data.Scenarios identification and accident probabilitycalculation is undertaken for Aframax Tanker byDownes et al. (2007). If the structural failure analysesassume rupture of hull structure, then the incident ratesof initial event need to be adjusted for the probabilityof loss of watertight integrity (Table 2).The annual probability of hull girder’s failurecaused by grounding of oil tanker is evaluated byPrestileo et al. (2013). They calculated the probabilities of hull girder’s failure conditional to the bottomdamage. Annual frequency of tanker accidents is takenRef.CollisionGroundingDownes et al. (2007)Prestileo et al. (2013)IACS E–037.45E–03for year 2007, which, in the case of grounding andcollision, reads 4.64E–03 and 6.52E–03, respectively.The accuracy of the probabilistic model is evaluatedby comparing calculated ultimate failure probabilitywith a prediction of ship losses based on statistics provided by International Organization of Oil and GasProducers (OGP). According to that source, the totalloss frequency for oil tankers per ship year is 1.90E–03.According to the report from the Committee V.1(Accidental Limit State) within ISSC 2015, the annualprobability of accident event extracted from the casualty statistics of tankers is taken as 7.45E–03 and1.03E–02 for grounding or collision, respectively.ISSC report originates from the IACS backgrounddocument used in development of Harmonized Common Structural Rules (IACS, 2014). Both documentsare consistent to IMO (2008).These results are summarized in Table 3, showingannual probability of collision and grounding accidents for oil tankers, assumed by different researchersin structural reliability studies of damaged ships. Itshould be mentioned that Downes et al. (2007) considered contact and collision together and that theirvalues in Table 2 include also probability of LOWI.Compared Table 3 to the presented survey of literature dealing with the statistics of ship accidents,it may be concluded that frequency of collision accidents for oil tankers is consistently higher comparedto frequency of grounding accidents (section 2.2).Annual grounding probability of 6.94E–03 fortankers presented by Samuelides et al. (2009), alsoseems to be consistent with last two rows in Table 3.According to the recent analysis by Papanikolaou et al.,(2015), frequency of serious accidents of oil tankers inperiod 2000–2012 reads 1.28E–02. About 45% of allaccidents belongs to collision and contact, resulting inthe collision accident probability of 5.76E–03. About26% of accidents are grounding accidents, resultingin grounding probability of 3.3E–03. Compared to theTable 3, it seems that annual accident probabilities usedby Prestileo et al. (2013) are in the relatively goodagreement with these values.Total losses of large oil tankers are rare events, andempirical frequencies to be used in structural reliability studies are rather uncertain. The assumed totalloss frequency for oil tankers per ship year of 1.90E–03 (Prestileo et al., 2013) seems to be consistent toaverage annual frequency of total losses of 1.60E–03of all ship types (Papanikolaou et al., 2015). Annualfrequency of serious accidents or total losses of oiltankers after 1990 of about 8.0E–03 (Eliopoulou and813
Papanikolaou, 2007) is higher than previous values asit includes serious accidents in addition to the totallosses.3CONCLUSIONSRecent references dealing with statistics of ship accidents are reviewed. It was found that statistics ofaccidents are highly dependent on the new maritimeregulations and changes in ship design. The mostimportant design modification is the introduction ofthe double hull concept for oil tankers in 1990. Consequently, a significant decrease of the frequency oftanker accidents causing pollution is evident in thepost-1990 period. Therefore, usage of older statisticaldata not incorporating these important changes is notrecommended.Another difficulty lies in a fact that newregulations are visible with some phase-lag in relationto the years of their implementation. Therefore, eventhe recent statistical data could be unreliable if theinfluence of new structural rules or new navigationalequipment (such as Automatic Identification System,AIS) is not included.According to statistics, the accident frequencies forthe last decade have been increased in general, whatis attributed to improved accidents recording practiceand traffic increase in some areas. However, the frequency of total losses is decreasing, in particular foroil tankers. It is interesting to mention that young DHtankers show unexpectedly high frequency of NASFproblems.The highest accident rates by ship type are presentedfor General Cargo, Bulk Carriers, Passenger and Fishing vessels, respectively, what is mostly attributed toship routes and certain features of the ship type i.e. thelarge windage area of the passenger ships.Casualty databases provide important informationfor the structural reliability assessment of damagedships. However, as may be seen in Table 3, there arestill considerable uncertainties in definition of annualprobabilities of oil tanker accidents. Uncertainties arenot caused by wrong data, but because of high sensitivity of the accidental frequencies to the period ofinvestigation, i.e. if annual accident frequency is calculated for one particular year or as an average valuefor several years. Also, differences could appear if different sub-types of ships are considered together orseparately.ACKNOWLEDGEMENTSThis work has been fully supported by CroatianScience Foundation under the project 8658.REFERENCESABS, DNV, LLR, 2005. Common Structural Rules forDouble-hull Oil Tankers. Structural Defect Experience,August 2005.Allianz Global Corporate & Specialty. 2014. An annualreview of trends and developments in shipping losses andsafety. www.agcs.allianz.comButt, N., Johnson, D., Pike, K., Pryce-Roberts, N. and Vigar,N. 2013. 15 years of shipping accidents: A review forWWF. Southampton Solent University.Downes, J., Moore, C., Incecik, A., Stumpf, E. andMcGregor J. 2007. A Method for the quantitative Assessment of Performance of Alternative Designs in theAccidental Condition, 10th International Symposium onPractical Design of Ships and Other Floating Structures,Houston, Texas.Eliopoulou, E. and Papanikolaou, A. 2007. Casualty analysis of large tankers. Journal of Maritime Science andTechnology 12, pp. 240–250.Eliopoulou, E., Diamantis, P. and Papanikolaou, A. 2010.Casualties of Medium Size Tankers. 3rd Int. Symposiumon Ship Operations, Management and Economics,Athens,The Greek Section of the SNAME.Eliopoulou, E., Papanikolaou, A., Diamantis, P. and Hamann,R. 2012. Analysis of tanker casualties after the Oil Pollution Act (USA, 1990). Journal of Enginnering for theMaritime Environment, 226(4), pp. 301–312.Guedes Soares, C. and Teixeira, A.P. 2001. Risk assessmentin maritime transportation. Reliability Engineering andSystem Safety 74, pp. 299–309.IACS, 2014. Common Structural Rules for Bulk Carriers andOil Tankers. International Association of ClassificationSocieties, TB report no. Pt 1, Ch 5, Sec 3.IMO, 2008. Formal Safety Assessment (FSA) – Crude OilTankers, MEPC 58/INF.2.ISSC, 2009. Committee V.6. Condition Assessment of AgedShips and Offshore Structures, Volume 2. 17th International Ship and Offshore Structures Congress. Seoul,Korea, Jang and Hong (Eds), pp. 309–365.ISSC, 2015. Committee V.1. Accidental limit states (ALS),Volume 2. 19th International Ship and Offshore Structures Congress. Guedes Soares & Garbatov (Eds). Taylor& Francis Group, London. pp. 519–590.ITOPF, 2015. Oil tanker spill statistics. International TankerOwners Pollution Federation Limited. www.itopf.comPapanikolaou, A., Eliopoulou, E., Alissafaki, A., Mikelis, N.,Aksu, S. and Delautre, S. 2007. Casualty analysis of Aframax tankers. Proc. IMechE, Part M: J. Engineering for theMaritime Environment, 221(2), pp. 47–65.Papanikolaou, A. and Eliopoulou, E. 2008. Impact of ship ageon tanker accidents. 2nd Int. Symposium on Ship Operations, Management and Economics, Athens, The GreekSection of the SNAME.Papanikolaou, A., Bitha, K. and Eliopoulou, E. 2015. Statistical analysis of ship accidents that occurres in theperiod 1990–2012 and assessment of safety level of shiptypes. Maritime Technology and Engineering – GuedesSoares & Santos (Eds). Taylor & Francis Group, London.pp. 227–233.Prestileo, A., Rizzuto, E., Teixeira, A.P. and Guedes Soares,C. 2013. Bottom damage scenarios of the hull girderstructural assessment, Marine Structures 33, pp. 33–55.Samuelides, M. S., Ventikos, N. P. and Gemelos, I. C. 2009.Survey on grounding incidents: Statistical analysis andrisk assessment, Ships and Offshore Structures, 4(1),pp. 55–68.UK P and I Club Reports. 1987–1997. www.ukpandi.comVentikos, N.P., Koimtzoglou, A. and Louzis, K. 2015. Statistics for marine accidents in adverse weather conditions. Maritime Technology and Engineering – GuedesSoares &
sity (Butt et al., 2013) and Allianz Insurance (Allianz Global Corporate & Specialty) (AGCS, 2014). Number of the total vessel losses for the period 1997-2011 is nearly constant according to Butt et al. (2013). On the other hand, the AGCS (2014) analysis shows firstly constant trend followed by significant decrease.