Transcription
iIBM SPSS Data Preparation 20
Note: Before using this information and the product it supports, read the general informationunder Notices on p. 143.This edition applies to IBM SPSS Statistics 20 and to all subsequent releases and modificationsuntil otherwise indicated in new editions.Adobe product screenshot(s) reprinted with permission from Adobe Systems Incorporated.Microsoft product screenshot(s) reprinted with permission from Microsoft Corporation.Licensed Materials - Property of IBM Copyright IBM Corporation 1989, 2011.U.S. Government Users Restricted Rights - Use, duplication or disclosure restricted by GSA ADPSchedule Contract with IBM Corp.
PrefaceIBM SPSS Statistics is a comprehensive system for analyzing data. The Data Preparationoptional add-on module provides the additional analytic techniques described in this manual.The Data Preparation add-on module must be used with the SPSS Statistics Core system and iscompletely integrated into that system.About IBM Business AnalyticsIBM Business Analytics software delivers complete, consistent and accurate information thatdecision-makers trust to improve business performance. A comprehensive portfolio of businessintelligence, predictive analytics, financial performance and strategy management, and analyticapplications provides clear, immediate and actionable insights into current performance and theability to predict future outcomes. Combined with rich industry solutions, proven practices andprofessional services, organizations of every size can drive the highest productivity, confidentlyautomate decisions and deliver better results.As part of this portfolio, IBM SPSS Predictive Analytics software helps organizations predictfuture events and proactively act upon that insight to drive better business outcomes. Commercial,government and academic customers worldwide rely on IBM SPSS technology as a competitiveadvantage in attracting, retaining and growing customers, while reducing fraud and mitigatingrisk. By incorporating IBM SPSS software into their daily operations, organizations becomepredictive enterprises – able to direct and automate decisions to meet business goals and achievemeasurable competitive advantage. For further information or to reach a representative visithttp://www.ibm.com/spss.Technical supportTechnical support is available to maintenance customers. Customers may contact TechnicalSupport for assistance in using IBM Corp. products or for installation help for one of thesupported hardware environments. To reach Technical Support, see the IBM Corp. web siteat http://www.ibm.com/support. Be prepared to identify yourself, your organization, and yoursupport agreement when requesting assistance.Technical Support for StudentsIf you’re a student using a student, academic or grad pack version of any IBMSPSS software product, please see our special online Solutions for Education(http://www.ibm.com/spss/rd/students/) pages for students. If you’re a student using auniversity-supplied copy of the IBM SPSS software, please contact the IBM SPSS productcoordinator at your university.Customer ServiceIf you have any questions concerning your shipment or account, contact your local office. Pleasehave your serial number ready for identification. Copyright IBM Corporation 1989, 2011.iii
Training SeminarsIBM Corp. provides both public and onsite training seminars. All seminars feature hands-onworkshops. Seminars will be offered in major cities on a regular basis. For more information onthese seminars, go to g.Additional PublicationsThe SPSS Statistics: Guide to Data Analysis, SPSS Statistics: Statistical Procedures Companion,and SPSS Statistics: Advanced Statistical Procedures Companion, written by Marija Norušis andpublished by Prentice Hall, are available as suggested supplemental material. These publicationscover statistical procedures in the SPSS Statistics Base module, Advanced Statistics moduleand Regression module. Whether you are just getting starting in data analysis or are ready foradvanced applications, these books will help you make best use of the capabilities found withinthe IBM SPSS Statistics offering. For additional information including publication contentsand sample chapters, please see the author’s website: http://www.norusis.comiv
ContentsPart I: User’s Guide1Introduction to Data Preparation1Usage of Data Preparation Procedures. . . . . . . . . . . . . . . . . . . . . . . . . . . . . . . . . . . . . . . . . . . . . 12Validation Rules2Load Predefined Validation Rules . . . . . . . . . . . . . . . . . . . . . . . . . . . . . . . . . . . . . . . . . . . . . . . . . 2Define Validation Rules . . . . . . . . . . . . . . . . . . . . . . . . . . . . . . . . . . . . . . . . . . . . . . . . . . . . . . . . . 3Define Single-Variable Rules . . . . . . . . . . . . . . . . . . . . . . . . . . . . . . . . . . . . . . . . . . . . . . . . . 3Define Cross-Variable Rules . . . . . . . . . . . . . . . . . . . . . . . . . . . . . . . . . . . . . . . . . . . . . . . . . 638Validate DataValidate Data Basic Checks . . . . . . . . . . . . . . . . . . . . . . . . . . . . . . . . . . . . . . . . . . . . . . . . . . . . . 11Validate Data Single-Variable Rules . . . . . . . . . . . . . . . . . . . . . . . . . . . . . . . . . . . . . . . . . . . . . . . 13Validate Data Cross-Variable Rules . . . . . . . . . . . . . . . . . . . . . . . . . . . . . . . . . . . . . . . . . . . . . . . 14Validate Data Output . . . . . . . . . . . . . . . . . . . . . . . . . . . . . . . . . . . . . . . . . . . . . . . . . . . . . . . . . . 15Validate Data Save . . . . . . . . . . . . . . . . . . . . . . . . . . . . . . . . . . . . . . . . . . . . . . . . . . . . . . . . . . . 164Automated Data Preparation18To Obtain Automatic Data Preparation . . . . . . . . . . . . . . . . . . . . . . . . . . . . . . . . . . . . . . . . . . . . . 19To Obtain Interactive Data Preparation . . . . . . . . . . . . . . . . . . . . . . . . . . . . . . . . . . . . . . . . . . . . . 20Fields Tab . . . . . . . . . . . . . . . . . . . . . . . . . . . . . . . . . . . . . . . . . . . . . . . . . . . . . . . . . . . . . . . . . . 21Settings Tab . . . . . . . . . . . . . . . . . . . . . . . . . . . . . . . . . . . . . . . . . . . . . . . . . . . . . . . . . . . . . . . . . 21Prepare Dates & Times . . . . . . . . . . .Exclude Fields . . . . . . . . . . . . . . . . . .Adjust Measurement . . . . . . . . . . . .Improve Data Quality . . . . . . . . . . . .Rescale Fields . . . . . . . . . . . . . . . . .Transform Fields . . . . . . . . . . . . . . . .Select and Construct . . . . . . . . . . . .Field Names. . . . . . . . . . . . . . . . . . . .Applying and Saving Transformations.v.222324252627282930
Analysis Tab . . . . . . . . . . . . . . . . . . . . . . . . . . . . . . . . . . . . . . . . . . . . . . . . . . . . . . . . . . . . . . . . 31Field Processing Summary . .Fields . . . . . . . . . . . . . . . . . .Action Summary . . . . . . . . . .Predictive Power . . . . . . . . .Fields Table . . . . . . . . . . . . . .Field Details . . . . . . . . . . . . .Action Details . . . . . . . . . . . .Backtransform Scores . . . . . . . . .5.Identify Unusual Cases.333436373839414445Identify Unusual Cases Output . . . . . . . . . . . . . . . . . . . . . . . . . . . . . . . . . . . . . . . . . . . . . . . . . . . 48Identify Unusual Cases Save. . . . . . . . . . . . . . . . . . . . . . . . . . . . . . . . . . . . . . . . . . . . . . . . . . . . . 49Identify Unusual Cases Missing Values . . . . . . . . . . . . . . . . . . . . . . . . . . . . . . . . . . . . . . . . . . . . . 50Identify Unusual Cases Options. . . . . . . . . . . . . . . . . . . . . . . . . . . . . . . . . . . . . . . . . . . . . . . . . . . 51DETECTANOMALY Command Additional Features . . . . . . . . . . . . . . . . . . . . . . . . . . . . . . . . . . . . . 526Optimal Binning53Optimal Binning Output . . . . . . . . . . . . . . . . . . . . . . . . . . . . . . . . . . . . . . . . . . . . . . . . . . . . . . . . . 55Optimal Binning Save . . . . . . . . . . . . . . . . . . . . . . . . . . . . . . . . . . . . . . . . . . . . . . . . . . . . . . . . . . 56Optimal Binning Missing Values . . . . . . . . . . . . . . . . . . . . . . . . . . . . . . . . . . . . . . . . . . . . . . . . . . 57Optimal Binning Options . . . . . . . . . . . . . . . . . . . . . . . . . . . . . . . . . . . . . . . . . . . . . . . . . . . . . . . . 58OPTIMAL BINNING Command Additional Features . . . . . . . . . . . . . . . . . . . . . . . . . . . . . . . . . . . . 59Part II: Examples7Validate Data61Validating a Medical Database . . . . . . . . . . . . . . . . . . . . . . . . . . . . . . . . . . . . . . . . . . . . . . . . . . . 61Performing Basic Checks. . . . . . . . . . . . . . . .Copying and Using Rules from Another File . .Defining Your Own Rules . . . . . . . . . . . . . . . .Cross-Variable Rules . . . . . . . . . . . . . . . . . . .vi.61647480
Case Report. . . . . . . . . . . . . . . . . . . . . . . . . . . . . . . . . . . . . . . . . . . . . . . . . . . . . . . . . . . . . . 81Summary . . . . . . . . . . . . . . . . . . . . . . . . . . . . . . . . . . . . . . . . . . . . . . . . . . . . . . . . . . . . . . . . 81Related Procedures . . . . . . . . . . . . . . . . . . . . . . . . . . . . . . . . . . . . . . . . . . . . . . . . . . . . . . . . . . . 828Automated Data Preparation83Using Automated Data Preparation Interactively. . . . . . . . . . . . . . . . . . . . . . . . . . . . . . . . . . . . . . 83Choosing Between Objectives . . . . . . . . . . . . . . . . . . . . . . . . . . . . . . . . . . . . . . . . . . . . . . . . 83Fields and Field Details . . . . . . . . . . . . . . . . . . . . . . . . . . . . . . . . . . . . . . . . . . . . . . . . . . . . . 91Using Automated Data Preparation Automatically. . . . . . . . . . . . . . . . . . . . . . . . . . . . . . . . . . . . . 94Preparing the Data . . . . . . . . . . . . . . . . . . . .Building a Model on the Unprepared Data . . .Building a Model on the Prepared Data . . . . .Comparing the Predicted Values . . . . . . . . . .Backtransforming the Predicted Values . . . . .Summary . . . . . . . . . . . . . . . . . . . . . . . . . . . .9.Identify Unusual Cases. . . 94. . . 97. . 100. . 101. . 103. . 105106Identify Unusual Cases Algorithm . . . . . . . . . . . . . . . . . . . . . . . . . . . . . . . . . . . . . . . . . . . . . . . . 106Identifying Unusual Cases in a Medical Database . . . . . . . . . . . . . . . . . . . . . . . . . . . . . . . . . . . . 106Running the Analysis . . . . . . . . . . . . . . . . . . . . . .Case Processing Summary . . . . . . . . . . . . . . . . .Anomaly Case Index List . . . . . . . . . . . . . . . . . . .Anomaly Case Peer ID List . . . . . . . . . . . . . . . . . .Anomaly Case Reason List . . . . . . . . . . . . . . . . . .Scale Variable Norms . . . . . . . . . . . . . . . . . . . . .Categorical Variable Norms . . . . . . . . . . . . . . . . .Anomaly Index Summary . . . . . . . . . . . . . . . . . . .Reason Summary. . . . . . . . . . . . . . . . . . . . . . . . .Scatterplot of Anomaly Index by Variable Impact .Summary . . . . . . . . . . . . . . . . . . . . . . . . . . . . . . .Related Procedures . . . . . . . . . . . . . . . . . . . . . . . . . .10711111211311411511611711811812012112210 Optimal BinningThe Optimal Binning Algorithm . . . . . . . . . . . . . . . . . . . . . . . . . . . . . . . . . . . . . . . . . . . . . . . . . . 122vii
Using Optimal Binning to Discretize Loan Applicant Data . . . . . . . . . . . . . . . . . . . . . . . . . . . . . . 122Running the Analysis . . . . . . . . . .Descriptive Statistics. . . . . . . . . .Model Entropy . . . . . . . . . . . . . . .Binning Summaries . . . . . . . . . . .Binned Variables . . . . . . . . . . . . .Applying Syntax Binning Rules. . .Summary . . . . . . . . . . . . . . . . . . .122126127127131131133AppendicesA Sample Files134B Notices143Bibliography146Index147viii
Part I:User’s Guide
ChapterIntroduction to Data Preparation1As computing systems increase in power, appetites for information grow proportionately, leadingto more and more data collection—more cases, more variables, and more data entry errors.These errors are the bane of the predictive model forecasts that are the ultimate goal of datawarehousing, so you need to keep the data “clean.” However, the amount of data warehousedhas grown so far beyond the ability to verify the cases manually that it is vital to implementautomated processes for validating data.The Data Preparation add-on module allows you to identify unusual cases and invalid cases,variables, and data values in your active dataset, and prepare data for modeling.Usage of Data Preparation ProceduresYour usage of Data Preparation procedures depends on your particular needs. A typical route,after loading your data, is: Metadata preparation. Review the variables in your data file and determine their valid values,labels, and measurement levels. Identify combinations of variable values that are impossiblebut commonly miscoded. Define validation rules based on this information. This can be atime-consuming task, but it is well worth the effort if you need to validate data files withsimilar attributes on a regular basis. Data validation. Run basic checks and checks against defined validation rules to identifyinvalid cases, variables, and data values. When invalid data are found, investigate and correctthe cause. This may require another step through metadata preparation. Model preparation. Use automated data preparation to obtain transformations of the originalfields that will improve model building. Identify potential statistical outliers that can causeproblems for many predictive models. Some outliers are the result of invalid variable valuesthat have not been identified. This may require another step through metadata preparation.Once your data file is “clean,” you are ready to build models from other add-on modules. Copyright IBM Corporation 1989, 2011.1
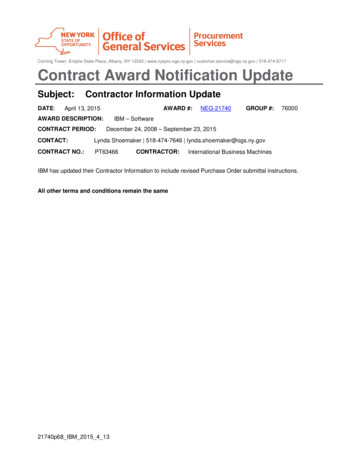
Chapter2Validation RulesA rule is used to determine whether a case is valid. There are two types of validation rules: Single-variable rules. Single-variable rules consist of a fixed set of checks that apply to asingle variable, such as checks for out-of-range values. For single-variable rules, valid valuescan be expressed as a range of values or a list of acceptable values. Cross-variable rules. Cross-variable rules are user-defined rules that can be applied to asingle variable or a combination of variables. Cross-variable rules are defined by a logicalexpression that flags invalid values.Validation rules are saved to the data dictionary of your data file. This allows you to specify arule once and then reuse it.Load Predefined Validation RulesYou can quickly obtain a set of ready-to-use validation rules by loading predefined rules from anexternal data file included in the installation.To Load Predefined Validation RulesE From the menus choose:Data Validation Load Predefined Rules.Figure 2-1Load Predefined Validation RulesNote that this process deletes any existing single-variable rules in the active dataset.Alternatively, you can use the Copy Data Properties Wizard to load rules from any data file. Copyright IBM Corporation 1989, 2011.2
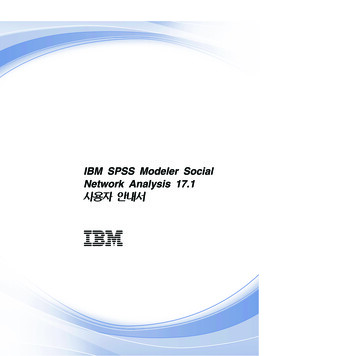
3Validation RulesDefine Validation RulesThe Define Validation Rules dialog box allows you to create and view single-variable andcross-variable validation rules.To Create and View Validation RulesE From the menus choose:Data Validation Define Rules.The dialog box is populated with single-variable and cross-variable validation rules read fromthe data dictionary. When there are no rules, a new placeholder rule that you can modify tosuit your purposes is created automatically.E Select individual rules on the Single-Variable Rules and Cross-Variable Rules tabs to view andmodify their properties.Define Single-Variable RulesFigure 2-2Define Validation Rules dialog box, Single-Variable Rules tab
4Chapter 2The Single-Variable Rules tab allows you to create, view, and modify single-variable validationrules.Rules. The list shows single-variable validation rules by name and the type of variable to which therule can be applied. When the dialog box is opened, it shows rules defined in the data dictionaryor, if no rules are currently defined, a placeholder rule called “Single-Variable Rule 1.” Thefollowing buttons appear below the Rules list: New. Adds a new entry to the bottom of the Rules list. The rule is selected and assigned thename “SingleVarRule n,” where n is an integer so that the new rule’s name is unique amongsingle-variable and cross-variable rules. Duplicate. Adds a copy of the selected rule to the bottom of the Rules list. The rule name isadjusted so that it is unique among single-variable and cross-variable rules. For example,if you duplicate “SingleVarRule 1,” the name of the first duplicate rule would be “Copy ofSingleVarRule 1,” the second would be “Copy (2) of SingleVarRule 1,” and so on. Delete. Deletes the selected rule.Rule Definition. These controls allow you to view and set properties for a selected rule. Name. The name of the rule must be unique among single-variable and cross-variable rules. Type. This is the type of variable to which the rule can be applied. Select from Numeric,String, and Date. Format. This allows you to select the date format for rules that can be applied to date variables. Valid Values. You can specify the valid values either as a range or a list of values.Range definition controls allow you to specify a valid range. Values outside the range are flaggedas invalid.Figure 2-3Single-Variable Rules: Range DefinitionTo specify a range, enter the minimum or maximum values, or both. The check box controls allowyou to flag unlabeled and non-integer values within the range.List definition controls allow you to define a list of valid values. Values not included in thelist are flagged as invalid.
5Validation RulesFigure 2-4Single-Variable Rules: List DefinitionEnter list values in the grid. The check box determines whether case matters when string datavalues are checked against the list of acceptable values. Allow user-missing values. Controls whether user-missing values are flagged as invalid. Allow system-missing values. Controls whether system-missing values are flagged as invalid.This does not apply to string rule types. Allow blank values. Controls whether blank (that is, completely empty) string values areflagged as invalid. This does not apply to nonstring rule types.
6Chapter 2Define Cross-Variable RulesFigure 2-5Define Validation Rules dialog box, Cross-Variable Rules tabThe Cross-Variable Rules tab allows you to create, view, and modify cross-variable validationrules.Rules. The list shows cross-variable validation rules by name. When the dialog box is opened,it shows a placeholder rule called “CrossVarRule 1.” The following buttons appear below theRules list: New. Adds a new entry to the bottom of the Rules list. The rule is selected and assigned thename “CrossVarRule n,” where n is an integer so that the new rule’s name is unique amongsingle-variable and cross-variable rules. Duplicate. Adds a copy of the selected rule to the bottom of the Rules list. The rule name isadjusted so that it is unique among single-variable and cross-variable rules. For example,if you duplicate “CrossVarRule 1,” the name of the first duplicate rule would be “Copy ofCrossVarRule 1,” the second would be “Copy (2) of CrossVarRule 1,” and so on. Delete. Deletes the selected rule.Rule Definition. These controls allow you to view and set properties for a selected rule.
7Validation Rules Name. The name of the rule must be unique among single-variable and cross-variable rules. Logical Expression. This is, in essence, the rule definition. You should code the expressionso that invalid cases evaluate to 1.Building ExpressionsE To build an expression, either paste components into the Expression field or type directly inthe Expression field. You can paste functions or commonly used system variables by selecting a group from theFunction group list and double-clicking the function or variable in the Functions and SpecialVariables list (or select the function or variable and click Insert). Fill in any parametersindicated by question marks (applies only to functions). The function group labeled Allprovides a list of all available functions and system variables. A brief description of thecurrently selected function or variable is displayed in a reserved area in the dialog box. String constants must be enclosed in quotation marks or apostrophes. If values contain decimals, a period (.) must be used as the decimal indicator.
Chapter3Validate DataThe Validate Data dialog box allows you to identify suspicious and invalid cases, variables,and data values in the active dataset.Example. A data analyst must provide a monthly customer satisfaction report to her client.The data she receives every month needs to be quality checked for incomplete customer IDs,variable values that are out of range, and combinations of variable values that are commonlyentered in error. The Validate Data dialog box allows the analyst to specify the variables thatuniquely identify customers, define single-variable rules for the valid variable ranges, and definecross-variable rules to catch impossible combinations. The procedure returns a report of theproblem cases and variables. Moreover, the data has the same data elements each month, so theanalyst is able to apply the rules to the new data file next month.Statistics. The procedure produces lists of variables, cases, and data values that fail variouschecks, counts of violations of single-variable and cross-variable rules, and simple descriptivesummaries of analysis variables.Weights. The procedure ignores the weight variable specification and instead treats it as anyother analysis variable.To Validate DataE From the menus choose:Data Validation Validate Data. Copyright IBM Corporation 1989, 2011.8
9Validate DataFigure 3-1Validate Data dialog box, Variables tabE Select one or more analysis variables for validation by basic variable checks or by single-variablevalidation rules.Alternatively, you can:E Click the Cross-Variable Rules tab and apply one or more cross-variable rules.Optionally, you can: Select one or more case identification variables to check for duplicate or incomplete IDs. CaseID variables are also used to label casewise output. If two or more case ID variables arespecified, the combination of their values is treated as a case identifier.
10Chapter 3Fields with Unknown Measurement LevelThe Measurement Level alert is displayed when the measurement level for one or more variables(fields) in the dataset is unknown. Since measurement level affects the computation of results forthis procedure, all variables must have a defined measurement level.Figure 3-2Measurement level alert Scan Data. Reads the data in the active dataset and assigns default measurement level toany fields with a currently unknown measurement level. If the dataset is large, that maytake some time. Assign Manually. Opens a dialog that lists all fields with an unknown measurement level.You can use this dialog to assign measurement level to those fields. You can also assignmeasurement level in Variable View of the Data Editor.Since measurement level is important for this procedure, you cannot access the dialog to run thisprocedure until all fields have a defined measurement level.
11Validate DataValidate Data Basic ChecksFigure 3-3Validate Data dialog box, Basic Checks tabThe Basic Checks tab allows you to select basic checks for analysis variables, case identifiers,and whole cases.Analysis Variables. If you selected any analysis variables on the Variables tab, you can select anyof the following checks of their validity. The check box allows you to turn the checks on or off. Maximum percentage of missing values. Reports analysis variables with a percentage ofmissing values greater than the specified value. The specified value must be a positivenumber less than or equal to 100. Maximum percentage of cases in a single category. If any analysis variables are categorical,this option reports categorical analysis variables with a percentage of cases representing asingle nonmissing category greater than the specified value. The specified value must be apositive number less than or equal to 100. The percentage is based on cases with nonmissingvalues of the variable. Maximum percentage of categories with count of 1. If any analysis variables are categorical,this option reports categorical analysis variables in which the percentage of the variable’scategories containing only one case is greater than the specified value. The specified valuemust be a positive number less than or equal to 100.
12Chapter 3 Minimum coefficient of variation. If any analysis variables are scale, this option reportsscale analysis variables in which the absolute value of the coefficient of variation is lessthan the specified value. This option applies only to variables in which the mean isnonzero. The specified value must be a non-negative number. Specifying 0 turns off thecoefficient-of-variation check. Minimum standard deviation. If any analysis variables are scale, this option reports scaleanalysis variables whose standard deviation is less than the specified value. The specifiedvalue must be a non-negative number. Specifying 0 turns off the standard deviation check.Case Identifiers. If you selected any case identifier variables on the Variables tab, you can selectany of the following checks of their validity. Flag incomplete IDs. This option reports cases with incomplete case identifiers. For a particularcase, an identifier is considered incomplete if the value of any ID variable is blank or missing. Flag duplicate IDs. This option reports cases with duplicate case identifiers. Incompleteidentifiers are excluded from the set of possible duplicates.Flag empty cases. This option reports cases in which all variables are empty or blank. For thepurpose of identifying empty cases, you can choose to use all variables in the file (except any IDvariables) or only analysis variables defined on the Variables tab.
13Validate DataValidate Data Single-Variable RulesFigure 3-4Validate Data dialog box, Single-Variable Rules tabThe Single-Variable Rules tab displays available single-variable validation rules and allows you toapply them to analysis variables. To define additional single-variable rules, click Define Rules. Formore information, see the topic Define Single-Variable Rules in Chapter 2 on p. 3.Analysis Variables. The list shows analysis variables, summarizes their distributions, and showsthe number of rules applied to each variable. Note that user- and system-missing values are notincluded in the summaries. The Display drop-down list controls which variables are shown; youcan choose from All variables, Numeric variables, String variables, and Date variables.Rules. To apply rules to analysis variables, select one or more variables and check all rules thatyou want to apply in the Rules list. The Rules list shows only rules that are appropriate for theselected analysis variables. For example, if numeric analysis variables are selected, only numericrules are shown; if a string variable is selected, only string rules are shown. If no analysis variablesare selected or they have mixed data types, no rules are shown.Variable Distributions. The distribution summaries shown in the Analysis Variables list can bebased on all cases or on a scan of the first n cases, as specified in the Cases text box. ClickingRescan updates the distribution summaries.
14Chapter 3Validate Data Cross-Variable RulesFigure 3-5Validate Data dialog box, Cross-Variable Rules tabThe Cross-Variable Rules tab displays available cross-variable rules and allows you to apply themto your data. To define additional cross-variable rules, click Define Rules. For more information,see the topic Define Cross-Variable Rules in Chapter 2 on p. 6.
15Validate D
IBM SPSS Statistics is a comprehensive system for analyzing data. The Data Preparation optional add-on module provides the additional analytic techniques described in this manual. The Data Preparation add-on module must be used with the SPSS Statistics Core system and is completely integrated into that system. About IBM Business Analytics