Transcription
Seminar 5 Data Collection,Preparation and Analysis UsingSPSSBy Dr. Muhammad Ramzanmramzaninfo@gmail.com,03004487844Edited by Ahsan Khan Ecoahsankhaneco@yahoo.com03008046243
Data Collection-Methods Data collection method is impacted by themethod of research you choose. It is usuallydone through:– Data collection by the individual researcher– Collection through hired researchers– Collection through firms
Data Collection-Formats Format of data is influenced by the method ofresearch, as it could be Printed questionnaires Interview sheets (in-person or telephonic) Focus group notes Observation notes Email or web responses Content analysis notes, pictures, documentaries Printed, e-records, scanned data Literature review
Data Preparation Preparation of data file It is important to convert raw data into a usabledata for analysis The analysis and results will surely depend onthe quality of data There are possibilities of errors in handlinginstruments, raw data, transcribing, data entry,assigning codes, values, value labels Data need to be cleaned to fulfill the analysisconations
Data Analysis Analysis of data is influenced by a number offactors. They are but not limited to: The purpose of research The type research questions and hypothesis The method of research and format of data Use of software for management, manipulationand analysis of data Researchers skills and capabilities Techniques used for data The quality of the data
Stages of Data AnalysisEDITINGCODINGDATA ENTRYDATA ANALYSISERRORCHECKINGANDVERIFICATION
Data Preparation ProcessPrepare Preliminary Plan of Data AnalysisCheck QuestionnaireEditCodeTranscribeClean DataStatistically Adjust the DataSelect Data Analysis Strategy
Questionnaire CheckingA questionnaire returned from the field may be unacceptable forseveral reasons.– Parts of the questionnaire may be incomplete.– The pattern of responses may indicate that the respondent didnot understand or follow the instructions.– The responses show little variance.– One or more pages are missing.– The questionnaire is received after the pre-established cutoffdate.– The questionnaire is answered by someone who does notqualify for participation.
Questionnaire CheckingWe need to find valid questionnaires for dataanalysisEach questionnaire/response need allotment of acase number for future referenceQuestionnaire/response need filing in an order forretrieval and verification
Editing of ResponsesTreatment of Unsatisfactory Results– Returning to the Field – The questionnaires withunsatisfactory responses may be returned to thefield, where the interviewers re-contact therespondents.– Assigning Missing Values – If returning thequestionnaires to the field is not feasible, the editormay assign missing values to unsatisfactoryresponses.– Discarding Unsatisfactory Respondents – In thisapproach, the respondents with unsatisfactoryresponses are simply discarded.
Reasons for EditingCONSISTENCYCOMPLETENESSQUESTIONSANSWEREDOUT OF ORDER
Editing The process of checking and adjusting thedata– for omissions– for legibility– for consistency And readying them for coding and storage
Codes The rules for interpreting, classifying, andrecording data in the coding process The actual numerical or other charactersymbols
CodingCoding means assigning a code, usually a number, to each possibleresponse to each question. The code includes an indication ofthe column position (field) and data record it will occupy.Coding Questions Fixed field codes, which mean that the number of records foreach respondent is the same and the same data appear in thesame column(s) for all respondents, are highly desirable. If possible, standard codes should be used for missing data.Coding of structured questions is relatively simple, since theresponse options are predetermined. In questions that permit a large number of responses, eachpossible response option should be assigned a separate column.
CodingGuidelines for coding unstructured questions: Category codes should be mutually exclusive andcollectively exhaustive. Only a few (10% or less) of the responses should fallinto the “other” category. Category codes should be assigned for critical issueseven if no one has mentioned them. Data should be coded to retain as much detail aspossible.
CodebookA codebook contains coding instructions and thenecessary information about variables in the data set.A codebook generally contains the followinginformation: column number record number variable number variable name question number instructions for coding
Coding Questionnaires The respondent code and the record number appearon each record in the data. The first record contains the additional codes: projectcode, interviewer code, date and time codes, andvalidation code. It is a good practice to insert blanks between parts Here are examples of coding
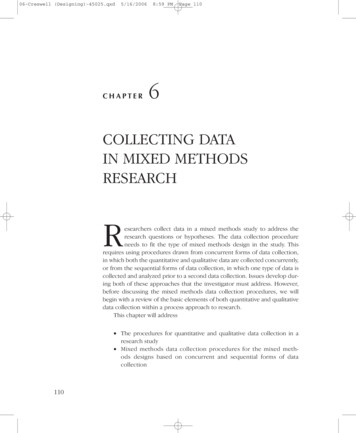
1a. How many years have you been playing tennis on a regular basis?Number of years:b. What is your level of play?Novice . . . . . . . . . . . . . . .Lower Intermediate . . . . .Upper Intermediate . . . . .-1-2-3Advanced . . . . . . .Expert . . . . . . . . .Teaching Pro . . . .-4-5-6c. In the last 12 months, has your level of play improved, remained thesame or decreased?Improved. . . . . . . . . . . . . .Remained the same . . . . .-1-2Decreased. . . . . . .-3
2a. Do you belong to a club with tennis facilities?Yes . . . . . . .No . . . . . . .b. How many people in your household - including yourself - play tennis?Number who play tennis3a. Why do you play tennis? (Please “X” all that apply.)To have fun . . . . . . . . . .To stay fit. . . . . . . . . . . .To be with friends. . . . . .To improve my game . . .To compete. . . . . . . . . . .To win. . . . . . . . . . . . . . .-1-2-3-4-5-6b. In the past 12 months, have you purchased any tennis instructionalbooks or video tapes?Yes . . . . . . .-1No . . . . . . .-2-1-2
4. Please rate each of the following with regard to this flight, ifapplicable.Excellent GoodCourtesy and Treatment from the:Skycap at airport . . . . . . . . . . . . . .Airport Ticket Counter Agent . . . . .Boarding Point (Gate) Agent . . . . .Flight Attendants . . . . . . . . . . . . . .Your Meal or Snack. . . . . . . . . . . . .Beverage Service . . . . . . . . . . . . . .Seat Comfort. . . . . . . . . . . . . . . . . .Carry-On Stowage Space. . . . . . . .Cabin Cleanliness . . . . . . . . . . . . .Video/Stereo Entertainment . . . . . .On-Time Departure . . . . . . . . . . . .43FairPoor21
“I believe that people judge yoursuccess by the kind of car you drive.”Strongly agreeMildly agreeNeither agreenor disagreeMildly agreeStrongly disagree54321Strongly agreeMildly agreeNeither agreenor disagreeMildly agreeStrongly disagree 1 20-1-2
Data Transcription Transcribe raw data into testable form Determine variables Convert raw data into meaningful forfurther processing and answering theresearch questions and testing hypothesis Assign values, weights, value labels Scanning, data entry
Data Entry The process of transforming data from theresearch project to computers Transferring data files from excel to SPSS Optical scanning systems– Marked-sensed questionnairesIn SPSS open the data viewAnd enter the dataPractical session
Data Cleaning: Consistency ChecksConsistency checks identify data that are out ofrange, logically inconsistent, or have extremevalues.– Computer packages like SPSS, SAS, EXCEL andMINITAB can be programmed to identify out-ofrange values for each variable and print out therespondent code, variable code, variable name,record number, column number, and out-of-rangevalue.– Extreme values should be closely examined.
Data Cleaning Through SPSSClick analyze in main menu of SPSS data, then click ondescriptive analysis, then frequenciesSelect variable that you want to checkClick on statistics and tick minimum and maximumvaluesClick on continueSummary of results will provide each of variable youselected and then breakdown of responsesCheck if there are inconsistenciesGo to data file and remove if there is anyYou can clean your data using SPSS descriptive analysisfeatures
Data Cleaning: Treatment of Missing Responses Substitute a Neutral Value – A neutral value, typicallythe mean response to the variable, is substituted for themissing responses. Substitute an Imputed Response – The respondents'pattern of responses to other questions are used toimpute or calculate a suitable response to the missingquestions. In casewise deletion, cases, or respondents, with anymissing responses are discarded from the analysis. In pairwise deletion, instead of discarding all cases withany missing values, the researcher uses only the cases orrespondents with complete responses for each
Statistically Adjusting the Data: Weighting In weighting, each case or respondent in the database isassigned a weight to reflect its importance relative toother cases or respondents. Weighting is most widely used to make the sample datamore representative of a target population on specificcharacteristics. Yet another use of weighting is to adjust the sample sothat greater importance is attached to respondents withcertain characteristics Example
Variable Re-specification Variable respecification involves the transformation ofdata to create new variables or modify existing variables. E.G., the researcher may create new variables that arecomposites of several other variables. Dummy variables are used for respecifying categoricalvariables. The general rule is that to respecify acategorical variable with K categories, K-1 dummyvariables are needed.
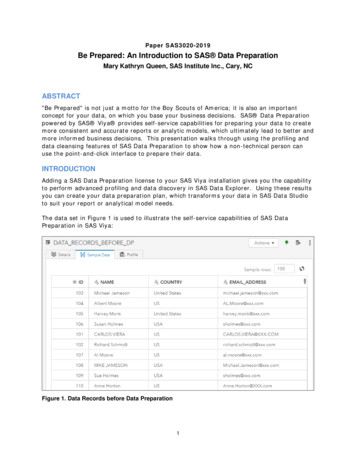
Variable Re-specificationProduct UsageCategoryNonusersLight usersMedium usersHeavy usersOriginalVariableCodeDummy Variable CodeX1X2X31234100001000010Note that X1 1 for nonusers and 0 for all others. Likewise, X2 1 forlight users and 0 for all others, and X3 1 for medium users and 0 for allothers. In analyzing the data, X1, X2, and X3 are used to represent all user/nonuser groups.
Data Transformation Data conversion Changing the original form of the data to anew format More appropriate data analysis New variables
New Variables Collapsing 5-point scale into 3-point scale Collective, average data of respondents andvariables Reversal of negative statements Example
Collapsing a Five-Point Scale Strongly Agree Agree Neither Agree norDisagree Disagree Strongly Disagree Strongly Agree/Agree Neither Agree norDisagree Disagree/StronglyDisagree
Descriptive Analysis The transformation of raw data into a formthat will make them easy to understand andinterpret; rearranging, ordering, andmanipulating data to generate descriptiveinformation
Tabulation Tabulation - Orderly arrangement of data ina table or other summary format Frequency table Percentages
Frequency Table The arrangement of statistical data in a rowand-column format that exhibits the countof responses or observations for eachcategory assigned to a variable
Central TendencyType of ScaleMeasure ofCentralTendencyMeasure ofDispersionNominalOrdinalInterval or ratioModeMedianMeanNonePercentileStandard deviation
Cross-Tabulation A technique for organizing data by groups,categories, or classes, thus facilitatingcomparisons; a joint frequency distributionof observations on two or more sets ofvariables Contingency table- The results of a crosstabulation of two variables, such as surveyquestions
Cross-Tabulation Analyze data by groups or categoriesCompare differencesContingency tablePercentage cross-tabulations
Type ofMeasurementType ofdescriptive analysisTwocategoriesNominalMore thantwo categoriesFrequency tableProportion (percentage)Frequency tableCategory proportions(percentages)Mode
Type ofMeasurementType ofdescriptive analysisOrdinalRank orderMedian
Type ofMeasurementType ofdescriptive analysisIntervalArithmetic mean
Type ofMeasurementRatioType ofdescriptive analysisIndex numbersGeometric mean
You are goodstudents-NOWPRACTICEBy Dr. Muhammad Ramzanmramzaninfo@gmail.com,03004487844Edited by Ahsan Khan Ecoahsankhaneco@yahoo.com03008046243
Seminar 5 Data Collection, Preparation and Analysis Using SPSS By Dr. Muhammad Ramzan mramzaninfo@gmail.com, 03004487844 Edited by Ahsan Khan Eco ahsankhaneco@yahoo.com 03008046243 . Data Collection-Methods Data collection method is impacted by the method of research you choose. It is usually done through: - Data collection by the individual researcher - Collection through hired .