Transcription
LRBI ChecklistData CollectionData CollectionDefinitionData collection is collecting specific information abouta student’s academic or behavioral performance.Collecting data helps an instructor determine a program’seffectiveness. By collecting and analyzing data on asystematic basis, an instructor knows when to makechanges in both academic and behavior programs.Data collection has two critical components: information gathering and decision making.Information gathering may involve curriculum-based assessment, observing classroombehavior, grading papers, or parent interviews. The more structured and systematic theprocess, the more valid the information. Once the data is collected, the instructor must thenmake decisions based on that information. Decisions might be made regarding changes incurriculum or the management of specific classroom behaviors.Things to Do Select the behavior. Define the target behavior(s). Choose a data collectionsystem. Determine when to collectdata. Implement the data collectionsystem. Summarize and graph data. Utilize data to make decisionsabout program effectiveness.Preliminary Strategies1
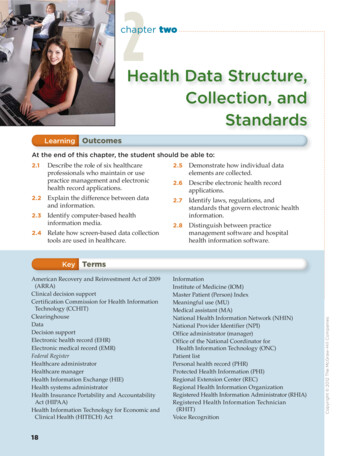
LRBI ChecklistData CollectionSelectSelect thethe behavior.behavior.It is always important to pinpoint or specify the target behavior before initiating a behaviorchange or academic program for a student. Data is typically collected on the following typesof behavior: academic, classroom, work-related, or social. When selecting the behavior, it isimportant to use descriptive rather than ambiguous terms. For example, “causes problems” tells less about a student’s behavior than “does not follow directions.” Likewise, “lazy”is less informative than “does not complete assignments on time.”BehaviorsReduce ProblematicBehaviorsReplace ProblematicMost parents and instructors can identify anumber of behaviors that they would like to seereduced. In general, they include such problembehaviors as noncompliance, off-task behavior,talking out, or aggression.Remember, when targeting behavior that isproblematic, it is equally important to identify theappropriate skill(s) that would replace theproblem behavior. For example, a replacementbehavior for “noncompliance” might be “followinginstructor’s directions within 5 to 10 seconds.”Similarly, a replacement behavior for “interruptsadults and peers” might be “waits turn to speakwhen others are talking.”DefineDefine thethe targettarget behavior(s).behavior(s).Observable & MeasurableAfter selecting the behaviors, the instructormust specifically define the target behaviorsin “observable and measurable” terms.Observable and measurable refers to behaviors that are easily observed, countable,have a beginning and an end, and arerepeatable. For example, the behavior“talking out” might be defined as “when theteacher asks the class a question, thestudent speaks without raising her hand orwaiting to be called upon.” A precise definition pinpoints when and under what conditions the behavior must occur.Behavioral ObjectivePreliminary StrategiesDefine theBehavior Easily observedCountableBeginning/endRepeatableOnce the behavior has been defined, create arelated behavioral objective. That is, determinewhat the student should accomplish as a result ofthe instructional or behavioral program.2
LRBI ChecklistData CollectionBehavioral ObjectiveSituationDefinitionCriteriaDefine theBehaviorThe objective should have three parts:1.The situation or conditions under which thebehavior is expected to occur.2.The behavioral pinpoint or definition.3.The criteria for acceptable performance.An academic objective mightaddress basic reading skillsin the following way.SituationDefinitionCriteriaGiven 30flash cardswith words . . .Joey will readthe wordsorally within2 seconds foreach word . . .with 90%accuracyon twoconsecutivetrials.A behavioral objective for social skills might state the following.Situation Collecting academic performance information (permanent product). Using behavior checklists.CriteriaWhen Sally’steacher makesa request . . .she will complywith the requestwithin 5 to 10seconds . . .80% of thetime for 2consecutiveweeks.ChooseChoose aa datadata collectioncollection system.system.Typically, instructors use a variety of assessment techniques. Those most commonlyused include:DefinitionChoose a DataCollectionSystemTypes of DataPPPPPermanent productsBehavior checklistsInterviewsObservationsInterviewing others.Observing students in classrooms, worksites, lunch, break, or recess activities.Preliminary Strategies3
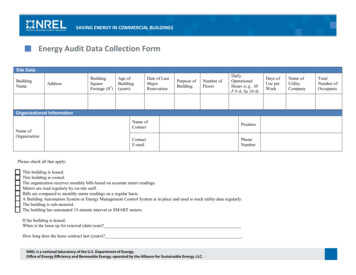
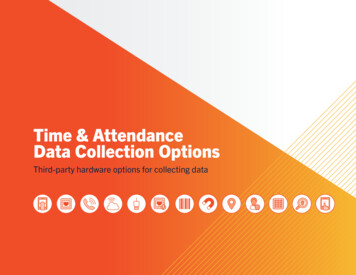
LRBI ChecklistData CollectionecklistsBehavior Problem ChsBehavioral InterviewPermanent ProductsObservations 16Checklists are lists of specific behaviors completedby persons familiar with the student. They arepopular among instructors because they are easyto use and can be helpful in identifying the severity of the behavior problem. But be aware thatmany checklist items are vague and open tointerpretation. Also, many individuals relying ontheir memory complete checklists after the fact,resulting in questionable or biased data.Interviews involve asking someone informationabout a subject. They can be conducted with bothchildren and adults. This assessment techniquehelps establish a relationship with the persongiving the information. Interviews are often openended, allowing the interviewer to gather additional information as needed.These products are outcomes of behavior and may betangible items, such as worksheets or mastery tests.They may also be environmental outcomes, such asa driveway that has been swept clean. Permanentproducts have been used by instructors to gradespelling tests, check arithmetic problems, or countthe number of wooden stakes painted by a student.Whereas the permanent product method of datacollection records the outcome of a behavior,observational recording systems are used torecord samples of behavior as they are occurring.There are several basic systems for recordingobservational data. Each system has strengthsand weaknesses that lend itself to particularbehaviors and their unique characteristics.Event RecordingEvent or frequency recording is used by instructors who areinterested in counting the number of times a behavioroccurs. A tally is madeEventeach time theObservationsstudent engages2345in the targetbehavior. Thiscount is made78910within a specified time, suchas a 30-minutemath session.30-minute math sessionPreliminary StrategiesObservational SystemsEventInterval/Time SamplingDurationLatency4
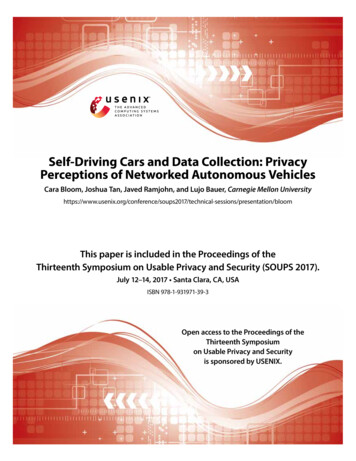
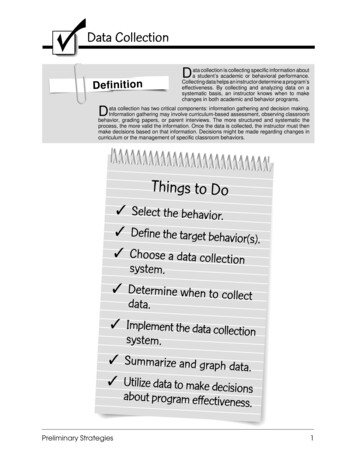
LRBI ChecklistData CollectionEvent recording is usually the method of choice when the teacher wants to increase ordecrease a behavior. To use event recording, the behavior must be observable and have aclear beginning as well as a clear ending.StrengthsWeaknessesOnly need a clipboard, pencil, and paper or acounting device.Do not use under the following conditions: When the behavior is occurring at such ahigh rate that an accurate count is impossible, such as pencil tapping. When the behavior occurs for extended periods of time, such as out-of-seat behavior.Interval RecordingInterval recording and time sampling are best used for behaviors that appear continuous,such as talking with peers or on-task behavior. Interval recording provides an estimate ofthe actual number of times that a behavior occurs.IntervalTo use interval recording, break the observationperiod into short intervals of time—usually from 10seconds to 1 minute. Then simply note whether thebehavior occurred ( ) or did not occur (–) during theinterval. Keep in mind that data from intervalrecording represents an “estimate” of behaviorrather than an actual count.10E S20–30 T I 1020405060 – 506030M40ATE1min.2min.On-task4 out of 6 intervalsStrengthsWeaknessesRegardless of whether the behavior occurs once,twice, or five times, it is checked only once toindicate that it occurred during the interval.It’s difficult to teach and collect accurate dataat the same time. The necessity of lookingdown at a stopwatch or data sheet to record theinformation can be disruptive to any lesson.Often an observer is required.However, a cassette recorder and a “beep”tape, signaling at regular intervals, caneliminate timing issues. Or use an intervalform that incorporates a recording interludefollowing each interval.Interval(with 5-second record)10" 5" 10" 5" 10" 5" 10" 5" – eliminary Strategies5
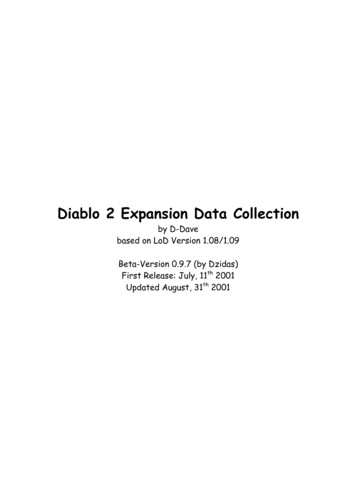
LRBI Checklist Data CollectionTime SamplingTime SamplingTime sampling is a variation of interval recording.Intervals of a certain length are set up usually inminutes as opposed to seconds. Instead of noting theoccurrence or nonoccurrence of a behavior throughoutthe entire interval, the observer looks at the studentat only the end of the interval and records whetherthe behavior is occurring at that sesRequires less work and is effective when theinstructor is interested in group performance.Is less accurate than interval recording. Duration RecordingUse this method when your primary concern is the length of time the student engages inthe behavior. For example, if you want to know about a student’s out-of-seat behavior, eventor duration recording may work.04:49 To record duration data, start the stopwatch when the studentbegins the behavior and stop the watch when the behavior iscompleted.04:54StrengthsWeaknessesEvent recording tells only how many timesthe student is out of his/her seat during a timeperiod. Duration recording tells how manytimes plus how long the student is out of his/her seat.As with event recording, the behaviors measured must have a clear beginning and an endand not occur too frequently. Latency RecordingFocuses on time rather than frequency. Use latencyrecording when you’re interested in how long a studenttakes to begin performing a particular behavior once ithas been requested.To record latency data, note when you give the studenta directive and when the student begins the response.Preliminary StrategiesLatency RecordingObserver DouglasDate Oct. 11Student JoeySession MathTarget Behavior Start assignments on timeDirection:Start:Stop:1:051:101:256
LRBI ChecklistData CollectionDetermineDetermine whenwhen toto collectcollect data.data.Identify times to collect data throughout the day or week. These times willvary depending on what target behaviors are selected, how frequentlythey occur, and available resources.For example, a teacher interested incollecting data on math performancemay collect information during (e.g.,rate) and after (e.g., assignmentscompleted) a math session. Socialbehaviors may be more readily assessed during unstructured timessuch as break, recess, or lunch.Daily Schedule8:15 – 8:308:30 – 9:159:15 –10:0010:00 – 10:1510:15 –11:0011:00 –11:4511:45 – 12:1512:15 –12:3012:30 – 1:151:15 – 1:451:45 – 2:402:40 – 2:45Homeroom/ReadingLanguage Arts Target behaviorMathRecessHistoryScience FrequencyLunchGreat BooksMedia/ComputerPhysical EducationCooperative LearningClean-Up/Dismiss AvailableresourcesImplementImplement thethe datadata collectioncollection system.system.Once the times for data collection have been established, it is important to stick to your schedule. If data are to be representative of astudent’s performance, it must be collected on a consistent basis overtime. Only then can the effects of program changes or interventionson a student’s behavior be determined.UsetaCorrect or Reliable DaSTicKTo iT!To be sure the data are correct or reliable, it iswise to periodically have a second observer simultaneously record the same behavior of the samestudent at the same time. When this is done, thetwo observations can be compared and interobserverreliability or agreement calculated.Adjust the data collection system and behavioraldefinition as needed to ensure valid and reliableinformation is being collected and communicatedwith others. [See Alberto and Troutman (1995) fora “user friendly” discussion on critical reliabilityissues and procedures for instructors.]Preliminary Strategies7
LRBI ChecklistData CollectionSummarizeSummarize andand graphgraph data.data.To be useful, information gathered through data collection must be easily readable. Tallies orother forms of raw data are difficult to interpret, especially when more than one individual issharing the information. Graphing data provides an easy, systematic way of displayinginformation about the target behavior.Graphing is a two-step process. First, raw data must be converted to a usable form, such aspercentages, number correct, or a rate.PercentageFor example, to calculate a percentage of correctresponses, divide the number of correct responsesby the total number of responsesPercent Correctand multiply by# correct100.responsesx 100 Total # ofresponsesExampleSummarize &Graph Data20 mathproblemsx 100 50% correct40 possibleRateA rate of correctresponding is computed by dividingthe number correctby the responsetime.Rate# correctresponses ResponsetimeExampleSummarize & 20 correctGraph Data 30 minutes .7 problemscorrect/minutePreliminary Strategies8
LRBI ChecklistData CollectionGraphsThere are several types of graphs that can be used.These include: Basic line graphCumulative graphRatio graphBar graphOut of SeatThe most frequently used tool for displaying datais the basic line graph. The line graph includestwo axes, the horizontal or x-axis and the verticalor y-axis. The axes are labeled with the timedimension (e.g.,session, day, hour)placed on the xaxis and thedescription ofLine Graphbehavior (e.g.,talk-outs, contributions, praisestatements)placed on the yaxis. Each datapoint is placed atthe intersection ofthe session inSessionswhich it occurredand the level ofbehavior.UtilizeUtilize datadata toto makemake decisionsdecisions aboutabout f-TaskTo provide valid and reliable information regarding a student’sperformance, data collection must be a continuous, ongoingprocess. To determine if a program has been effective, ithelps to evaluate trends in performance by focusing onsystematic and consistent increases or decreases inperformance. Trends are defined as 3 or more data points inthe same direction. Trends in data indicate the effectivenessof programs and assist instructors in determining the needfor program changes.SessionsPreliminary Strategies9
LRBI ChecklistData CollectionVariationsVariations ofof thethe TechniqueTechnique Public posting or advertising for successis a highly effective intervention that maybe used by instructors to enhance studentmotivation and decrease inappropriatebehaviors. Public posting is a form of datacollection and provides immediate andprecise information to students regardingtheir academic or behavioral progress.Public posting requires a visual feedbacksystem, a systematic method for gathering and displaying relevant performancedata, and an engineered positive reactionto the student’s performance. [For implementation details, see BEST Practices:Behavioral and Educational Strategies forTeachers (1996).]process assesses behavior as it varieswithin the environment. Functionalanalysis is often referred to as the A, B, C(A Antecedent, B Behavior, C Consequence) function of behavior and examines the impact of antecedents or circumstances (e.g., events, individuals) and consequences (e.g., reinforcers, punishers)on the target behavior. (For more specificinformation, see Functional Analysis—Preliminary Strategies.) Self-management, another variation ofdata collection, teaches students to monitor and evaluate their behavior and provide their own positive and negative consequences. (See Self-Management—Level1 for additional information and steps forimplementation.) If the data collected will be used for purposes of classification rather than standard monitoring of academic performance, the instructor must first informthe parent(s) of the intent (prior notice)and obtain his/her signature on an district-approved “Permission to Evaluate”form.Functional analysis is a multifacetedform of data collection. This comprehensiveGettingGetting ReadyReady Prior to data collection, the instructor shouldreview his/her resources and daily schedule to determine what forms of data collection are feasible. If the instructor workswith other staff, more time-consumingforms of data collection are possible. Whenworking alone, the instructor needs toconsider what pieces of data are vital andwhat data systems can be successfullyimplemented in light of the circumstances.Preliminary Strategies10
LRBI ChecklistData CollectionReferencesReferencesAlberto, P. A., & Troutman, A. C. (1995). Applied behavior analysis for teachers (4th ed.).New York: Macmillan.Algozzine, B. (1992). Problem behavior management: Educator’s resource service (2nd ed.).Gaithersburg, MD: Aspen.Barlow, D., & Hersen, M. (1984). Single-case experimental designs: Strategies for studyingbehavior change. New York: Pergamon Press.Jenson, W. R., Sloane, H. N., & Young, K. R. (1988). Applied behavior analysis in education:A structured teaching approach. Englewood Cliffs, NJ: Prentice Hall.Morgan, D. P., & Jenson, W. R. (1988). Teaching behaviorally disordered students. Columbus,OH: Merrill.Reavis, H. K., Kukic, S., Jenson, W. R., & Morgan, D. (Eds.). (1996). BEST strategies: Behavioral and educational strategies for teachers. Longmont, CO: Sopris West.Preliminary Strategies11
Latency Observations B ehavioral Interview s Perm anent Products . Implement the data collection system.Implement the data collection system.Implement the data collection system. Once the times for data collection have been established, it is impor-tant to stick to your schedule. If data are to be representative of a