Transcription
SPARC DALLASInitial Findings from Quantitative and Qualitative ResearchMarch 16, 2018This document was prepared by theCenter for Social Innovation (C4) in Needham, MA forMetro Dallas Homeless Alliance in Dallas, TXAuthors:Marc DonesMolly RichardMaya Beit-ArieCatriona WilkeySvetlana YampolskayaJeffrey Olivet, Principal InvestigatorContact:Marc Donesmdones@center4si.com617 467 6014 l center4si.com200 Reservoir Street, Suite 202Needham, MA 02494 USA
BackgroundRacial inequity persists in the United States despite significant attention to this issue over pastdecades. Recent assessments of the contemporary racial dynamic suggest that racism has notdeclined but has instead become less overt.1 One manifestation of the nation’s current racialrealities is that people of color are disproportionately represented in the homeless population.Black people, in particular, are more likely to become homeless than people of other racial andethnic backgrounds. Although Black people comprise 13% of the US population and 26% ofthose living in poverty, they account for more than 40% of the overall homeless population.2This suggests that poverty rates alone do not explain the over-representation of BlackAmericans in the homeless population. Furthermore, Black men remain homeless longer thanWhite or Hispanic men.3Homelessness reflects the failure of our social systems to serve people equally in housing,education, health care, and justice. The Center for Social Innovation (C4) launched SupportingPartnerships for Anti-Racist Communities (SPARC) in 2016 in response to overwhelmingevidence that people of color were dramatically overrepresented in the nation’s homelesspopulation—across the country and regardless of jurisdiction. The SPARC initiative focuses onusing mixed methods research to identify how people are experiencing the accrual of systemicracism and to leverage that knowledge towards systems transformation. The purpose of thisreport is to present initial findings from our work with Dallas, Texas. A national report isavailable online and pulls data from across all SPARC communities. 41Bonilla-Silva, E. (2006). Racism without racists: Color-blind racism and the persistence of racial inequality in the United States.New York: Rowman & Littlefield Publishers.2US Census Bureau. (2013). Current Population Survey; Carter III, G.R. (2011). From exclusion to destitution: Race, affordablehousing, and homelessness. Cityscape, 33-70.; US Department of Housing and Urban Development. (2015). The 2015 AnnualHomeless Assessment Report to Congress: Part 1. Washington, DC.3Carter III, G.R. (2011). From exclusion to destitution: Race, affordable housing, and homelessness. Cityscape, 33-70.; Molina-Jackson, E. (2007). Negotiating homelessness through the saliency of family ties: The personal networking practices of Latino andAfrican American men. J Social Distress and Homeless, 16(4), 268-320.4Center for Social Innovation. (2018). SPARC Phase One Study Findings. RC-Phase-1-Findings-March-20181.pdfSPARC Dallas Report2
Glossary of TermsRacism - A system of advantage/oppression based on race. Racism is exercised by thedominant racial group (Whites) over non-dominant racial groups. Racism is more than justprejudice.Inequities - Differences in outcomes between population groups that are rooted in unfairnessor injustice.Equity - A situation where all groups have access to the resources and opportunities necessaryto eliminate gaps and improve the quality of their lives.Racial Equity - “Closing the gaps” so that race does not predict one’s success, while alsoimproving outcomes for all. Equity is distinct from equality in that it aspires to achieve fairoutcomes and considers history and implicit bias, rather than simply providing “equalopportunity” for everyone. Racial equity is not just the absence of overt racial discrimination; itis also the presence of deliberate policies and practices that provide everyone with the supportthey need to improve the quality of their lives.” 5Antiracism - “An action-oriented, educational and political strategy for institutional andsystemic change that addresses the issues of racism and the interlocking systems of socialoppression (sexism, classism, heterosexism, ableism).”65George J. Sefa Dei, Power, Knowledge and Antiracism Education, ed. George Sefa Dei and Agnes Calliste (Halifax: Fernwood,2000), 13.6Maguire, Angus. “Illustrating Equality vs. Equity.” Interaction Institute for Social Change, 13 Jan. y-vs-equity/SPARC Dallas Report3
Table of Contents1. Executive Summary . 51.1 Summary of Preliminary Quantitative Findings. 61.2 Summary of Preliminary Qualitative Findings . 71.3 Provider Survey . 81.4 Recommendations . 92. Preliminary Quantitative Research . 92.1 Preliminary Quantitative Research Findings . 102.2 Predictors for Exit Destination. 193. Preliminary Findings from Qualitative Data . 223.1 Summary . 223.2 Pathways into Homelessness. 233.3 Barriers to Exiting Homelessness . 284. Discussion: Promising Directions . 374.1 Economic Mobility for Communities of Color . 374.2 Upstream and Downstream Stabilization . 394.3 Hispanic/Latinx . 414.4 Trans* People of Color. 425. Recommendations. 436. Conclusion . 457.Appendix . 467.1 Online Survey of Providers . 46Methods. 46Results. 46SPARC Dallas Report4
1. Executive SummaryBeginning in October 2016, the Center for Social Innovation (C4) partnered with the MetroDallas Homeless Alliance and other service providers to amplify the issue of racial inequity andhomelessness. This partnership included convening a town hall meeting, hosting a providertraining, facilitating a planning session of community leaders, and collecting local data.In the Dallas planning session of community leaders, stakeholders from homeless serviceorganizations identified three “Structural Change Objectives” for our work to address racialinequity in our system, including:1. Strengthening opportunities for economic mobility in communities of color in the DallasMetro area.2. Folding equity measures into the Continuum of Care’s long-term Strategic Plan to EndHomelessness.3. Diversifying leadership and board membership in the Continuum of Care and otherservice providers.As part of the effort to better understand the intersection of racism and homelessness in Dallas,C4 worked with Metro Dallas Homeless Alliance to collect qualitative and quantitative data thatwould elucidate the racial dimensions of homelessness in the area. Data collection included:1. Homeless Management Information System (HMIS) data from fiscal years 2011 to2016.72. An online demographic survey of homeless service providers.3. Qualitative research, including 23 individual interviews with people of colorexperiencing homelessness and three focus groups comprised of providers,stakeholders, and people experiencing homelessness.This report presents preliminary findings from this research. In the Discussion, we presentpromising directions for potential systems change and further research, and in theRecommendations, we outline potential short term and long-term action steps for programs,the Metro Dallas Homeless Alliance, and the City of Dallas. We also explore the links betweenthe data and the objectives identified by the Dallas community leaders.HMIS includes client-level data and data on the provision of housing and services to homeless individuals andfamilies and persons at risk of homelessness.7SPARC Dallas Report5
1.1 Summary of Preliminary Quantitative Findings Our analyses of HMIS data from the Dallas Continuum of Care for fiscal years 20112016 explored the demographics of people experiencing homelessness compared topeople in poverty and the general population, racial/ethnic disparities in location priorto homelessness and destination at exit, and race/ethnicity as a predictor of exitdestination. Our findings include:o Though the Black population in Dallas constitutes 18.7% of the generalpopulation, this group is overrepresented among those living in deep poverty(30.7%) and among people experiencing homelessness (66.7%). The disparitybetween the percentage in poverty and those experiencing homelessnesssuggests that poverty alone does not explain the overrepresentation of Blackpeople in the population experiencing homelessness.o On the other hand, Whites constitute 63.2% of the general population but areslightly underrepresented in the deep poverty group (49.5%) and drasticallyunderrepresented among the homeless population (29.8%).o Looking at prior location of families, Black individuals in households were slightlyunderrepresented in group entering from “permanent housing, no subsidy.”Conversely, White and Hispanic/Latinx8 individuals were slightly overrepresentedin entering from the “permanent housing, no subsidy” location.o The most common prior living situation for young adults was “doubled up”(48.3%). Across the “doubled up” experience, race/ethnicity groups weregenerally proportional, though Hispanic/Latinx were slightly overrepresented.White individuals under 24 disproportionately came from the “institutional care”location.o Black individual adults 24 years and older were slightly overrepresented in thepopulation that entered from doubled-up situations.oWhen looking at exit destination, Black families were slightly overrepresented inthe population exiting into “permanent housing with a subsidy,” while Whitesand Hispanic/Latinx families were underrepresented. In fact, logistic regressionsshowed that, compared to Whites, Blacks were more likely to exit intopermanent housing with a subsidy at rates of 57%. Conversely, individualsidentifying as Hispanic/Latinx were 32% less likely to exit into permanenthousing with a subsidy.8Latinx is a gender neutral term used in lieu of Latino or Latina.SPARC Dallas Report6
oCompared to White individuals, Blacks and Asians were 26% and over two times(OR 2.47, p .01) more likely, respectively, to exit into permanent housingwithout a subsidy. Hispanic/Latinx were also 26% more likely to exit into housingwithout a subsidy.oLooking at exit destination of individuals under 24 years of age, Whites wereconsiderably overrepresented in the “institutional care” group while Blackyoung adults were underrepresented.oAcross all household type, Blacks were 23% less likely to exit into homelessnessand Native Hawaiian and Other Pacific Islanders were almost three times (OR .34, p .05) less likely to exit into homelessness compared to Whites. Conversely,those reporting Two or More Races were 48% more likely to exit intohomelessness.The findings point to the need for research that examines returns to homelessness, housingstability once exit to housing is documented, and the way age, gender, and other factorsinteract with race to impact people in intersectional ways.1.2 Summary of Preliminary Qualitative FindingsInterpretation of qualitative data focused on pathways into homelessness and barriers toexiting homelessness.1. Pathways into homelessness were often characterized relationally and involve: Network impoverishment: It is not just that respondents were experiencingpoverty —everyone they know was experiencing poverty too. Family destabilization: Strains on social support were often deep, damaging,and exacerbated by systems’ involvement. Intimate partner violence: Narratives of violence, particularly intimate partnerviolence (IPV), were common in the narratives of people we interviewed —particularly women. Health: Instability and trauma correlated with mental health and substance useissues, while medical health issues were also common in respondents’ narratives.2. Barriers to exiting homelessness are often systemic and include: Criminal justice involvement: A criminal record limited housing and employmentoptions for participants.SPARC Dallas Report7
Economic immobility: People find it difficult to secure employment that pays ahousing wage. Lack of quality affordable housing: People cannot afford the increasing rent and,furthermore, feel less motivated to try due to poor housing quality. Difficulty navigating the system: People are frustrated with programrequirements and find it hard to get what they need from public assistance.1.3 Provider SurveyTo support Dallas with its structural change objective of supporting and developing leadershipof color in homeless service agencies, we also conducted research on staff demographics andneeds. Through an online survey we collected data on the background of providers working inhomelessness response programs and their self-reported desires for professional development.In addition, we sought to understand how people perceive the issue of race in service settingsthrough semi-structured focus groups and interviews. Our analyses of an anonymous onlinesurvey of homeless service providers found: In the sample of Dallas providers surveyed who reported racial identity (n 63), 60.3%identified as White and 30.2% identified as Black; this is a stark comparison to 66.7% ofthe homeless population identifying as Black and 29.8% as White. Ten of the twelve Executive Directors and seven of the ten Administrators (defined as alladministrative roles except Executive Director) identified as White. When asked toreport their opinion on how the demographics of leadership reflect the people served,about half (46.9%) agreed that the race/ethnicity of senior managers reflect therace/ethnicity of clients. There were some race differences in reported professional development needs thatmight reflect lack of leadership pathways for people of color. Compared to people ofcolor, White respondents indicated at a greater rate that they needed grant writing andfundraising skills to excel in their current position or advance their careers. When asked what barriers might exist when considering professional developmentopportunities, people of color more often indicated compensation for time andchallenges fitting it into busy days. This points to a need for strategies for supportingstaff with financial and scheduling concerns.The entirety of our provider needs analysis can be found in the Appendix (Dallas HomelessService Providers Diversity & Inclusion – Mixed Methods Findings).SPARC Dallas Report8
1.4 RecommendationsBased on these data, preliminary recommendations include the following, which are detailedfurther in the report:1. Design an equitable Coordinated Entry system.2. Incorporate racial equity into grantmaking and contracting for homelessness andhousing programs.3. Include racial equity data analysis and benchmarks in strategic planning to endhomelessness.4. Support organizational development to ensure racial equity at the organizational level.5. Encourage anti-racist program delivery.6. Promote ongoing anti-racism training for homeless service providers.7. Collaborate to increase affordable housing availability for all people experiencinghomelessness.8. Utilize innovative upstream interventions to prevent homelessness for people of color.9. Investigate flexible subsidies to mitigate the effects of network impoverishment.10. Support innovative health care strategies to meet the health and behavioral healthneeds of communities of color.1.5 ImplicationsThis study is grounded in the lived experience of people of color experiencing homelessness,and it offers numerous insights for policy makers, researchers, organizational leaders, andcommunity members as they work to address homelessness in ways that are comprehensiveand racially equitable. The demographics alone are shocking—the vast and disproportionatenumber of people of color in the homeless population in Dallas is a testament to the historicand persistent structural racism that exists in this country. Collective responses tohomelessness must take such inequity into account. Equitable strategies to addresshomelessness must include programmatic and systems level changes, and they must seriouslybegin to address homelessness prevention. It is not enough to move people of color out ofhomelessness if the systems in place are simply setting people up for a revolving door ofhousing instability. Efforts must begin to go upstream into other systems—criminal justice,child welfare, foster care, education, and healthcare—and implement solutions that stem thetide of homelessness at the point of inflow. This report aims to present quantitative andqualitative findings from SPARC’s work in Dallas, examine what can be learned from thesedata, and begin crafting strategies to create a response to the homelessness crisis that isgrounded in racial equity.SPARC Dallas Report9
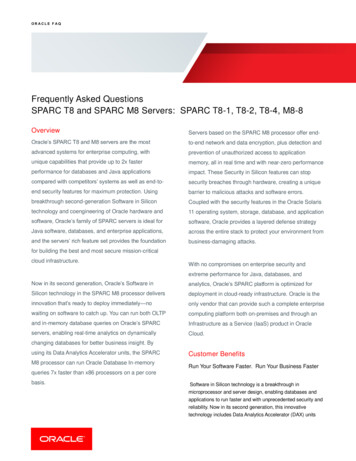
2. Preliminary Quantitative ResearchFor the purposes of this report, analysis of Dallas’ HMIS data aimed to answer this initial set ofresearch questions:1. How do the racial demographics of people experiencing homelessness compare tothose in poverty and the general population?2. How do racial demographics of people experiencing homelessness relate to “priorliving situation” at program entry?3. How do racial demographics of people experiencing homelessness relate to“destination” at program exit?Our team also looked at whether or not race or ethnicity were substantial predictors ofdestination type upon exiting the HMIS system, for example, whether or not race or ethnicityare predictors of exiting into homelessness, housing without subsidy, or housing with subsidy.2.1 Preliminary Quantitative Research FindingsThe following analyses used HMIS data from the Dallas Continuum of Care for fiscal years2011-2016. Several slightly different client universes are analyzed in this report, representing atotal of 23,334 unique clients with three different household statuses: 1) individuals presentingas part of a household, including heads of households (n 10,403); 2) individuals aged 24 andolder (n 10,543); and, 3) individuals under 24 years of age (n 1,820). Univariate and bivariatedescriptions below (Tables 1 and 2) represent all household groups. In these tables anddescriptions, it is important to note that a variable associated with a head of household mayapply to all members of that household, which may skew the data in that characteristics ofhouseholds with more than one affiliated individual will be given more weight. Tables 3-11,alternatively, describe prior residence and exit destination for all three household groups.Logistic regressions are run on all clients with family group type included in the model as acovariate.As shown in Table 1, a majority of the study sample (66.7%) were Black, followed by 29.8%White, 0.6% American Indian or Alaska Native (AI/AN), 0.6% Asian, 0.8% Native Hawaiian orOther Pacific Islander, and 1.8% identifying as Two or More Races. Just over eleven percent(11.2%) of clients identified as Hispanic/Latinx. The study sample was 52.5% men, 47.3%women, and 0.2% transgender. The average age was 32 years (Mean 32.32, SD 19.94)ranging from newborn to 90 years. Exactly 12% (12.0%) of individuals reported being a veteranSPARC Dallas Report10
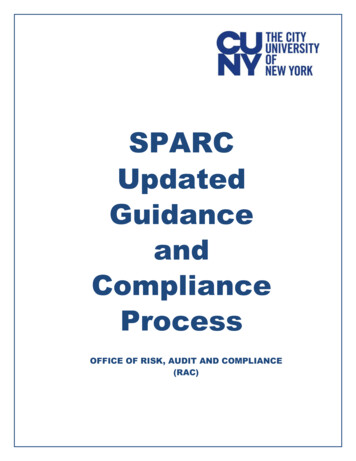
and 36.8% reported having a disabled condition. Note that the number of valid cases for eachvariable varies slightly.Table 1.Demographics of all individuals in Dallas Continuum of Care, fiscal years 20112016. (N 7White6,94429.8American Indian or Alaska Native (AI/AN)1410.6Asian1420.6Native Hawaiian or Other Pacific Islander (NHOPI)1190.5Two or More Male12,25552.5Transgender (male to female)46.2Transgender (female to atinxDoesn’t Know/Refused/MissingGenderAgeAverage Years (SD)32.32(19.94)Veterans g ConditionNote: Frequencies of some characteristics may not add up to total n due tomissing cases.How do the racial demographics of people experiencing homelessness compare to those inpoverty and the general population?Table 2 shows a comparison, by race, of ACS general population distribution, povertythreshold distribution, and HMIS and point in time (PIT) homeless counts. Though the Blackpopulation in Dallas constitutes only 18.7% of the total population, this group isSPARC Dallas Report11
overrepresented among people living in poverty (at both the 100% and 50% poverty threshold,at 26.0% and 30.7%, respectively) and among people experiencing homelessness by both theHMIS and PIT counts (66.7% and 60.2%, respectively). On the other hand, Whites constitute63.2% of the total population but are underrepresented in both poverty groups (53.5% and49.5%, respectively) and more drastically underrepresented among the homeless populationcounts, representing only 29.8% of the HMIS sample and 33.1% of the PIT sample. Asians areslightly underrepresented in poverty and homelessness, and individuals identifying as NHOPI(Native Hawaiian or Pacific Islander) and Two or More Races have generally proportionaterepresentation across poverty and homelessness counts.Individuals identifying as Hispanic/Latinx (of any race) are overrepresented in poverty counts,especially in 100% poverty group, constituting half (49.9%) of this group while onlyrepresenting 33.0% of the total population. However; Hispanic/Latinx individuals wereunderrepresented in homelessness counts, constituting only 11.2% of the HMIS sample and13.2% of the PIT counts.Table 2.Total population, poverty distribution, HMIS, and PIT by race.RaceACS a,%100% povertyb, %50% NHOPI0.10.00.00.50.7Two or More Races2.73.23.11.84.033.049.940.211.213.2Hispanic or LatinxabcdHMIS, %PITd,%ACS 2015 5yr EstimateACS 5yr 2015 - 100% poverty lineACS 5yr 2015 – 50% poverty line (deep poverty)2016 Point in Time homelessness countHow do racial demographics of people experiencing homelessness relate to “prior livingsituation” at program entry?We sought to understand the locations of clients prior to program entry and at final programexit (if program exit occurred as of the end of FY 2016). For the purposes of this report,“program entry” is defined as the first program entry in the dataset for each individual.“Program exit” is defined by last exit in the dataset for each individual where an exit locationwas identified. Tables 3-5 show residence prior to program entry by race for the followingSPARC Dallas Report12
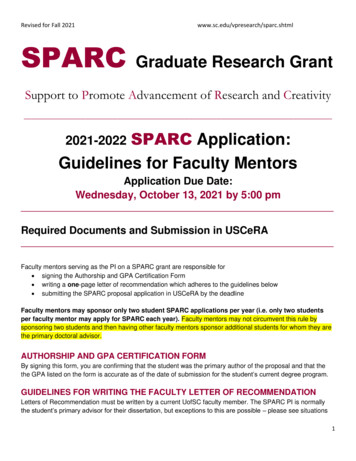
three client samples: individuals in households; individuals younger than 24 years of age, andindividuals 24 years of age and older.Table 3 below shows the distribution by race and ethnicity of the prior living situation ofindividuals in households. Of note, the majority (57.6%) of all cases came from an “other”category,9 16.5% came from “permanent housing, no subsidy”, and 12.1% came from ahomeless situation. Black families were slightly underrepresented in the “permanent housing,no subsidy” location (61.6%). Conversely, White and Hispanic/Latinx individuals were slightlyoverrepresented in the “permanent housing, no subsidy” location (36.0% and 16.5%,respectively).Table 3.Living situation prior to program entry by race for individuals in households (N 10,447)(percent within location)*Race/EthnicityTwo orBlackWhiteAI/ANAsianNHOPIMoreHispanicRacesor LatinxPercent withinprior .%situationPermanenthousing, subsidyPermanenthousing, nosubsidyInstitutional careCorrectionalfacilityDoubled y*Percent totals across race and ethnicity will not equal 100% because ethnicity is not mutually exclusive from race.9The high use of “Other” may be due to site-specific, programmatic data entry decisions. More research into how programs useHMIS categories is needed to better understand this finding.SPARC Dallas Report13
Table 4 below shows the distribution by race and ethnicity of the prior living situation ofindividuals under 24 years of age. In contrast to individuals in households, only 1.9% camefrom an “other” living situation. The most common prior living situation for this group was“doubled up” (48.3%), followed by homelessness (21.3%) and institutional care (16.8%). Acrossthe “doubled up” experience, race/ethnicity groups were generally proportional, thoughHispanic/Latinx were slightly overrepresented (24.6%). Whites disproportionately came fromthe “institutional care” location, representing 61.1% compared to only 43.0% of this sample.Whites and Hispanic/Latinx individuals were slightly overrepresented in the homeless category.For those individuals coming from a homeless situation, White and Hispanic/Latinx individualswere underrepresented (35.4%), while Blacks were slightly overrepresented (57.6%).Table 4.Living situation prior to program entry by race for individuals under 24 years of age (N 1,825)(percent within location)*Race/EthnicityTwo orBlackWhiteAI/ANAsianNHOPIPercentMoreHispanic orwithin priorRacesLatinxlivingsituationPrior nthousing,subsidyPermanenthousing, led upTransitionalsettingOtherPercent withinrace category* Percent totals across race and ethnicity will not equal 100% because ethnicity is not mutually exclusive from race.SPARC Dallas Report14
Table 5 below shows the distribution by race and ethnicity of the prior living situation ofindividuals 24 years of age and older. For this group, the vast majority of individuals came fromhomelessness (57.4%), followed by “permanent housing, no subsidy” (11.8%) and “doubledup” (11.1%). Across prior living situations, racial and ethnic groups were relativelyproportionally represented. The most significant burdens are within the “doubled up” location,where Black individuals were slightly overrepresented (68.8%) and in the “permanent housing,no subsidy” location where Hispanic/Latinx individuals were overrepresented (12.4%).Table 5.Living situation prior to program entry by race for individuals 24 years of age and older (N 10,605)(percent within location)*Race/EthnicityTwo sor Latinxwithin priorlivingsituationPrior ng,subsidyPermanenthousing, led upTransitionalsettingOtherPercent within racecategory*Percent totals across race and ethnicity will not equal 100% because ethnicity is not mutually exclusive from race.SPARC Dallas Report15
How do racial demographics of people experiencing homelessness relate to “destination” atprogram exit?Table 6 shows the distribution by race and ethnicity of the exit destination of individuals inhouseholds. The majority exit into “permanent housing, no subsidy” (39.5%) or “other”(35.6%), with 11.5% exiting into “permanent housing with
SPARC DALLAS Initial Findings from Quantitative and Qualitative Research March 16, 2018 This document was prepared by the Center for Social Innovation (C4) in Needham, MA for Metro Dallas Homeless Alliance in Dallas, TX Authors: Marc Dones Molly Richard Maya Beit-Arie Catriona Wilkey Svetlana Yampolskaya Jeffrey Olivet, Principal Investigator