Transcription
Westlake CorporationFourth Quarter 2021Earnings PresentationFebruary 22, 2022
Westlake Corporation 2021 HighlightsBusiness Highlights Record fourth quarter and full-year 2021 results for sales, net income and EBITDA Re-segmentation of business to provide greater clarity and enhanced reporting of all businesses Housing and Infrastructure Products segment EBITDA of 534 million for 2021 Performance and Essential Materials segment EBITDA of 3,247 million for 2021 Announce 3.8 billion of acquisitions transforming business mix and company profile Establish 2030 sustainability goal to reduce CO2 intensity of operations by 20% with a 2016 baseline2Reconciliations of EBITDA to the applicable GAAP measures can be found on pages 14 and 15.
Re-segmentation to Provide Greater ClarityRe-segmentation provides transparency for the Housing and Infrastructure Products segment (“HIP”) and the Performanceand Essential Materials segment (“PEM”).New SegmentationPerformance andEssential MaterialsHousing andInfrastructure ProductsPerformance MaterialsHousing Products Westlake North American Vinyls Westlake Polyethylene Westlake Epoxy Westlake Royal Building Products Westlake Pipe and Fittings –residential Westlake Global Compounds –residential Westlake DimexEssential MaterialsInfrastructure Products Westlake North American Chlor-alkali& Derivatives Westlake European & AsianChlorovinyls Westlake Olefins Westlake Pipe and Fittings –infrastructure Westlake Global Compounds –infrastructureYear End2021Westlake CorporationNet external salesIncome from operationsNet incomeEBITDAEBITDA margin 11,778 2,800 2,015 3,69331%Performance and Essential MaterialsSegmentNet external salesIncome from operationsEBITDAEBITDA margin 8,670 2,549 3,24737%Housing and Infrastructure ProductsSegmentNet external salesIncome from operationsEBITDAEBITDA margin 3,108 356 53417%3
Advancing SustainabilityWestlake Sets 2030 Carbon Dioxide Reduction GoalWestlake has set a goal of reducing Scope 1 and Scope 2 CO2 emissions rate¹ by 20% by 2030. To achieve this goal,Westlake will act to reduce the carbon intensity of operations by focusing on the optimal feedstocks for energy as wellas manufacturing processes.Sustainability GovernanceIn February 2021, the Board amended the charter of theBoard’s Corporate Risk Committee, changing its name tothe Corporate Risk and Sustainability Committee. TheCommittee’s scope of responsibilities includeenvironmental, health and safety, social responsibilitiesWestlake has an executive level role, Vice President —Sustainability, providing oversight and coordination to themany ESG activities being done on an enterprise basisacross Westlake and is responsible for ensuring that wedeliver on goals and targets that we set.(1)Scope 1 and Scope 2 CO2 emissions per ton of production against a 2016 baseline4
Westlake Corporation PerformanceFourth Quarter and Full Year 20214Q 2021 3,5073Q 2021 3,055Operating Income 873Net IncomeHousing and Infrastructure Products EBITDAPerformance and Essential Materials EBITDACorporate EBITDA( in millions)SalesEBITDA¹4Q 2021 vs.3Q 20214Q 2021 vs.4Q 202015% 8611% 178390% 2,800 429553% 644 6076% 113470% 2,015 330511% 162 997( 28) 137 946( 6)18%5%- 99 314( 27)64%218%- 534 3,247( 88) 388 898( 40)38%262%- 1,131 1,0775% 386193% 3,693 1,246196%78%YTD 2021 YTD 2020 11,778 7,504YTD 2021 vs.YTD 20204Q 2020 1,96557%A Record Year for Westlake Continuing global economic expansion resulted in strong markets for our products and businesses,contributing to solid margins Westlake’s leading market positions and integration captures the value chain margins across our businessesThrough innovation, Westlake provides differentiated specialty products and solutions Record annual net sales of 11.8 billion, a 57% increase vs. 2020 net sales Record annual net income of 2.0 billion, a 511% increase vs. 2020 net income Record annual EBITDA of 3.7 billion, a 196% increase vs. 2020 EBITDA(1)Reconciliations of EBITDA, Housing and Infrastructure Products EBITDA, Performance and Essential Materials EBITDA and Corporate EBITDA to theapplicable GAAP measures can be found on pages 14 and 155
Housing and Infrastructure Products (“HIP”)Segment Performance( in millions)Housing Products SalesInfrastructure Products SalesTotal HIP SalesOperating IncomeEBITDA4Q 2021 843 204 1,0473Q 2021 536 197 733 86 162 103 1374Q 2021 vs.3Q 202157%4%43%4Q 2020 390 142 532(17%)18% 65 994Q 2021 vs.4Q 2020116%44%97%32%64%YTD 2021 YTD 2020 2,334 1,497 774 542 3,108 2,039 356 534YTD 2021 vs.YTD 2020 256 38856%43%52%39%38% With demographics driving household formation, paired with underbuilding of homes since the 2007- 2009recession, led to a significant deficit in available homes. Undersupply of housing drives strong building,repair and remodeling and infrastructure fundamentals Anchored by robust demand in U.S., repair and remodeling activity and the highest level of residentialconstruction starts in over a decade, Westlake’s HIP business benefited from these macro trendsHIP Segment4Q 2021 vs. 3Q 2021(1)HIP Segment4Q 2021 vs. 4Q 2020Average SalesPriceVolumeAverage SalesPriceVolume 10.9% 31.7% 46.7% 50.0%Reconciliations of EBITDA to the applicable GAAP measure can be found on page 156
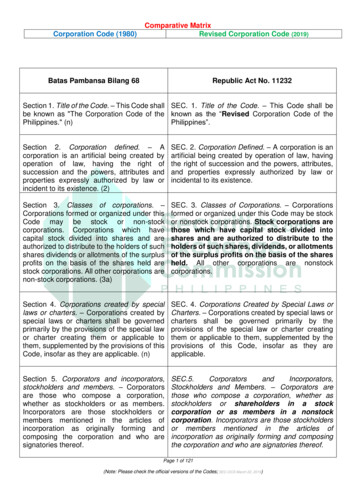
Housing and Infrastructure Products OverviewSegment Commentary Leading market positions with well-established high value brands to serve theresidential repair and remodeling and new construction markets With a strong correlation between housing starts and building products,Westlake is well situated to benefit from this continuing trend Westlake Dimex serves demand for sustainable consumer productsIndustry Outlook Favorable demographics with increasing percentage of the U.S. population tobe in household formation years Residential construction drives associated demand for infrastructure products Underbuilding of home and associated lack of supply drives repair andremodeling spending to meet housing deficitAnnual Housing Starts¹ (thousands)2,500Over Decade of Underbuilding Supports Strong Future Not seasonally adjusted monthly total residential starts (source: U.S. Census Bureau)2006200920122015201820217
Westlake’s Leading Portfolio of Housing ProductsBuilding a Leading Brand Westlake’s leading portfolio of brands provide broad range ofproducts to serve residential customers Westlake Royal Building Products provides residential siding, trimand molding, stone, roofing and window though a number ofindustry-leading brands to offer a full compliment of interior andexterior resources for the home Westlake Dimex offers a variety of consumer products including topquality brands No-Dig Landscape Edging MotionTex FitnessEquipment Mats, and GrillTex Under the Grill Protective Deck andPatio Mats8
Performance and Essential Materials (“PEM”)Segment Performance( in millions)Performance Materials SalesEssential Materials SalesTotal PEM SalesOperating IncomeEBITDA4Q 2021 1,664 796 2,4603Q 2021 1,588 734 2,322 821 997 769 9464Q 2021 vs.3Q 20215%8%6%4Q 2020 953 480 1,4337%5% 143 3144Q 2021 vs.4Q 202075%66%72%474%218%YTD 2021 YTD 2020 5,997 3,428 2,673 2,037 8,670 5,465 2,549 3,247 231 898YTD 2021 vs.YTD 202075%31%59%1,003%262% Residential construction drove strong demand and pricing for PVC in downstream markets Polyethylene realized strong demand dynamics and robust strength in pricing while experiencing supplyconstraints throughout the yearThe global economic expansion drove demand in consumer and industrial packaging as well asmanufacturing activity throughout 2021 and Westlake experienced strong demand for caustic soda andpolyethylene resulting in healthy marginsPEM Segment4Q 2021 vs. 3Q 2021(1)PEM Segment4Q 2021 vs. 4Q 2020Average SalesPriceVolumeAverage SalesPriceVolume 7.3%-1.3% 61.9% 9.8%Reconciliations of EBITDA to the applicable GAAP measure can be found on page 159
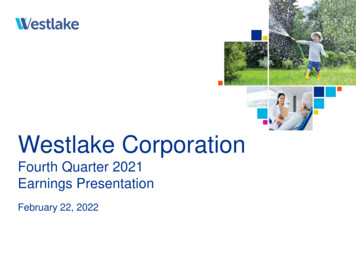
Performance and Essential Materials OutlookSegment Commentary As a highly integrated, global leader in chlorovinyls, Westlake is well-positionedto benefit from higher margins over the cycle throughout the value chain PVC supply/demand fundamentals remain strong with the growth in demandhigher than the limited supply increases Westlake benefits from globally competitive feedstocks and power costs To meet the needs of customers, Westlake creates formulated products thatsupport the medical, food packaging and other specialty needs markets Epoxies expand Westlake’s essential materials business into attractive globalhigh-growth, innovative, and sustainably oriented end-use marketsWestlake Produces Specialty PEto Create Value for Customers6 Westlake produces Specialty PE to meet customer needs to drive value3Industry Outlook Global growth in PVC demand is forecasted to continue into the future, drivenby robust end use markets, particularly the North American housing market /lbAverage premium forspecialty PE overcommodity PE02017-2021Average Strength in consumer, industrial and packaging end-markets remains verypositive Outlook for caustic soda demand growth outpaces industry capacity additionsover the next several years(1)Chart reflects a mix of both specialized and differentiated products for LDPE and LLDPE10
A Sustainable Future - Developing Green Productsand Reducing CO2 Emission Intensity 20% by 2030¹Developing Green ProductsWestlake offers certified climate-friendly products, GreenVin CausticSoda, and GreenVin PVC, which utilize renewable energy and have alower CO2 footprint compared to conventional caustic soda and PVC.Westlake offers PVC Oriented Pipe (“PVCO”), which is PVC pipe thatuses less material while delivering the enhanced strength and capabilitiesof traditional PVC pipes.Epoxy business allows us light-weighting products to create low impactsolutions.Westlake Dimex is one of the largest processors of post-industrial recycledplastic material with a variety of consumer products.Westlake and Nexii announced alliance to support sustainable buildingWe are continuing to develop products that are in line with oursustainability goals.Participating in Multi-Industry Associations for Environmental ProtectionWestlake is a proud partner with the following organizations to drive sustainable action to eliminate plastic waste, capturemore flexible food packaging waste for recycling and support vinyls’ sustainable impact in the world, along with many otherinitiatives.(1)Baseline of 201611
Financial Reconciliations
Consolidated Statements of OperationsThree monthsended September30,2021Three months ended December 31,2021Twelve months ended December 31,202020212020(In millions of dollars, except per share data)Housing and Infrastructure Products Sales 733 1,047 532 3,108 2,039Performance and Essential Materials Sales2,3222,4601,4338,6705,465Net sales3,0553,5071,96511,7787,504Cost of sales2,0372,4111,6428,2836,481Gross 123109Selling, general and administrative expensesAmortization of intangiblesRestructuring, transaction and integration-related costsIncome from operationsInterest expenseOther income, netIncome before income taxesProvision for (benefit from) income taxesNet incomeNet income attributable to noncontrolling interestsNet income attributable to Westlake 6206611232,0703731317105543 607 644 113 2,015 330Basic 4.71 5.01 0.87 15.66 2.57Diluted 4.69 4.98 0.87 15.58 2.56Earnings per common share attributable to Westlake Corporation:13
Reconciliation of EBITDA to Net Income, Income fromOperations and Net Cash Provided by Operating ActivitiesThree monthsended September30,2021Twelve months ended December31,Three months ended December 31,2021202020212020(In millions of dollars)Net cash provided by operating activities Changes in operating assets and liabilities and other755 757 431 2,394 1,297(109)(123)(316)(301)(778)Deferred income taxes(26)278(23)(146)Net income6206611232,0703731318125344Less:Other income, netInterest expenseBenefit from (provision for) income taxesIncome from epreciation and amortizationOther income, netEBITDA 1,077 1,131 386 3,693 1,24614
Reconciliation of HIP, PEM and Corporate EBITDA toApplicable Operating Income (Loss)Three months endedSeptember 30,Three months ended December 31,20212021Twelve months ended December 31,202020212020(In millions of dollars)Housing and Infrastructure Products EBITDALess:Depreciation and AmortizationOther Income (Expenses)Housing and Infrastructure Products Operating Income (Loss) 137 162 99 534 388341037068633165168103561284256Performance and Essential Materials EBITDALess:Depreciation and AmortizationOther Income Performance and Essential Materials Operating Income (Loss)7698211432,549231Corporate EBITDALess:Depreciation and AmortizationOther Income (Expenses)Corporate Operating Income )810(58)Housing and Infrastructure Operating Income (Loss)1038665356256Performance and Essential Materials Operating Income (Loss)7698211432,549231Corporate Operating Income (Loss)(11)(34)(30)(105)(58)Total Operating Income (Loss) 861 873 178 2,800 42915
Quarterly Industry Pricing
Average Quarterly Industry Pricesand Housing StartsQuarter EndedDecember 31,2020March 31,2021June 30,2021September 30,2021December 31,2021Average domestic prices (1)Natural Gas ( /MMBtu) (2)Ethane (cents/lb) (3)Propane (cents/lb) (4)Ethylene (cents/lb) (5)Polyethylene (cents/lb) (6)Styrene (cents/lb) (7)Caustic soda ( /short ton) (8)Chlorine ( /short ton) (9)PVC (cents/lb) 492.084.8920563114.3Average export prices (1)Polyethylene (cents/lb) (11)Caustic soda ( /short ton) (12)PVC (cents/lb) ousing Starts (In thousands of units)Housing Starts – Actual quarterly starts (14)Housing Starts – Seasonally Adjusted Annual Rate (15)1)2)3)4)5)6)7)8)9)10)11)12)13)14)15)Industry pricing data was obtained through IHS Markit ("IHS"). We have not independently verified the data.Average Burner Tip contract prices of natural gas over the period.Average Mont Belvieu spot prices of purity ethane over the period.Average Mont Belvieu spot prices of non-TET propane over the period.Average North American spot prices of ethylene over the period.Average North American Net Transaction prices of polyethylene low density GP-Film grade over the period.Average North American contract prices of styrene over the period.Average USGC-CSLi index values for caustic soda over the period. As stated by IHS, "the caustic soda price listing represents the USGC-CSLi values. USGC-CSLi does not reflect contract price discounts,implementation lags, caps or other adjustments factors. Additionally, it is not intended to represent a simple arithmetic average of all market transactions occurring during the month. Rather, the USGC-CSLi ismost representative of the month-to-month caustic soda price movement for contract volumes of liquid 50% caustic soda rather than the absolute value of contract prices at a particular point in time. It isintended to serve only as a benchmark."Average North American contract prices of chlorine over the period.Average North American contract prices of pipe grade polyvinyl chloride ("PVC") over the period. As stated by IHS, "the contract resin prices posted reflect an "index" or "market" for prices before discounts,rebates, incentives, etc."Average North American export price for low density polyethylene GP-Film grade over the period.Average North American low spot export prices of caustic soda over the period.Average North American spot export prices of PVC over the period.Quarterly Single and Multi-family Starts data per the U.S. Census Bureau – February 17, 2022 report.Quarterly Average Single and Multi-family Seasonally Adjusted Annual Rate data per the U.S. Census Bureau – February 17, 2022 report.17
Safe Harbor LanguageThis presentation contains certain forward-looking statements including statements regarding creating value for our shareholders, pricing and demandfor our products, continued recovery in key end markets, industry outlook for both of our segments, our cost control and efficiency efforts, our ability todeliver end-use building products to consumers, our ability to capture integrated chain margin, our development of additional green products in thefuture, our sustainability goals and commitments and our reduction in carbon impact. Actual results may differ materially depending on factors,including, but not limited to, the following: the effects of our recently completed acquisitions, including our future financial condition, results ofoperations, strategy and plans; and expected synergies and other benefits from the acquisitions and our ability to realize such synergies and otherbenefits; general economic and business conditions; the cyclical nature of the chemical and building products industries; the availability, cost andvolatility of raw materials and energy; uncertainties associated with the United States, European and worldwide economies, including those due topolitical tensions and unrest in the Middle East and elsewhere; uncertainties associated with pandemic infectious diseases, particularly COVID-19;current and potential governmental regulatory actions in the United States and other countries; industry production capacity and operating rates; thesupply/demand balance for our products; competitive products and pricing pressures; instability in the credit and financial markets; access to capitalmarkets; terrorist acts; operating interruptions (including leaks, explosions, fires, weather-related incidents, mechanical failure, unscheduleddowntime, labor difficulties, transportation interruptions, spills and releases and other environmental risks); changes in laws or regulations, includingtrade policies; technological developments; foreign currency exchange risks; our ability to implement our business strategies; creditworthiness of ourcustomers; and other factors described in our reports filed with the Securities and Exchange Commission. Many of these factors are beyond ourability to control or predict. Any of these factors, or a combination of these factors, could materially affect our future results of operations and theultimate accuracy of the forward-looking statements. These forward-looking statements are not guarantees of our future performance, and our actualresults and future developments may differ materially from those projected in the forward-looking statements. Management cautions against puttingundue reliance on forward-looking statements. Every forward-looking statement speaks only as of the date of the particular statement, and weundertake no obligation to publicly update or revise any forward-looking statements.Investor Relations ContactsSteve BenderExecutive Vice President &Chief Financial OfficerWestlake Corporation2801 Post Oak Boulevard, Suite 600Houston, Texas 77056713-960-9111Jeff HolyVice President &Treasurer18
Westlake Sets 2030 Carbon Dioxide Reduction Goal Westlake has set a goal of reducing Scope 1 and Scope 2 CO 2 emissions rate¹ by 20% by 2030. To achieve this goal, Westlake will act to reduce the carbon intensity of operations by focusing on the optimal feedstocks for energy as well as manufacturing processes. 4 (1) Scope 1 and Scope 2 CO