Transcription
1Appendix A: Brief Guide toMicrosoft Project 2010fromRevised An Introduction to ProjectManagement, Third EditionByKathy SchwalbeProfessor, Augsburg CollegeDepartment of Business AdministrationMinneapolis, Minnesota
2Appendix A: Brief Guide to Microsoft Project 2010fromRevised An Introduction to Project Management, Third EditionReviewers/EditorsRay GuidoneCarl HixonCindy DawsonBrian MayCover PhotoDan Schwalbe 2010 Kathy Schwalbe, LLCALL RIGHTS RESERVED. No part of this work covered by the copyright hereon maybe reproduced, transmitted, stored, or used in any form or by any means graphic,electronic, or mechanical, including but not limited to photocopying, recording, scanning,digitizing, taping, Web distribution, information networks, or information storage andretrieval systems, except as permitted under Section 107 or 108 of the 1976 United StatesCopyright Act, without the prior written permission of the author.Microsoft and the Office logo are either registered trademarks or trademarks ofMicrosoft Corporation in the United States and/or other countries.Some of the product names and company names used in this book have beenused for identification purposes only and may be trademarks or registered trademarks oftheir respective manufacturers and sellers.Published by Kathy Schwalbe, LLCVisit www.kathyschwalbe.com for more information on this and other books by KathySchwalbe.Note: This text only includes Appendix A, Brief Guide to Microsoft Project 2010. Thepage numbering is the same as the original text. It was created in April 2010.
3Appendix A .Brief Guide to Microsoft Project 2010Introduction . 1Project Management Software Reviews . 1Basic Features of Project Management Software . 4What’s New in Project 2010 . 5Using Project 2010. 6Exploring Project 2010 Using an Existing File . 10Creating a New File and Entering Tasks in a Work Breakdown Structure . 19Developing the Schedule . 29Project Cost and Resource Management . 44Viewing Earned Value Management . 55Integrating Project 2010 with Other Applications . 56Discussion Questions . 60Exercises . 60Companion Web Site . 62End Notes . 62
4APPENDIX A:Project ManagementSoftware:Brief Guide to MicrosoftProject 2010Note: This guide was written using the Beta release of Project 2010 and WindowsXP. Your screens may appear slightly different. You can download a free trial ofProject 2010 from www.microsoft.com/project. You can access the older versionof this guide based on Project 2007 on the companion Web site atwww.intropm.com. Students who purchased an older version of this text (AnIntroduction to Project Management, Third Edition, by Kathy Schwalbe) canpurchase just this new Appendix from www.intropm.com. Instructors can accessthe latest guide based on Project 2010 on the instructor site.
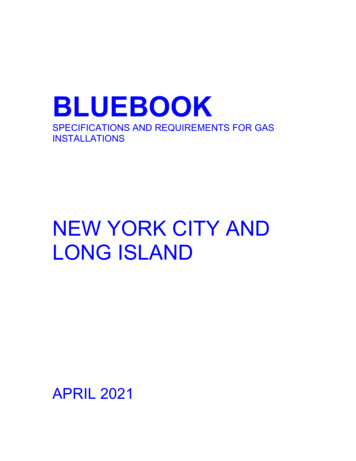
1INTRODUCTIONThere are hundreds of project management software products on the market today.Unfortunately, many people who own the software have no idea how to use it. It isimportant to understand basic concepts of project management, such as creating a workbreakdown structure, determining task dependencies, and so on before making effectiveuse of this software. Many project teams still use spreadsheets or other familiar softwareto help manage projects. However, if you can master a good project managementsoftware tool, it can really help in managing projects. This appendix summarizes basicinformation on project management software in general. It also provides a brief guide tousing Microsoft Office Project 2010 (often referred to as Project 2010), the latest versionof the most widely used product. Appendix B provides a brief summary of @task, themost popular totally online tool.PROJECT MANAGEMENT SOFTWARE REVIEWSFigure A-1 provides a screen shot showing the top ten project managementsoftware products based on a June 2009 review by TopTenREVIEWS . The productslisted in the top ten include:1. Microsoft Project2. MindView3. Project KickStart4. RationalPlan Multi Project5. FastTrack Schedule6. Service Desktop Pro7. Milestones8. MinuteMan9. FusionDesk Professional10. VIP Team To Do ListNotice that Microsoft Project is number one on the list. Also notice its steep priceof over 500 for a single user. Remember that students can purchase Microsoft Projectand other software at greatly reduced rates from sites such as www.journeyed.com (only 69.98 for Project 2007 Standard in July 2009). You can also normally download freetrials of Project and other software products.
2Figure A-1. Top ten project management software product comparisonsBelow are descriptions of the criteria for comparing the software products: Collaboration: How information and issues are communicated with projectteam members, including email, conference calls, meetings, web-basedlocations and more. Collaboration should be easy to use.Resource Management: Project management software should manageand control the resources needed to run a project, such as people, money,time and equipment.Project Management: The process, practice and activities needed toperform continuous evaluation, prioritization, budgeting and selection ofinvestments are key. Proper project management capabilities provide thegreatest value and contribution to the strategic interest of your company.Ease of Use: All project management software has a learning curve, but thebest have functions that are easy to find and simple enough for anyone to usefrom Day 1, Project 1.Help/Support: Project management software should offer a comprehensiveuser guide and help system. The manufacturer should provide emailaddresses or telephone numbers for direct answers to technical questions. 1In addition to reviewing project management software in general,TopTenREVIEWS also compared online products in a separate category. These
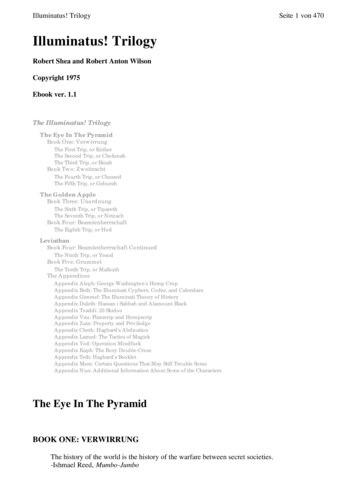
3products require an Internet connection for use. Figure A-2 lists the top ten results. Thetop fourteen products listed include:1. @task2. Daptiv PPM3. Clarizen4. Project Insight5. Celoxis6. Intervals7. Projecturf8. Central Desktop9. Easy Projects NET10. eStudio11. Project Office.net12. Copper13. Smooth Projects14. Zoho Projects@task took the number one spot. Like most tools in this category, @taskprovides the ability to create Gantt charts, numerous reports and views, projectdashboards, and it provides integration with Microsoft Project files. One of its uniquefeatures is its support of iPhones. See End Note 1 or visit the Web sites for any of theseproducts and use a free trial version. See Appendix B for more information on using@task.
4Figure A-2. Top ten online project management product comparisonsBASIC FEATURES OF PROJECT MANAGEMENTSOFTWAREWhat makes project management software different from other software tools? Why notjust use a spreadsheet or database to help manage projects?You can do a lot of project management planning and tracking using non-projectmanagement software. You could use a simple word processor to list tasks, resources,dates, and so on. If you put that information into a spreadsheet, you can easily sort it,graph it, and perform other functions. A relational database tool could provide even moremanipulation of data. You can use email and other tools to collaborate with others.However, project management software is designed specifically for managing projects, soit normally includes several distinct and important features not found in other softwareproducts: Creating work breakdown structures, Gantt charts, and network diagrams: Asmentioned in this text, a fundamental concept of project management is breakingdown the scope of the project into a work breakdown structure (WBS). The WBSis the basis for creating the project schedule, normally shown as a Gantt chant.The Gantt chart shows start and end dates of tasks as well as dependenciesbetween tasks, which are more clearly shown in a network diagram. Projectmanagement software makes it easy to create a WBS, Gantt chart, and network
5diagram. These features help the project manager and team visualize the projectat various levels of detail. Integrating scope, time, and cost data: The WBS is a key tool for summarizingthe scope of a project, and the Gantt chart summarizes the time or schedule for aproject. Project management software allows you to assign cost and otherresources to tasks on the WBS, which are tied to the schedule. This allows you tocreate a cost baseline and use earned value management to track projectperformance in terms of scope, time, and cost in an integrated fashion. Setting a baseline and tracking progress: Another important concept of projectmanagement is preparing a plan and measuring progress against the plan. Projectmanagement software lets you track progress for each task. The tracking Ganttchart is a nice tool for easily seeing the planned and actual schedule, and otherviews and reports show progress in other areas. Providing other advanced project management features: Project managementsoftware often provides other advanced features, such as setting up differenttypes of scheduling dependencies, determining the critical path and slack fortasks, working with multiple projects, and leveling resources. For example, youcan easily set up a task to start when its predecessor is halfway finished. Afterentering task dependencies, the software should easily show you the critical pathand slack for each task. You can also set up multiple projects in a program andperform portfolio management analysis with some products. Many projectmanagement software products also allow you to easily adjust resources withintheir slack allowances to create a smoother resource distribution. These advancedfeatures unique to project management are rarely found in other software tools.As you can see, there are several important features that are unique to projectmanagement software that make them worth using. Next you’ll learn what’s new inProject 2010 and how to use basic features of Project 2010 Standard.WHAT’S NEW IN PROJECT 2010Project 2010 is not just a run-of-the-mill update. Microsoft really listened to usersand has revised Project to meet user needs. Learning some of the new featuresmight seem like a chore, but it is well worth the effort.If you are familiar with Project 2007, it may be helpful to review some of thenew features in Project 2010. Improved user interface: Project 2010 now includes the “ribbon” interfaceinstead of using the old menus and toolbars similar to Office 2003.Commands are organized in logical groups under tabs, such as File, Task,Resource, Project, View, and Format. The File tab takes you to the newBackstage feature, a one-stop graphical destination for opening, saving, andprinting your files. You can also now right-click on different items, like atable cell or chart, to bring up commonly used commands quickly.
6 New viewing options: Project 2010 includes several new views. A timelineview is automatically displayed above other views to show you a conciseoverview of the entire project schedule. You can easily add tasks to thetimeline, print it, or paste it into an e-mail. The new team planner view letsyou quickly see what your team members are working on, and you can movetasks from one person to another using this view. For example, if a resourceis overallocated, you can drag a task to another resource to remove theoverallocation. You can also add new columns quickly and use the new zoomslider at the lower right of the screen to zoom your schedule in and out.Also, the tab for viewing and printing reports is easier to navigate with moreoptions for visual reports. Manual scheduling: Unlike previous versions of Project where tasks wereautomatically scheduled, Project 2010 uses manual schedule as its default. Inpast versions of Project, summary tasks were automatically calculated basedon their subtasks. Resources were also adjusted automatically. With Project2010, this is no longer the case. For example, you might want to enterdurations for summary tasks and then fill in the detailed information for theirsubtasks later. When you open a new file, Project reminds you that new tasksare manually scheduled and lets you easily switch to automatic scheduling, ifdesired. You can also use the new compare versions to see Gantt bars tomore clearly see how one version of a project differs from another version. Improved collaboration: Project 2010 is able to provide an interface with themost popular portals used in industry. Project now uses SharePoint insteadof Project Web Access for collaboration. Project Server 2010 also providesintegration with Microsoft Exchange 2010 to enable team members tomanage and report on tasks directly from Microsoft Outlook. Remember thatProject Standard does not include these collaboration features. You musthave Project Professional and Project Server to use the enterprise features ofProject.Next, you will learn some basic information about Project 2010 and explore themain screen elements and Help facility.USING PROJECT 2010Before you can use Project 2010 or any project management software effectively,you must understand the fundamental concepts of project management, such as creatingwork breakdown structures (WBS), linking tasks, entering duration estimates, assigningresources, and so on. Make sure you read most of this text before using Project 2010 soyou understand these concepts. This text provides instructions for using the stand-aloneversion of Project 2010 known as Project Standard. Project Professional and theEnterprise version of Project require special server software to perform online andcollaborative functions. Consult Microsoft’s Web site for detailed information on otherproducts.
7Before You BeginThis appendix assumes you are using Project 2010 with Windows XP, Vista, or Windows7 and are familiar with other Windows-based applications. Check your work byreviewing the many screen shots included in the steps, or by using the solution files thatare available for download from the companion Web site for this text or from yourinstructor.NOTE: You need to be running Windows XP, Vista, or Windows 7 to use Project 2010. Itdoes not run on Macintosh computers or other operating systems. Most organizationshave Project 2010 as part of their license if they have Office 2010. You can download afree trial from www.microsoft.com/project. Students can purchase a full version ofProject Standard from sites like www.journeyed.com for around 69.This appendix uses a fictitious project—Project A —to illustrate how to use thesoftware. The WBS for Project A uses the five project management process groups aslevel 2 items (initiating, planning, executing, monitoring and controlling, and closing).Standard deliverables under each of those process groups are included, as described inthis text. Each section of the appendix includes hands-on activities for you to perform.NOTE: To complete the hands-on activities in the appendix, you will need to downloadfiles from the companion Web site for this text (www.intropm.com) to your computer.When you begin each set of steps, make sure you are using the correct file. Before youbegin your work you should have Customer Feedback.mpp file. Save the files you createyourself in a different folder so you do not write over the ones you download.In addition, you will create the following files from scratch as you work throughthe steps: wbs.mpp schedule.mppYou will also use the following file to create a hyperlink: stakeholder register.docNext you will learn how to start Project 2010, review the Help facility and atemplate file, and begin to plan Project A .Overview of Project 2010The first step to mastering Project 2010 is to become familiar with the major screenelements and the Help facility. This section describes each of these features.Starting Project 2010 and Understanding the Main ScreenElements
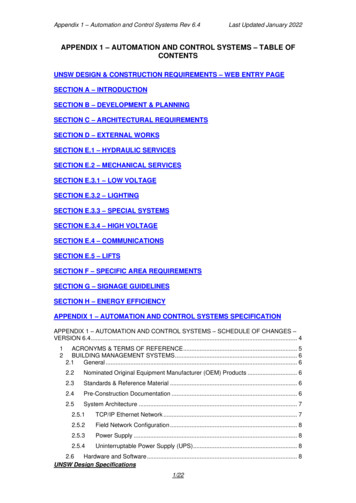
8To start Project 2010:1. Open Project 2010. Click the Start button on the taskbar, point to AllPrograms in Windows XP or Programs in Vista or Windows 7, point toMicrosoft Office, and then click Microsoft Office Project 2010.Alternatively, a shortcut or icon might be available on the desktop; in thiscase, double-click the icon to start the software.2. Maximize Project 2010. If the Project 2010 window does not fill the entirescreen as shown in Figure A-3, click the Maximize button in the upper-rightcorner of the window.Indicators columnTabsEntry tableGantt chart viewQuickAccessToolbarRibbonTimelineSplit barManual/automaticschedulingFigure A-3. Project 2010 main screenProject 2010 is now running and ready to use. Look at some of the elements ofthe screen. The Ribbon, tabs, and Quick Access toolbar are similar to other Office2007 or 2010 applications. The timeline view is displayed below the ribbon. The default manual scheduling for new tasks is on the lower left of thescreen. You can click that option to switch to automatic scheduling.
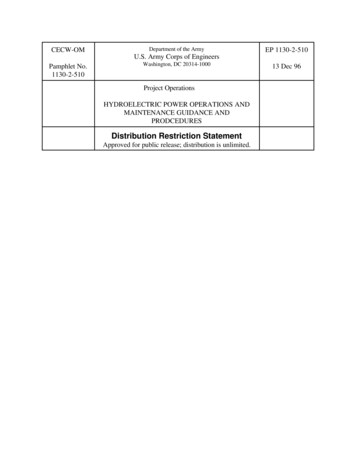
9 The default view is the Gantt chart view, which shows tasks and otherinformation as well as a calendar display. You can access other views byclicking the View command button on the far left side of the ribbon. The areas where you enter information in a spreadsheet-like table arepart of the Entry table. For example, you can see entry areas for TaskName, Duration, Start, and Finish. You can make the Entry table more or less wide by using the Split bar.When you move the mouse over the split bar, your cursor changes to theresize pointer. Clicking and dragging the split bar to the right revealsother task information in the Entry table, including Predecessors,Resource Names, and Add New columns. The column to the left of the Task Name column in the Entry table is theIndicators column. The Indicators column displays indicators or symbolsrelated to items associated with each task, such as task notes orhyperlinks to other files.Notice that when Project 2010 starts, it opens a new file named Project1, asshown in the title bar. If you open a second file, the name will be Project2, and so on,until you save and rename the file.Using Project Help and the Project Web SiteYou can access information to help you learn how to use Project 2010. Figure A4 shows the detailed list of topics available from Project Help. You can access help byPressing F1 or clicking on the question mark/help icon on upper right side of the ribbon.Remember this feature requires an Internet connection.Figure A-4. Topics under Project help
10Microsoft provides a number of resources on its Web site to help you learn howto use Project 2010. They provide product information, help and how-to guides onvarious versions of Project, training information, and templates. Microsoft’s Web site forProject 2010 (www.microsoft.com/project) provides files for users to download, casestudies, articles, and other useful materials. Figure A-5 shows a screen shot of this Website from March 2010. See the companion Web site for this text for updated informationon Project and other resources.Figure A-5. Microsoft Office Project web site (www.microsoft.com/project)Many features in Project 2010 are similar to ones in other Windows programs.For example, to collapse or expand tasks, click the appropriate symbols to the left of thetask name. To access shortcut items, right-click in either the Entry table area or the Ganttchart. Many of the Entry table operations in Project 2010 are very similar to operations inExcel. For example, to adjust a column width, click and drag or double-click between thecolumn heading titles.Next, you will get some hands-on experience by opening an existing file toexplore various screen elements. Project 2010 comes with several template files, and youcan also access templates from Microsoft Office Online or other Web sites.EXPLORING PROJECT 2010 USING AN EXISTINGFILETo open a file and adjust Project 2010 screen elements:1. Open an existing file. Click the File tab, then select Open, and browse tofind the file named Customer Feedback.mpp that you copied from the
11companion Web site for this text (www.intropm.com), and then double-click thefilename to open the file. (This file is a template file that comes with Project2007 where it is called Customer Feedback Monitoring.) Your screen shouldresemble Figure A-6.Task Note Need to widen columnSplit BarIndicatorFigure A-6. Customer Feedback.mpp file2. Widen the Task Name column. Move the cursor between the Task Name andDuration column, then double-click to widen the Task Name column so all of thetext shows.3. Move the Split Bar. Move the Split Bar to the right so only the entire TaskName column is visible.4. View the first Note. Move your mouse over the yellow Notes symbol in theIndicators column for Task 2and read its contents. It is a good idea to provide ashort note describing the purpose of project files.5. Add the Timeline and a task to it. Check the Timeline box under the Viewtab, Split View group. If you cannot see the entire project schedule, as shown inFigure A-7, click the Zoom button or Zoom slider to make adjustments. Click onthe Task Name for Task 12, click the Task tab, and then click the Add toTimeline button under the Properties group.
12Added taskOutlineZoomTimeline CheckboxTimelineNoteZoomSliderFigure A-7. Adjusted Customer Feedback.mpp fileTo show different WBS levels:1. Select Outline Level 1 to display WBS level 2 tasks. Click the Outlinebutton’s list arrow, and then click Outline Level 1. Notice that only the level 2WBS items display in the Entry table. The black bars on the Gantt chartrepresent the summary tasks. Recall that the entire project is normally referred toas WBS level 1, and the next highest level is called level 2. This view of the filealso shows one milestone task in row 45 indicating when the project wascompleted. Recall that the black diamond symbol on a Gantt chart showsmilestones.2. Expand a task. Click the expand symbol (the plus sign) to the left of Task 2,Develop Customer Feedback Collection Processes, to see its subtasks. Yourscreen should resemble Figure A-8. Click the collapse symbol (the minus sign)to hide its subtasks. Experiment with expanding and collapsing other tasks andresizing other columns.
13Summary TaskMilestoneExpand/CollapseSymbols( /-)Figure A-8. Showing part of the WBS on the Gantt chart3. Close the file without saving. Click the Close icon in the upper right of thewindow and select No when prompted to save the file.Project 2010 ViewsProject 2010 provides many ways to display or view project information. In addition tothe default Gantt chart, you can view the network diagram, calendar, and task usageviews, to name a few. These views allow you to analyze project information in differentways. The View tab also provides access to different tables that display information invarious ways. In addition to the default Entry table view, you can access tables that focuson data related to areas such as the Schedule, Cost, Tracking, and Earned Value.To access and explore different views:1. Explore the Network Diagram view in the Customer Feedback file. Openthe Customer Feedback file again. Click the Network Diagram button under theView tab, and then move the Zoom slider on the lower right of the screen all theway to the left. Your screen should resemble Figure A-9.
14Network Diagram ViewZoom SliderFigure A-9. Network diagram view of customer feedback file2. Explore the Calendar view. Click the Calendar button (under the NetworkDiagram button). Notice that the screen lists tasks each day in a calendar format.3. Examine columns in the Entry table. Click the Gantt Chart button, move thesplit bar to the right to see all of the available columns, and review theinformation provided in each column of the Entry table.4. Change the table view. Click the Tables button under the View tab, and thenclick Schedule. Figure A-10 shows the table view options.Figure A-10. Table view options
155. Examine the Table: Schedule and other views. Notice that the columns in thetable to the left of the Gantt chart, as shown in Figure A-11, now display moredetailed schedule information, such as Task Mode, Task Name, Start, Finish, LateStart, Late Finish, Free Slack, and Total Slack. Also notice that all of the text inthe Task Name column is not visible. Remember that you can widen the columnby double-clicking the resize pointer to the right of that column. You can alsomove the split bar to reveal more or fewer columns. Experiment with other tableviews, then return to the Table: Entry view.Figure A-11. Schedule table viewProject 2010 ReportsProject 2010 provides many ways to report project information as well. In addition totraditional reports, you can also prepare visual reports, with both available under theProject tab. Note that the visual reports often require that you have other Microsoftapplication software, such as Excel and Visio. Project 2010 automatically formats reportsfor ease of printing.To access and explore different reports:1. Explore the Reports feature. Click the Project tab, and then click theReports button. The Reports dialog box displays, as shown in Figure A-12.
16Figure A-12. Reports dialog box2. View the Project Summary report. Double-click Overview from the Reportsdialog box, and then double-click Project Summary in the Overview Reportsdialog box. Notice that Project 2010 switches to the Backstage (File tab) to makeit easy for you to print or share your report, as shown in Figure A-13.Figure A-13. Previewing the Project Summary report in the Backstage3. Examine the report and experiment with others. Move the mouse to the rightside of the screen to exam the report more closely. Notice that the insertion point
17now resembles a magnifying glass. Click inside the report to zoom in or zoomout. Click the Project tab again, and then experiment with viewing other reports.You will use several reports and other views later in this appendix.4. Close the Reports feature. Click Project tab to return to the Gantt chart view.You can close the file without saving it if you wish to take a break.Project 2010 FiltersProject 2010 uses a relational database to filter, sort, store, and display information.Filtering project information is very useful. For example, if a project includes thousandsof tasks, you might want to view only summary or milestone tasks to get a high-levelview of the project by using the Milestones or Summary Tasks filter from the Filter list.You can select a filter that shows only tasks on the critical path if that is what you want tosee. Other filters include Completed Tasks, Late/Overbudget Tasks, and Date Range,which displays tasks based on dates you provide. As shown earlier, you can also click theShow button on the toolbar to display different levels in the WBS quickly.To explore Project 2010 filters:1. Access filters. Click the View tab, if necessary, and make sure the CustomerFeedback file is in the Gantt Chart: Table Entry view. Click the Filter list arrow(under the Data group), as shown in Figure A-14. The default filter is No Filter,which shows all tasks.
18Filter list arrowFigure A-14. Using a filter2. Filter to show critical tasks. Click Critical in the list of filters. Widen theTask Names column, if needed, and move the split bar to see only that column.Notice that the Gantt chart only shows the critical tasks for the project. Yourscreen should resemble Figure A-15. Recall that the critical tasks are what drivethe schedule completion date.
19Figure A-15. Critical tasks filter applied3. Show summary tasks. Select No Filter from the Filter list box to reveal allthe tasks in the WBS again. Click the Filter list arrow, and then click SummaryTasks. Now only the summary tasks appear in the WBS. Experiment with otherfilters.4. Close the file. When you are finished reviewing the Customer Feedback file,click Close from the File menu or click the Close button. Click No when asked ifyou want to save changes.5. Exit Project 2010. Select Exit from the File tab or click the Close button forProject 2010.Now that you are familiar with the main screen elements, views, reports, andfilters, you will learn how to use Project 2010 to create a new file.CREATING A NEW FILE AND ENTERING TASKS INA WORK BREAKDOWN STRUCTURETo create a new Project 2010 file, you must first name the project, enter the start date,and then enter the tasks. The list of tasks and their hierarchy is the work breakdownstructure (WBS). The file you create could be used for a class project which lastsapproximately three months. It uses the project management process groups to organizetasks and includes several deliverables described in this text. You could also modify thisfile to meet your specific needs.
20NOTE: In this section, you will go through several steps to create a new Project201
Project 2010 is not just a run-of-the-mill update. Microsoft really listened to users and has revised Project to meet user needs. Learning some of the new features might seem like a chore, but it is well worth the effort. If you are familiar with Project 2007, it may be helpful to review s