Transcription
2017 Universal Life with SecondaryGuarantees SurveySurvey of Assumptions for Policyholder Behaviorin the TailJuly 2017
22017 Universal Life Secondary GuaranteesSurveySurvey of Assumptions for Policyholder Behavior in the TailAUTHORJeff HartmanCaveat and DisclaimerThe opinions expressed and conclusions reached by the authors are their own and do not represent any official position or opinion of the Societyof Actuaries or its members. The Society of Actuaries makes no representation or warranty to the accuracy of the information.Copyright 2017 All rights reserved by the Society of Actuaries
3Table of ContentsSurvey Highlights . 4Background . 7Parameters of Stochastic Capital Calculation . 8Tail Scenario . 11Lapse Assumptions . 19Lapses by Distribution System . 24Lapses by Premium Assumption . 26Mortality Assumptions . 32Critical Assumptions . 39
4Survey HighlightsIn 2017, the Policyholder Behavior in the Tail (PBITT) working group distributed its annual survey to insurers andasked for information on their assumptions used in modeling of Universal Life with Secondary Guarantees. The goalof the survey was to gain further insight into the ranges of companies’ assumptions in the tail of a stochastic riskbased capital calculation.There were a total of 25 respondents in 2017. While the identities of the responding companies for a particularresponse remain anonymous to the Policyholder Behavior in the Tail (PBITT) working group, companies were given achance to identify themselves as a participating company. The committee would like to thank these and allanonymous companies for their contribution.AIGAllstateBrighthouse FinancialFarm Bureau Life Insurance CompanyKansas City Life Insurance CompanyKnights of ColumbusLiberty MutualLincoln Benefit LifeLincoln Financial GroupMetLifeMidland National Life and North American CompanyMutual of OmahaNationwideNew York Life Insurance CompanyPenn Mutual Life Insurance CompanyPrincipal Financial GroupRiverSource Life Insurance CompanySagicor Life Insurance CompanySecurian Financial GroupTransamerica Life Insurance CompanyUnited Farm Family LifeWestern & Southern Financial Group
5Overview The latest survey regarding Universal Life with secondary guarantees reflects a different response group fromthose in the prior survey. Some of the changes described below reflect different respondents, not necessarily achange by any given company. SOA research staff was able to confirm that 12 of the participating companiesthis year are the same as in the prior survey. Most companies continue to view the investment returns in tail scenarios (cited by 75% of respondents) andlapse assumptions (79%) to be their most critical risk assumptions when analyzing policyholder behavior in thetail for secondary guarantees (Figure 45).Tail Scenarios Overall, 48% of companies use stochastic scenarios to set or analyze capital levels. It is less common forcompanies with a small block of business to use stochastic scenarios (Figure 3). Of the companies that do usestochastic scenarios, only 9% reported projecting 100 or fewer scenarios while 36% project 1,000 or more(Figure 4). More than one-half of companies (62%) project for at least 51 years (Figure 5). The scenarios used are summarized in Figure 6 through Figure 17.Lapse Assumptions Lapse rates in the tail continue to vary widely among insurers. Assumed lapse rates do not show substantialvariation by issue age for most individual insurers, but are lower for the highest issue ages (70-79). Only selectage groups are shown in Figure 20 and Figure 22. Median lapse rates for 2017 are similar to those in past surveys (Figure 21 and Figure 23). The percentage of companies that reported using dynamic lapse assumptions is somewhat higher than in prioryears. Dynamic lapses were used by 63% this year (Figure 19). Companies were asked how many policies on a block of business that experienced the tail scenario would bekept in force by the secondary guarantee. After 31 years, the average response was 35% of policies and medianresponse was 40% of policies (Figure 24). For the second survey in a row, the 2017 survey saw a fairly small percentage of companies that measure lapsesby distribution system (25%; 3 of 12). Two companies vary their lapse assumptions by distribution systemincluding one of those three which measures lapses by distribution, and one which does not. Just over half (13 of 25) of companies vary lapse assumptions by premium. This is consistent with recentsurveys (Figure 28). Several responses mentioned higher lapse rates for level premium patterns and/or lowerlapse rates for single premiums. In regards to sources of base lapse assumptions, “Company Experience” (88%) and “Actuarial Best Estimate”(72%) were cited as the most common sources (Figure 29).
6 When asked about the number of years of experience companies use in their lapse studies, the most commonresponse was “5-7 years” (55%) with even fewer companies using less than 5 years (5%) than in past surveys(Figure 31). Actuarial best estimate continues to be the most common source of dynamic assumptions at 73%, althoughthat response rate is down from recent surveys. A variety of other sources were reported, similar to pastsurveys (Figure 33).Mortality Assumptions Companies showed a wide range of assumptions, especially after age 100 (Figure 35 through Figure 40). This year’s survey saw an increase in the number of companies using 2001 VBT as their reference table and adecrease in the number using 2008 VBT. This is counter to the recent trend, but could be a function of adifferent response group relative to the prior survey. There was an increase in the number of companies using2014/15 VBT although it is still not yet common (13%; 3 of 24) (Figure 34). Median mortality rates are comparable although slightly lower than the 2008 VBT (Figure 35 through Figure40). Future mortality improvement is modeled by 60% of responding companies, a similar but slightly lower rate ascompared to past surveys. Improvements vary by a variety of factors including gender, smoking status, age andpolicy duration (Figure 44).
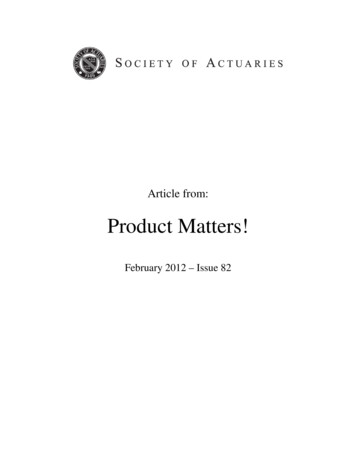
7BackgroundIn 2017, the Policyholder Behavior in the Tail (PBITT) working group distributed a survey to insurers and asked forinformation on assumptions used in their modeling of Universal Life with Secondary Guarantees. The goal of thesurvey was to gain insight into companies’ assumptions in the tail of a stochastic capital calculation. This survey had25 usable responses, up from 20 in 2015 and 21 in 2014. The survey was not distributed in 2016.The distribution of responses by company size in 2017 leaned toward very small ( 1B UL face) and medium ( 1530B face) sized companies relative to past surveys. Not every company answers every question. To inform thecredibility of results, most charts indicate how many companies responded to the question.It is the intention of the PBITT working group to continue to conduct this survey annually by distributing it each yearin April. It is the group’s hope that with the publication of these and future survey results, it will increase theawareness of expected industry experience for all companies to consider when setting assumptions or whenextrapolating to the tail. Others may wish to consider the relative financial impact of the various assumptionsshown. Individual companies may also want to use the results to help design stress tests and experience studies.The group welcomes comments or suggestions for new or revised questions in future surveys.While the exact relationships of new versus prior respondents vary by individual question, at the level of the totalsurvey SOA staff was able to confirm 12 respondents from 2015 repeated in 2017, out of 20 total responses in 2015.Therefore, some of the changes described below reflect different respondents, not necessarily a change by anygiven company. Figure 1 shows the change in the distribution by size over the last five surveys.
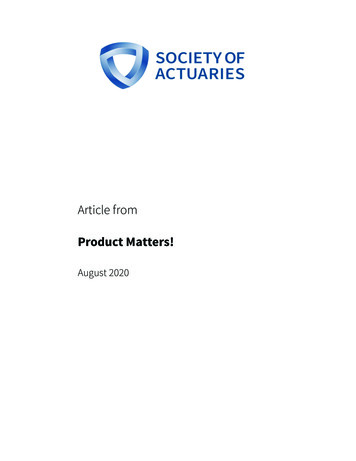
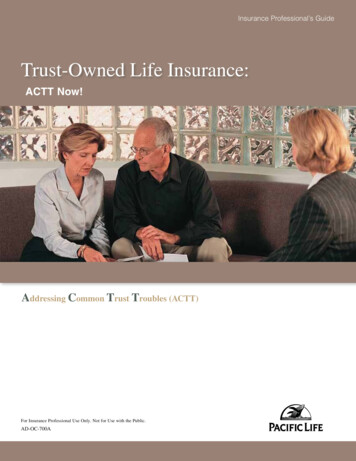
8Parameters of Stochastic Capital CalculationInsurers were asked in Question 2 of the survey to indicate whether or not they analyze capital levels for UL withSecondary Guarantees using stochastic scenarios, as well as how many scenarios are used and the length of theprojection. Figure 2 shows that 48% of insurers used stochastic scenarios to set or analyze capital levels, continuinga generally upward trend in affirmative responses. Figure 3 looks at stochastic scenario use by company size. Ofthose reporting company size and stochastic scenario usage, the smaller companies typically do not use stochasticmodeling to set capital levels, the medium-sized companies were more evenly split between those that do andthose that do not, and the larger companies generally use stochastic modeling.In the 2017 survey, 36% (4 of 11) of the respondents that reported using stochastic scenarios indicated that theyuse 1,000 or more scenarios, as shown in Figure 4. The number of companies that reported using “100 or fewer”was again very low, as it was in the prior survey, with only 9% (1 of 11) marking that selection. Figure 5 shows thedistribution of number of years modeled. Although there has been a downward trend, the most common responsecontinues to be over 75 years (38%; 8 of 21).Number of Companies by Total Face Amount of UniversalLife Policies with Secondary Guarantees876543210 1 Billion 1 - 5 Billion 5 - 15 Billion 15 - 30 Billion 30 - 60 Billion 60 Billion2012 (23 responses)2013 (25 responses)2015 (19 responses)2017 (23 responses)Figure 12014 (20 responses)
9Percentage of insurers that use stochastic scenarios to setor analyze capital levels100%75%50%25%0%YesNo2012 (26 responses)2013 (25 responses)2015 (19 responses)2017 (22 responses)2014 (21 responses)Figure 2Stochastic Scenario Use by Size(23 responses)7654No3Yes210 1 Billion 1 - 5 Billion 5 - 15Billion 15 - 30BillionFigure 3 30 - 60Billion 60 Billion
10If using stochastic modeling, how many scenarios are used?70%60%50%40%30%20%10%0%-10%100 or Fewer101-9991000 or More2012 (9 responses)2013 (6 responses)2015 (9 responses)2017 (11 responses)2014 (7 responses)Figure 4How many years are projected?(Includes both deterministic and stochastic)70%60%50%40%30%20%10%0%-10% 30 years31-50 years51-75 years2012 (24 responses)2013 (23 responses)2015 (18 responses)2017 (21 responses)Figure 576-100 years2014 (17 responses)
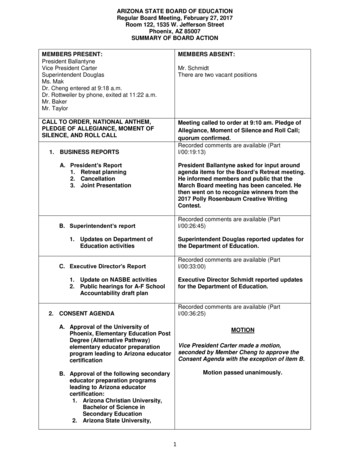
11Tail ScenarioThe tail scenario is defined as the scenario which gives the largest present value of the death benefits paid in allyears where no COI is collected. (This differs from the tail scenario definition used in the committee’s VA survey.)Insurers were asked to list 1 year, 7 year, and 30 year interest rates in the tail scenario (whether a stochasticscenario or a deterministic scenario depending on the respondent’s methodology). Responses varied widely acrossinsurers regarding the description of the tail scenario. The charts below show each insurer’s tail scenario for thethree maturities, separated between those that report using a stochastic methodology and those that report notusing a stochastic methodology, which we then label “deterministic” methodology. Sometimes a company reportsthe use of stochastic methodology, yet provides a tail interest rate path that appears deterministic. While thereasons are not known, one possibility is that their method becomes deterministic but is informed by earlierstochastic modeling which is the basis of their chosen scenario.Of the eleven companies that reported using stochastic modeling, ten provided requested interest rate scenarios.And of the twelve that reported not using stochastic modeling for capital analysis, four of them provided theirdeterministic interest rate scenarios.The companies are comparable across the figures (i.e., Stochastic, 2 in Figure 6 is the same company as Stochastic, 2in Figure 8 and Figure 10.)
12Tail Scenario by Insurer - 1-year TreasuryStochastic (10 responses)10.0%Stochastic, 18.0%Stochastic, 2Stochastic, 36.0%Stochastic, 4Stochastic, 54.0%Stochastic, 6Stochastic, 72.0%Stochastic, 8Stochastic, 90.0%1 3 5 7 9 11 13 15 17 19 21 23 25 27 29 31 33 35 37 39 41Stochastic, 10-2.0%Figure 6Tail Scenario by Insurer - 1-year TreasuryDeterministic (4 responses)10.0%8.0%Deterministic, 16.0%Deterministic, 2Deterministic, 34.0%Deterministic, 42.0%0.0%1 3 5 7 9 11 13 15 17 19 21 23 25 27 29 31 33 35 37 39Figure 7
13Tail Scenario by Insurer - 7-year TreasuryStochastic (10 responses)10.0%Stochastic, 18.0%Stochastic, 2Stochastic, 36.0%Stochastic, 4Stochastic, 54.0%Stochastic, 6Stochastic, 72.0%Stochastic, 8Stochastic, 90.0%1 3 5 7 9 11 13 15 17 19 21 23 25 27 29 31 33 35 37 39 41Stochastic, 10-2.0%Figure 8Tail Scenario by Insurer - 7-year TreasuryDeterministic (4 responses)10.0%8.0%Deterministic, 16.0%Deterministic, 2Deterministic, 34.0%Deterministic, 42.0%0.0%1 3 5 7 9 11 13 15 17 19 21 23 25 27 29 31 33 35 37 39Figure 9
14Tail Scenario by Insurer - 30-year TreasuryStochastic (10 responses)10.0%Stochastic, 18.0%Stochastic, 2Stochastic, 36.0%Stochastic, 4Stochastic, 54.0%Stochastic, 6Stochastic, 72.0%Stochastic, 8Stochastic, 90.0%1 3 5 7 9 11 13 15 17 19 21 23 25 27 29 31 33 35 37 39 41Stochastic, 10-2.0%Figure 10Tail Scenario by Insurer - 30-year TreasuryDeterministic (4 responses)10.0%8.0%Deterministic, 16.0%Deterministic, 2Deterministic, 34.0%Deterministic, 42.0%0.0%1 3 5 7 9 11 13 15 17 19 21 23 25 27 29 31 33 35 37 39Figure 11
15The following graphs of tail scenarios show the median reported value across insurers for each of three maturities(1, 7 and 30 Year Treasuries). The first pair of graphs separate stochastic from deterministic for 2017, followed bytheir combination. Thereafter, combinations only are shown from recent survey results. Overall, there is a trendtoward lower median tail scenarios, although that trend seems to have stabilized.These lines do not represent any one single company’s response, but rather the median of the rates across allcompanies’ responses calculated independently at each projection year duration.Median Tail Scenario Across Insurers - 2017Stochastic (10 responses)7.0%6.0%5.0%4.0%3.0%2.0%1.0%Projection Year1 yr Treasury7 yr TreasuryFigure 1230 yr Treasury393735333129272523211917151311975310.0%
16Median Tail Scenario Across Insurers - 2017Deterministic (4 333129272523211917151311975310.0%Projection Year1 yr Treasury7 yr Treasury30 yr TreasuryFigure 13Median Tail Scenario Across Insurers - 2017(14 responses)7.0%6.0%5.0%4.0%3.0%2.0%1.0%Projection Year1 yr Treasury7 yr TreasuryFigure 1430 yr Treasury393129272523211917151311975310.0%
17Median Tail Scenario Across Insurers - 2015(12 333129272523211917151311975310.0%Projection Year1 yr Treasury7 yr Treasury30 yr TreasuryFigure 15Median Tail Scenario Across Insurers - 2014(14 responses)7.0%6.0%5.0%4.0%3.0%2.0%1.0%Projection Year1 yr Treasury7 yr TreasuryFigure 1630 yr Treasury333129272523211917151311975310.0%
18Median Tail Scenario Across Insurers - 2013(10 37393129272523211917151311975310.0%Projection Year1 yr Treasury7 yr Treasury30 yr TreasuryFigure 17Median Tail Scenario Across Insurers - 2012(14 1917151311975310.0%Projection Year1 yr Treasury7 yr TreasuryFigure 1830 yr Treasury
19Lapse AssumptionsQuestion 3 asked about lapse assumptions. The following chart shows the percentage of insurers who use dynamiclapse functions for policies with secondary guarantees. The number of insurers using dynamic lapse functions washigher this year (63% of responses; 15 of 24) relative to the prior four surveys.Do you use dynamic lapses when modeling Universal Life withsecondary guarantees?70%60%50%40%30%20%10%0%Yes2012 (25 responses)2013 (25 responses)2015 (19 responses)2017 (24 responses)No2014 (21 responses)Figure 19A follow-up question in the last 3 surveys asked those companies that had dynamic lapses whether lapses could begreater than zero if a secondary guarantee renders a policy to be paid-up. In 2017, six of fifteen responders (40%)indicated that it could, which is similar although slightly lower than in 2015 (56%; 5 of 9) and 2014 (43%; 3 of 7).Additional commentary indicated that this was generally only possible if the secondary guarantee was in effect andthe policy still had a cash surrender value greater than zero.In Question 4, insurers were asked to list their lapse assumption in the tail scenario by duration and by various issueages. The charts below show the highest, median, and lowest lapse rates used across duration. The graphs showthe responses for issue ages 40-49 and 70-79. The 2017 median responses are in line with those from the past twoyears. The responses for other issue ages were very similar to those for age 40-49.
20Highest, Median, and Lowest Lapse Rates Across Insurers in TailScenario by Policy Year - Issue Ages 40-4912%10%8%6%4%2%0%0%0%0%Year 1Year 2Year 3Last year End of SC 1st year Last year 1st yearLaterwith SCPeriodw/o SCwithwith 0 AV years withpositive0 AVAVHighestMedianLowestFigure 20Median Lapse Rates Across Insurers in Tail Scenario by PolicyYearIssue Ages 40-496%5%4%3%2%1%0%Year 1Year 2Year 3Last year End of SCwith SCPeriod1st yearw/o SC2012 (18 responses)2013 (19 responses)2015 (10 responses)2017 (14 responses)Figure 21Last year 1st year Later yearswithwith 0 AV with 0 AVpositive AV2014 (16 responses)
21Highest, Median, and Lowest Lapse Rates Across Insurers in TailScenario by Policy Year - Issue Ages 70-7912%10%8%6%4%2%0%0%0%0%0%0%0%0%0%0%Year 1Year 2Year 3Last year End of SC 1st yearwith SCPeriodw/o SCHighestMedianLowestLast year 1st yearLaterwithwith 0 AV years withpositive0 AVAVFigure 22Median Lapse Rates Across Insurers in Tail Scenario by PolicyYearIssue Ages 70-796%5%4%3%2%1%0%Year 1Year 2Year 3Last year End of SCwith SCPeriod1st yearw/o SC2012 (18 responses)2013 (19 responses)2015 (10 responses)2017 (14 responses)Figure 23Last year 1st year Later yearswithwith 0 AV with 0 AVpositive AV2014 (16 responses)
22Next, in Question 5, the companies were asked, out of 10,000 newly issued policies that would experience the tailscenario, how many would first have a zero cash surrender value but be kept in force by the secondary guarantee ata given duration for issue ages 50-59. The results were then converted to a cumulative basis in Figure 24.Cumulative percentage of policies kept inforce by No-LapseGuarantee, by durationIssue Ages 50-59 (8 2526-3031 DurationAverageMedianFigure 24Comparing the median result over time, the 2017 survey showed more policies being kept in force by the secondaryguarantee in the early durations relative to prior surveys. This is shown in Figure 25.
23Median of Percentage of Policies Kept In Force byNLG, by 011-1516-2021-25Figure 2526-3031
24Lapses by Distribution SystemIn Question 6, the survey asked insurers whether their lapse assumptions vary by distribution.Out of 25respondents, 12 (48%) indicated that they sell through multiple distributions. This is lower than in past years.Figure 26 indicates the distribution systems used by these respondents, with a heavier proportion using wirehouseand direct distribution relative to prior years.Distribution Systems used by Insurers who distribute throughmultiple systems100%80%60%40%20%0%0%Broker/AgentBank2012 (14 responses)Wirehouse2013 (17 responses)2015 (14 responses)2017 (12 responses)Direct2014 (13 responses)OtherFigure 26An additional question asked insurers whether they measure lapses by distribution system. Of the 12 insurers whoresponded, three (25%; 3 of 12) measure lapses by distribution system as seen in Figure 27.
25Percent Measuring Lapse Experience by Distribution100%80%60%40%20%0%Yes2012 (15 responses)2013 (17 responses)2015 (14 responses)2017 (12 responses)No2014 (13 responses)Figure 27Of those three, two do not vary lapse assumptions by distribution system and the third indicated that lapseassumptions vary by captive versus independent agents. Additionally, one insurer reported varying its lapseassumption by distribution system although it does not measure lapse by distribution system.
26Lapses by Premium AssumptionQuestion 7 asked about lapses relative to premium assumptions. A little over half of the respondents (13 of 25;52%) indicated that lapse rates vary by premium assumption, which is similar to past surveys (Figure 28). Where thelapse rates do vary by premium assumptions, they are typically bucketed by single pay, level pay, 10-pay, and paidup or else by the level of funding (high/medium/low) relative to, for example, planned premium.Do lapse rates vary by premium assumption?60%50%40%30%20%10%0%YesNo2012 (24 responses)2013 (24 responses)2015 (18 responses)2017 (25 responses)Figure 282014 (20 responses)
27Sources of Base Lapse AssumptionIn question 8, insurers were asked about the source of their base lapse assumptions. Respondents could includemore than one source. Responses were similar to past surveys although fewer selected “Company experience” thanin past years. Nevertheless, “Company experience” (88%) and “Actuarial best estimate” (72%) remained the mostcommonly cited sources (Figure 29).What are the sources of your company's base lapse rate assumptions?(each insurer could choose more than one option)100%80%60%40%20%0%CompanyIndustry studyActuarial BestexperienceEstimate2012 (25 responses) 2013 (24 responses)2015 (18 responses)2017 (25 responses)Figure 29Consultant Advice2014 (20 responses)Other
28The survey then asked if companies perform lapse studies for UL policies with secondary guarantees, and if so, howfrequently. As in past surveys, a strong majority of companies (88%, 22 of 25 in 2017) perform such lapse studies.Of those 22 companies that perform lapse studies of UL polices with secondary guarantees, “Annually” remainedthe dominant frequency for doing so (Figure 30).How frequently do you perform lapse studies?100%80%60%40%20%0%Less frequently thanAnnuallyQuarterlyMonthlyannually2012 (23 responses) 2013 (22 responses) 2014 (18 responses)2015 (17 responses)2017 (22 responses)Figure 30
29Companies were asked how many years of experience data were used in their latest lapse study. Over half of therespondents indicated “5-7 years” (55%; 12 of 22). Longer time periods were also cited, with very few companies(5%; 1 of 22) using less than 5 years.How many years of experience data were used in your latest lapsestudy?70%60%50%40%30%20%10%0% 5 years5-7 years8-10 years2012 (23 responses)2013 (21 responses)2015 (17 responses)2017 (17 responses)Figure 31 10 years2014 (18 responses)
30Companies were asked about their dynamic lapse assumptions specifically. Of the 25 respondents, 15 (60%) varytheir assumptions dynamically (Figure 32). Of those fifteen companies that vary assumptions dynamically, “ActuarialBest Estimate” continues to be the most commonly cited source although less so than in prior surveys. Fewercompanies also reported using industry studies and consultant advice while more reported using companyexperience as compared to prior surveys (Figure 33).Do your assumptions vary dynamically?100%80%60%40%20%0%YesNo2012 (25 responses)2013 (24 responses)2015 (18 responses)2017 (25 responses)Figure 322014 (20 responses)
31What are the sources of your company's dynamic lapse rateassumptions?(each insurer could choose more than one option)100%80%60%40%20%0%CompanyexperienceIndustry studyActuarial BestEstimate2012 (9 responses)2013 (11 responses)2015 (9 responses)2017 (15 responses)Figure 33Consultant Advice2014 (5 responses)Other
32Mortality AssumptionsCompanies were asked about their mortality assumptions in the tail in Question 9. Half of the companies use 2008VBT, which is lower than in the prior survey. Use of the 2001 VBT table increased relative to the prior survey. Thiscould be due to a different set of responding companies. Three of the twenty-four companies reported using eitherthe 2014 or 2015 VBT tables which is an increase from the past but indicates that their use is still not widespread(Figure 34). Those marking “Other” indicated that they derived mortality from company experience or tables fromreinsurer experience.What reference mortality table do you 01 VBT2008 VBT2012 (25 responses)75-802014/15 VBTOther. PleaseIntercompanydescribe.2013 (23 responses)2014 (20 responses)2015 (18 responses)2017 (24 responses)Figure 34Sixteen companies provided ultimate mortality rates per 1,000 assumed at higher attained ages for variousunderwriting classes for males and females.The minimum, maximum and median of those responses aresummarized below, alongside the 2001 VBT and 2008 VBT rates (ultimate, gender and tobacco distinct, age nearestbirthday) for comparison (Figure 35 through Figure 40). The median mortality rates tend to be similar to the 2008VBT. Note that the minimum, maximum, and median responses do not necessarily represent the response of anygiven company, but are determined independently for each age. In addition, some companies did not providemortality rates for the older ages.
331,000Annual mortality rate per 1,000Male, Best Non-tobacco 115120Attained AgeMedianMinimumMaximum2001 VBT2008 VBTFigure 351,000900800Annual mortality rate per 1,000Female, Best Non-tobacco ttained AgeMedianMinimumMaximumFigure 362001 VBT2008 VBT
341,000900800Annual mortality rate per 1,000Male, Standard 15120Attained AgeMedianMinimumMaximum2001 VBT2008 VBTFigure 371,000900800Annual mortality rate per 1,000Female, Standard 15120Attained AgeMedianMinimumMaximumFigure 382001 VBT2008 VBT
351,000900800Annual mortality rate per 1,000Male, Standard 0Attained AgeMedianMinimumMaximum2001 VBT2008 VBTFigure 391,000900800Annual mortality rate per 1,000Female, Standard 0Attained AgeMedianMinimumMaximumFigure 402001 VBT2008 VBT
36Companies were asked again this year about the number of underwriting classes used. The majority of companies(71%; 17 of 24) responded with three non-tobacco classes, and 4 of 24 (17%) responded with four non-tobaccoclasses (Figure 41). For tobacco classes, two continues to be the predominant response with 96% (23 of 24) citingtwo tobacco classes this year (Figure 42).How many non-smoker underwriting classes are used?100%80%60%40%20%0%0% 0%0%12342012 (25 responses)2013 (24 responses)2014 (20 responses)2015 (12 responses)2017 (24 responses)Figure 41How many smoker underwriting classes are used?100%80%60%40%20%0%122012 (25 responses)2013 (24 responses)2015 (17 responses)2017 (24 responses)Figure 423 2014 (20 responses)
37The percentage of respondents incorporating future mortality improvement into their models dropped to 60% (15of 25).Are future mortality improvements assumed in your model?100%80%60%40%20%0%YesNo2012 (24 responses)2013 (23 responses)2015 (18 responses)2017 (25 responses)2014 (20 responses)Figure 43Most of the 15 companies modeling future mortality improvements had improvement assumptions that weregender, age, and/or duration distinct (Figure 44).By what parameters do future mortality improvements vary?(% of "Yes" responses)100%80%60%40%20%0%Male / FemaleSmoker statusAge2012 (18 responses)2013 (18 responses)2015 (13 responses)2017 (15 responses)Figure 44Duration2014 (15 responses)Other
38Twenty companies responded to a question about whether mortality assumptions change when the secondaryguarantee is in-the-money and the account value is zero. The vast majority responded that mortality assumptionsdo not vary by the in-the-moneyness of the secondary guarantee. One company indicated that mortality does varyby in-the-moneyness and further elaborated that their mortality assumption increases based on the length of timethat the no-lapse guarantee has been active.
39Critical AssumptionsThe survey then asked for assumptions that the companies considered critical to analyzing experience in the tail. Acompany could indicate more than one response. Investment return and lapse assumptions continue to be cited asthe most critical assumpti
The latest survey regarding Universal Life with secondary guarantees reflects a different response group from those in the prior survey. Some of the changes described below reflect different respondents, not necessarily a change by any given company. SOA research staff was able to confirm that 12 of the participating companies