Transcription
2019 Universal Life with SecondaryGuarantees SurveySurvey of Assumptions for Policyholder Behaviorin the TailDecember 2019
22019 Universal Life with SecondaryGuarantees SurveySurvey of Assumptions for Policyholder Behavior in the TailAUTHORSDale HagstromMienaloshyani ViruthasalamSPONSORSociety of ActuariesAcknowledgementThe authors would like to acknowledge the work done by Hongru (Felix) Liu and Jeffrey Hartman, as well as Barbara Scott of the Society of Actuaries, toorganize the initial survey data.Caveat and DisclaimerThe opinions expressed and conclusions reached by the authors are their own and do not represent any official position or opinion of the Society ofActuaries or its members. The Society of Actuaries makes no representation or warranty to the accuracy of the information.Copyright 2019 by the Society of Actuaries. All rights reserved.Copyright 2019 Society of Actuaries
3ContentsSurvey Highlights. 4Background . 6Parameters of Stochastic Capital Calculation . 8Tail Scenario . 11Lapse Assumptions . 19Lapses by Distribution System . 24Lapses by Premium Assumption . 26Sources of Base Lapse Assumption . 27Mortality Assumptions. 31Critical Assumptions. 41About The Society of Actuaries. 42Copyright 2019 Society of Actuaries
4Survey HighlightsIn 2019, the Policyholder Behavior in the Tail (PBITT) committee distributed its annual survey to insurers and askedfor information on assumptions used in their modeling of Universal Life with Secondary Guarantees. The goal of thesurvey was to gain further insight into the ranges of companies’ assumptions in the tail of a stochastic risk-basedcapital calculation.Overview The latest survey regarding Universal Life with Secondary Guarantees reflects a different response group fromthose in the prior survey. Some of the changes described below reflect different respondents, not necessarily achange by any given company. The SOA research office was able to confirm that 7 of the participating companiesthis year also participated in the prior survey. Most companies continue to view the investment returns in tail scenarios (cited by 67% of respondents) and lapseassumptions (73%) to be their most critical risk assumptions when analyzing policyholder behavior in the tail forsecondary guarantees (Figure 44).Tail Scenarios Overall, 53% of companies use stochastic scenarios to set or analyze capital levels (Figure 2). It is less common forcompanies with a small block of business to use stochastic scenarios ( Figure 3). Of the companies that do usestochastic scenarios, 75% projected more than 100 scenarios and 50% project 1,000 or more (Figure 4). A large majority of companies (85%) project for at least 51 years (Figure 5). The tail scenarios used are summarized in Figure 6 through Figure 18.Lapse Assumptions Lapse rates in the tail continue to vary widely among insurers. This year companies were asked to provideprojected lapse rates for various durations for ages 50-59 only. Median lapse rates for 2019 seem to show morevariation across durations than in past years (Figure 22). The percentage of companies that reported using dynamic lapse assumptions was slightly lower this year than inthe past two years (2018 & 2017). Dynamic lapses were used by 60% this year (Figure 19). Companies were asked how many policies on a block of business that experienced the tail scenario would be keptin force by the secondary guarantee. After 31 years, the average response was 67% of policies and medianresponse was 84% of policies (Figure 23). For the fourth survey in a row, the 2019 survey saw a small percentage of companies that measure lapses bydistribution system (25%; 2 of 8) (Figure 26). Two companies (25%) reported varying their lapse assumptions bydistribution system in this year’s survey (Figure 27).Copyright 2019 Society of Actuaries
5 Half (7 of 14) of companies vary lapse assumptions by premium. This is in line with what has been seen in therecent surveys (Figure 28). Several respondents mentioned higher lapse rates for level premium patterns and/orlower lapse rates for single premiums. Regarding sources of base lapse assumptions, “Company Experience” (100%) and “Actuarial Best Estimate” (80%)were cited as the most common sources (Figure 29). When asked about the number of years of experience companies use in their lapse studies, the most commonresponse was “5-7 years” (57%) with only 1 company (7%) using less than 5 years in this year’s survey (Figure 31). Actuarial best estimate continues to be the most common source of dynamic assumptions at 89%. A variety ofother sources were reported, similar to past surveys (Figure 32).Mortality Assumptions Companies showed a wide range of mortality assumptions. Median mortality rates are comparable to the 2008VBT and 2015 VBT (Figure 34 through Figure 39). This year’s survey shows a cross-over point of companies shifting from using 2008 VBT (36%; 5 of 14) to using the2014/15 VBT (43%; 6 of 14) as their reference table (Figure 33). Future mortality improvement is modeled by 60% of responding companies, a similar but slightly lower rate ascompared to past surveys (Figure 42). Improvements vary by a variety of factors, particularly gender and age(Figure 43).Copyright 2019 Society of Actuaries
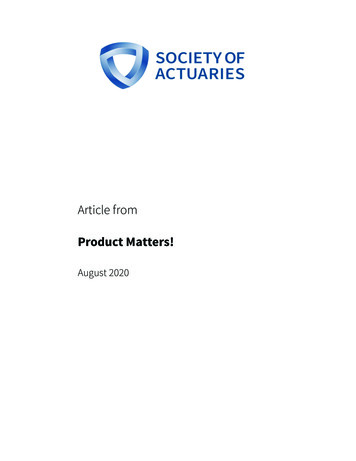
6BackgroundIn 2019, the Policyholder Behavior in the Tail (PBITT) committee distributed a survey to insurers and asked forinformation on assumptions used in their modeling of Universal Life with Secondary Guarantees. The goal of thesurvey was to gain insight into companies’ assumptions in the tail of a stochastic capital calculation. This survey had15 responses, up from 13 in 2018 and down from 23 in 2017. The survey was not distributed in 2016.The distribution of responses by company size in 2019 trended toward mid-size companies. The number of responsesfrom companies with medium and large block of UL ( 15B face) was similar to past years. The number of responsesfrom smaller companies (under 15B face), while similar to the previous year 2018, was much lower than in 2017 and2014, as seen in Figure 1.Number of Companies by Total Face Amount of UniversalLife Policies with Secondary Guarantees87654321000 1 Billion 1 - 5 B 5 - 15 B 15 - 30 B2014 (20 responses)2015 (19 responses)2018 (13 responses)2019 (15 responses) 30 - 60 B 60 B2017 (23 responses)Figure 1At the total survey level, we were able to confirm 7 respondents from 2018 repeated in 2019, out of 15 total responsesin 2019. Therefore, some of the changes described in this report reflect different respondents, not necessarily achange by any given company. The relationship of new versus prior respondents varies by individual question as notevery company answers every question. To suggest the credibility of results, most charts indicate how manyCopyright 2019 Society of Actuaries
7companies responded to the question. The reader should be aware that changes in the set of companies participatingin each survey may influence some of the observed changes in survey responses over time.It is the intention of the PBITT committee to continue to conduct this survey annually by distributing it each year inApril. It is our hope that with the publication of these and future survey results, we will increase the awareness ofexpected industry experience for all companies to consider when setting assumptions or when extrapolating to thetail. Others may wish to consider the relative financial impact of the various assumptions shown. Individualcompanies may also want to use the results to help design stress tests and experience studies. The committeewelcomes comments or suggestions for new or revised questions in future surveys.Copyright 2019 Society of Actuaries
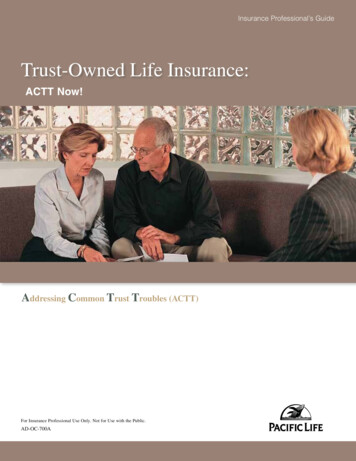
8Parameters of Stochastic Capital CalculationInsurers were asked in Question 2 of the survey to indicate whether they analyze capital levels for UL with SecondaryGuarantees using stochastic scenarios, as well as how many scenarios are used and the length of the projection. Figure2 shows that 53% of insurers used stochastic scenarios to set or analyze capital levels, continuing a generally upwardtrend in affirmative responses. We refer to the companies that do not use stochastic scenarios as companies usingdeterministic scenarios. Figure 3 looks at stochastic scenario use by company size. Of those reporting company sizeand stochastic scenario usage, the companies with larger UL blocks are more likely to use stochastic modeling.In the 2019 survey, 50% (4 of 8) of the respondents that reported using stochastic scenarios indicated that they use1,000 or more scenarios, as shown in Figure 4. The number of companies that reported using “100 or fewer” was notso low as it was in the prior three surveys with 2 of 8 (25%) marking that selection.Percentage of Insurers that Use Stochastic Scenarios toSet or Analyze Capital Levels100%75%50%25%0%YesNo2014 (21 responses)2015 (19 responses)2018 (13 responses)2019 (15 responses)2017 (22 responses)Figure 2Copyright 2019 Society of Actuaries
9Stochastic Scenario Use by Size(15 responses)654No3Yes210 1 Billion 1 - 5 Billion 5 - 15 Billion 15 - 30 Billion 30 - 60 Billion 60 BillionFigure 3If using stochastic modeling, how many scenariosare used?70%60%50%40%30%20%10%0%100 or Fewer101-9992014 (7 responses)2015 (9 responses)2018 (7 responses)2019 (8 responses)1000 or More2017 (11 responses)Figure 4Copyright 2019 Society of Actuaries
10Figure 5 shows the distribution of number of years modeled, which includes both companies that use stochasticmodeling as well as those that use a deterministic tail. The most common response continues to be over 75 years (8of 13; 62%). It is possible to perceive a trend toward longer projection periods, but we again want to warn thatdifferent year surveys had different respondents, so there may not necessarily be a change by any given company.How many years are projected?(Includes both deterministic and stochastic)70%60%50%40%30%20%10%0%0% 0% 30 years31-50 years51-75 years2014 (17 responses)2015 (18 responses)2018 (11 responses)2019 (13 responses)76-100 years2017 (21 responses)Figure 5Copyright 2019 Society of Actuaries
11Tail ScenarioThe tail scenario is defined as the scenario which results in the largest present value of the death benefits paid in allyears where no COI is collected. (This differs from the tail scenario definition used in the committee’s VA survey.)Insurers were asked to list 1 year, 7 year, and 30 year interest rates in the tail scenario (whether a stochastic scenarioor a deterministic scenario depending on the respondent’s methodology). Responses varied widely across insurersregarding the description of the tail scenario. The charts that follow show each insurer’s tail scenario for the threematurities, separated between those that report using a stochastic methodology and those that report not using astochastic methodology, which we then label “deterministic” methodology.Of the eight companies that reported using stochastic modeling, five provided the requested interest rate scenarios.And of the seven that reported using deterministic modeling for capital analysis, three of them provided theirdeterministic interest rate scenarios.The companies are comparable across the figures (e.g. Stochastic, 2 in Figure 6 is the same company as Stochastic, 2in Figure 8 and Figure 10.)To respect the confidential nature of responses, individual results are only shown when there are at least 5companies responding to a particular question.Copyright 2019 Society of Actuaries
12Tail Scenario by Insurer - 1-year TreasuryStochastic (5 responses)18.0%16.0%14.0%12.0%Stochastic, 110.0%Stochastic, 2Stochastic, 38.0%Stochastic, 46.0%Stochastic, 54.0%2.0%0.0%13579 11 13 15 17 19 21 23 25 27 29 31 33 35 37 39 41Figure 6Tail Scenario by Insurer - 1-year TreasuryDeterministicIndividual Responses Not ShownSince There Were Fewer Than 5Responses.Figure 7Copyright 2019 Society of Actuaries
13Tail Scenario by Insurer - 7-year TreasuryStochastic (5 responses)20.0%18.0%16.0%14.0%Stochastic, 112.0%Stochastic, 210.0%Stochastic, 38.0%Stochastic, 46.0%Stochastic, 54.0%2.0%0.0%13579 11 13 15 17 19 21 23 25 27 29 31 33 35 37 39 41Figure 8Tail Scenario by Insurer - 7-year TreasuryDeterministicIndividual Responses NotShown Since There WereFewer Than 5 Responses.Figure 9Copyright 2019 Society of Actuaries
14Tail Scenario by Insurer - 30-year TreasuryStochastic (5 responses)16.0%14.0%12.0%10.0%Stochastic, 1Stochastic, 28.0%Stochastic, 3Stochastic, 46.0%Stochastic, 54.0%2.0%0.0%13579 11 13 15 17 19 21 23 25 27 29 31 33 35 37 39 41Figure 10Tail Scenario by Insurer - 30-year TreasuryDeterministicIndividual Responses Not ShownSince There Were Fewer Than 5Responses.Figure 11Copyright 2019 Society of Actuaries
15The following graphs of tail scenarios show the median reported value across insurers for each of three maturities (1,7 and 30 Year Treasuries). The first pair of graphs separates stochastic from deterministic for 2019, followed by theircombination. Thereafter, combinations only are shown from recent survey results.These lines do not represent any one single company’s response, but rather the median of the rates across allcompanies’ responses calculated independently at each projection year duration. To respect the confidential natureof responses, the median deterministic rates are shown only when there are at least 5 companies responding.Median Tail Scenario Across Insurers - 2019Stochastic (5 272523211917151311975310.0%Projection Year1 yr Treasury7 yr Treasury30 yr TreasuryFigure 12Copyright 2019 Society of Actuaries
16Median Tail Scenario Across Insurers- 2019 DeterministicMedian of Responses Not Shown SinceThere Were Fewer Than 5 Responses.Figure 13Median Tail Scenario Across Insurers - 2019Stochastic and Deterministic (8 272523211917151311975310.0%Projection Year1 yr Treasury7 yr Treasury30 yr TreasuryFigure 14Copyright 2019 Society of Actuaries
17Median Tail Scenario Across Insurers - 2018(9 37393129272523211917151311975310.0%Projection Year1 yr Treasury7 yr Treasury30 yr TreasuryFigure 15Median Tail Scenario Across Insurers - 2017(14 1917151311975310.0%Projection Year1 yr Treasury7 yr Treasury30 yr TreasuryFigure 16Copyright 2019 Society of Actuaries
18Median Tail Scenario Across Insurers - 2015(12 333129272523211917151311975310.0%Projection Year1 yr Treasury7 yr Treasury30 yr TreasuryFigure 17Median Tail Scenario Across Insurers - 2014(14 211917151311975310.0%Projection Year1 yr Treasury7 yr Treasury30 yr TreasuryFigure 18Copyright 2019 Society of Actuaries
19Lapse AssumptionsQuestion 3 asked about lapse assumptions. The following chart shows the percentage of insurers who use dynamiclapse functions for policies with secondary guarantees. The number of insurers using dynamic lapse functions isslightly lower than in the past two years with 60% doing so in 2019 (9 of 15). See Figure 19.Do you use dynamic lapses when modeling Universal Life withsecondary guarantees?100%80%60%40%20%0%Yes2014 (21 responses)2015 (19 responses)2018 (13 responses)2019 (15 responses)No2017 (24 responses)Figure 19Copyright 2019 Society of Actuaries
20A follow-up question asked those companies that had dynamic lapses whether lapses could be greater than zero if asecondary guarantee renders a policy to be paid-up. In 2019, five of the eight that responded to this follow-upquestion (63%) indicated that it could. This is the highest percentage in recent surveys, as seen in Figure 20. Additionalcommentary indicated that this was generally only possible if the policy was paid up, but the policy still had a positivecash surrender value.For those using a dynamic lapse function, could it yield a lapserate greater than zero once a secondary guarantee causes it tobe paid-up?100%80%60%40%20%0%Yes2014 (7 responses)2015 (9 responses)2018 (9 responses)2019 (8 responses)No2017 (15 responses)Figure 20In Question 4, insurers were asked to list their lapse assumption in the tail scenario by duration for issue ages 50-59.In previous surveys, this was done for various issue ages and graphs were provided for issue ages 40-49 and 70-79.This year, the charts to follow show the highest, median, and lowest lapse rates used across duration for issue ages50-59 only. The 2019 median responses for issue ages 50-59 are a little more volatile this year across durations thanwhat had been seen in the earlier surveys for the same ages.Copyright 2019 Society of Actuaries
21Highest, Median, and Lowest Lapse Rates Across Insurers in TailScenario by Policy Year - Issue Ages 50-59(7 responses)12%10%8%6%4%2%0%Year 1Year 2Year 3Last year End of SC 1st yearwith SCPeriodw/o SCHighestMedianLast year 1st yearLaterwithwith 0 AV years withpositive0 AVAVLowestFigure 21Median Lapse Rates in Tail Scenario by Policy YearIssue Ages 50-596%5%4%3%2%1%0%Year 1Year 2Year 3Last yearwith SCEnd of SCPeriod1st yearw/o SC2014 (16 responses)2015 (10 responses)2018 (7 responses)2019 (7 responses)Last year 1st year Later yearswithwith 0 AV with 0 AVpositive AV2017 (14 responses)Figure 22Copyright 2019 Society of Actuaries
22Next, in Question 5, the insurers were asked, out of 10,000 newly issued policies that would experience the tailscenario, how many would first have a zero cash surrender value but be kept in force by the secondary guarantee ata given duration for issue ages 50-59. The results were then converted to a cumulative basis in Figure 23.Cumulative Percentage of Policies Experiencing theTail Scenario that are Kept Inforce by No-LapseGuarantee, by DurationIssue Ages 50-59 (6 516-2021-2526-3031 DurationAverageMedianFigure 23Copyright 2019 Society of Actuaries
23Comparing the median results over time, the 2019 survey showed similar numbers of policies being kept in force bythe secondary guarantee in the early durations relative to the last few surveys. At later durations, the current survey,in comparison to earlier surveys, shows a greater proportion of policies being kept in force by the no-lapse guarantee.This is shown in Figure 24.Cumulative Percentage of Policies ExperiencingMedian Tail Scenario that are Kept Inforce by NoLapse Guarantee, by DurationIssue Ages 201516-20Duration201721-25201826-3031 2019Figure 24Copyright 2019 Society of Actuaries
24Lapses by Distribution SystemIn Question 6, the survey asked insurers whether their lapse assumptions vary by distribution. Out of fifteenrespondents, eight (53%) indicated that they sell through multiple distributions. This is a similar positive responserate to past years.Figure 25 indicates the distribution systems used by these respondents, with respondents able to select more thanone distribution. A lower proportion cited using wirehouse distributions relative to prior years.Distribution Systems Used by Insurers Who Distribute throughMultiple 2014 (13 responses)2015 (14 responses)2018 (9 responses)2019 (8 responses)DirectOther2017 (12 responses)Figure 25Copyright 2019 Society of Actuaries
25An additional question asked insurers whether they measure lapses by distribution system. Of the eight insurers whoresponded, two (25%; 2 of 8) measure lapses by distribution system as seen in Figure 26.Percent Measuring Lapse Experience by Distribution100%80%60%40%20%0%Yes2014 (13 responses)2015 (14 responses)2018 (9 responses)2019 (8 responses)No2017 (12 responses)Figure 26Two companies (25%) reported varying lapse assumptions by distribution system. Apart from 2018, in each of therecent surveys, two companies per year indicated that they varied lapse assumption by distribution system. This isshown in Figure 27.Percent Varying Lapse Assumption by Distribution100%80%60%40%20%0%0%Yes2014 (13 responses)2015 (13 responses)2018 (9 responses)2019 (8 responses)No2017 (12 responses)Figure 27Copyright 2019 Society of Actuaries
26Lapses by Premium AssumptionQuestion 7 asked about lapses relative to premium assumptions. Half the respondents (7 of 14; 50%) indicated thatlapse rates vary by premium assumption, which is lower than 2018 but fairly similar to the other recent years (Figure28). Where the lapse rates do vary by premium assumption, they are typically bucketed by single pay, level pay, 10-pay, and paid up or else by the level of funding (high/medium/low) relative to, for example, planned premium.Comments indicated that commonly single pay has lower lapse rates, followed by 10-pay, and then level with relativelyhigher lapse rates. Also, paid up policies have lower lapse rates.Do lapse rates vary by premium assumption?100%80%60%40%20%0%YesNo2014 (20 responses)2015 (18 responses)2018 (13 responses)2019 (14 responses)2017 (25 respinses)Figure 28Copyright 2019 Society of Actuaries
27Sources of Base Lapse AssumptionIn question 8, insurers were asked about the source of their base lapse assumptions. Respondents could include morethan one source. Responses were similar to past surveys including a reduced number selecting “Industry Study” (27%;4 of 15 in 2019). A lower number of respondents selected “Consultant Advice” (only 7%; 1 of 15 in 2019) than in thepast years. “Company experience” (100%) and “Actuarial best estimate” (80%) remained the most commonly citedsources (Figure 29).What are the sources of your company's base lapse rate assumptions?(each insurer could choose more than one option)100%80%60%40%20%0% 0% 0%0%CompanyIndustry studyActuarial BestexperienceEstimate2014 (20 responses) 2015 (18 responses)2018 (13 responses)Consultant AdviceOther2017 (25 responses)2019 (15 responses)Figure 29Copyright 2019 Society of Actuaries
28The survey then asked if companies perform lapse studies for UL policies with secondary guarantees, and if so, howfrequently. As in past surveys, a strong majority of companies (93%; 14 of 15 in 2019) perform such lapse studies. Ofthose 14 companies that perform lapse studies of UL polices with secondary guarantees, “Annually” remained thedominant frequency for doing so (10 of 14; 64%) (Figure 30).How frequently do you perform lapse studies?100%80%60%40%20%0%0%0%0% 0% 0%Less frequently thanAnnuallyQuarterlyMonthlyannually2014 (18 responses) 2015 (17 responses) 2017 (22 responses)2018 (13 responses)2019 (14 responses)Figure 30Copyright 2019 Society of Actuaries
29Companies were asked how many years of experience data were used in their latest lapse study. The dominantresponse remains “5-7 years” (57%; 8 of 14) (Figure 31). Longer time periods were also cited, with only one companyusing less than 5 years in the 2019 survey.How many years of experience data were used in your latest lapsestudy?70%60%50%40%30%20%10%0% 5 years5-7 years8-10 years2014 (18 responses)2015 (17 responses)2018 (13 responses)2019 (14 responses) 10 years2017 (22 responses)Figure 31Copyright 2019 Society of Actuaries
30Companies were asked about their dynamic lapse assumptions specifically. See Figure 19. Of the 15 respondents in2019, 9 (that is, 60%) vary their assumptions dynamically. Of those 9 companies that vary assumptions dynamically,“Actuarial Best Estimate” continues to be the most commonly cited source. Fewer companies reported using industrystudies as compared to prior surveys (Figure 32).What are the sources of your company's dynamic lapse rateassumptions?(each insurer could choose more than one option)100%80%60%40%20%0%CompanyexperienceIndustry studyActuarial BestEstimate2014 (5 responses)2015 (9 responses)2018 (9 responses)2019 (9 responses)Consultant AdviceOther2017 (15 responses)Figure 32Copyright 2019 Society of Actuaries
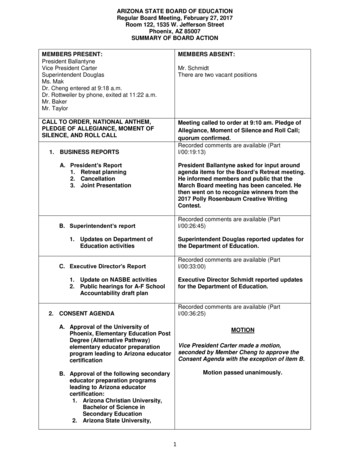
31Mortality AssumptionsCompanies were asked about their mortality assumptions in the tail in Question 9. This year’s survey shows a crossover point of companies shifting from using 2008 VBT (36%; 5 of 14) to using the 2014/15 VBT (43%; 6 of 14) as theirreference table. Only one company reported using the 2001 VBT table in the 2019 survey; see Figure 33. Thosemarking “Other” indicated that they derived mortality from company experience or tables from reinsurer experience.What reference mortality table do you use?80%70%60%50%40%30%20%10%0%0%0%2001 VBT2008 VBT2014/15 VBT2014 (20 responses)2015 (18 responses)2018 (13 responses)2019 (14 responses)Other2017 (24 responses)Figure 33Nine companies provided ultimate mortality rates per 1,000 assumed at higher attained ages for various underwritingclasses for males and females. The minimum, maximum and median of those responses are summarized below,alongside the 2008 VBT and 2015 VBT rates (ultimate, gender and tobacco distinct, age nearest birthday) forcomparison (Figure 34 through Figure 39). (Note that at advanced ages, the 2015 VBT rates are often higher than the2008 VBT rates.) For the best underwriting class, only the set of maximum rates is near the VBT tables, while otherrates are lower than the VBT tables. For other underwriting classes, the VBT tables tend to fall between the set ofmaximum rates and the set of median rates. Note that the minimum, maximum, and median responses do notnecessarily represent the response of any given company but are determined independently for each age. In addition,some companies did not provide mortality rates for the older ages.Copyright 2019 Society of Actuaries
32700Annual mortality rate per 1,000Male, Best Non-tobacco ined AgeMedianMinimumMaximum2008 VBT MNS RR70 ANB2015 VBT MNS RR70 ANBFigure 34Copyright 2019 Society of Actuaries
33700Annual mortality rate per 1,000Female, Best Non-tobacco imum105Attained Age2008 VBT FNS RR70 ANB1101151202015 VBT FNS RR70 ANBFigure 35Copyright 2019 Society of Actuaries
34700Annual mortality rate per 1,000Male, Standard Maximum100105Attained Age2008 VBT MNS RR120 ANB1101151202015 VBT MNS RR125 ANBFigure 36Copyright 2019 Society of Actuaries
35700Annual mortality rate per 1,000Female, Standard 20Attained AgeMedianMinimumMaximum2008 VBT FNS RR120 ANB2015 VBT FNS RR125 ANBFigure 37Copyright 2019 Society of Actuaries
36700Annual mortality rate per 1,000Male, Standard mum100105Attained Age2008 VBT MSM RR125 ANB1101151202015 VBT MSM RR125 ANBFigure 38Copyright 2019 Society of Actuaries
37700600Annual mortality rate per 1,000Female, Standard 100105Attained Age2008 VBT FSM RR125 ANB1101151202015 VBT FSM RR125 ANBFigure 39Copyright 2019 Society of Actuaries
38Companies were asked again this year about the number of underwriting classes used. Most companies (57%; 8 of14) responded with three non-tobacco classes, and 5 of 14 (36%) responded with four non-tobacco classes (Figure 40).For tobacco classes, two continues to be the predominant response with 93% (13 of 14) citing two tobacco classesthis year (Figure 41).How many non-smoker underwriting classes are used?100%80%60%40%20%0%1 or 232014 (20 responses)2015 (17 responses)2018 (13 responses)2019 (14 responses)42017 (24 responses)Figure 40How many smoker underwriting classes are used?100%80%60%40%20%0%122014 (20 responses)2015 (17 responses)2018 (13 responses)2019 (14 responses)3 2017 (24 responses)Figure 41Copyright 2019 Society of Actuaries
39The percentage of respondents incorporating future mortality improvement into their models has reduced to 60% (9of 15) as shown in Figure 42.Are future mortality improvements assumed in yourmodel?100%80%60%40%20%0%YesNo2014 (20 responses)2015 (18 responses)2018 (13 responses)2019 (15 responses)2017 (25 responses)Figure 42Most of the 9 companies modeling future mortality improvements had improvement assumptions that were genderor age distinct, and about half made a distinction by duration. A smaller proportion (33%; 3 of 9) made a distinctionby smoker status for this year’s survey (Figure 43).By what parameters do future mortality improvements vary?(% of "Yes" responses)100%80%60%40%20%0%Male / FemaleSmoker statusAge2014 (15 responses)2015 (13 responses)2018 (10 responses)2019 (9 responses)DurationOther2017 (15 responses)Figure 43Copyright 2019 Society of Actuaries pa
The latest survey regarding Universal Life with Secondary Guarantees reflects a different response group from those in the prior survey. Some of the changes described below reflect different respondents, not necessarily a change by any given company. The SOA research office was able to confirm that 7 of the participating companies