Transcription
Article fromProduct Matters!August 2020
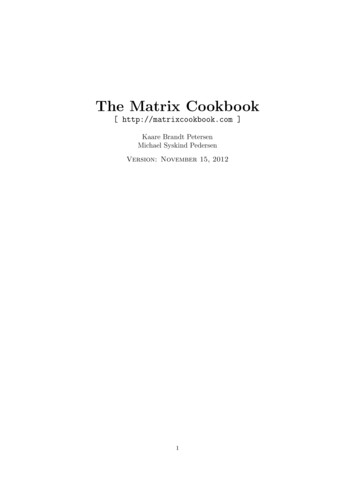
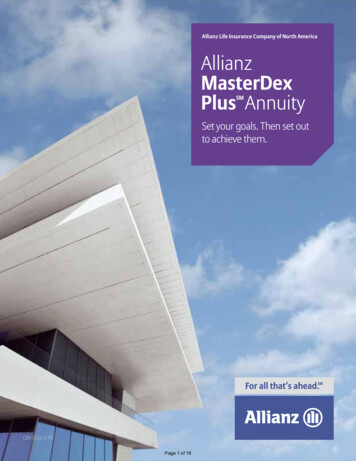
PRODUCT MATTERS!AUGUST 2020Universal Life andIndexed Universal LifeSurvey ResultsBy Susan J. SaipMilliman recently completed its 13th annualcomprehensive survey addressing universal life (UL) andindexed UL (IUL) issues. UL/IUL products continue toplay a significant role in the individual life insurance market.According to LIMRA, for the past five years the market shareof these products has been stable at 35 percent to 38 percent oftotal life sales measured by first-year premium. Survey results arebased on responses from 30 carriers of UL and IUL products.The survey covers a range of specific product and actuarialissues such as sales, profit measures, target surplus, reserves,risk management, underwriting, product design, compensation,pricing and illustrations.The following products (as defined here) are included in thescope of the survey: UL/IUL with secondary guarantees (ULSG/IULSG). AUL/IUL product designed specifically for the death benefitguarantee market that features long-term no-lapse guarantees (guaranteed to last until at least age 90) either through arider or as a part of the base policy. Cash accumulation UL/IUL (AccumUL/AccumIUL). AUL/IUL product designed specifically for the accumulationoriented market, where efficient accumulation of cash valuesto be available for distribution is the primary concern of thebuyer. Within this category are products that allow for highearly cash value accumulation, typically through the electionof an accelerated cash value rider. Current assumption UL/IUL (CAUL/CAIUL). A UL/IUL product designed to offer the lowest-cost death benefit coverage without secondary death benefit guarantees.Copyright 2020 Society of Actuaries. All rights reserved.Within this category are products sometimes referred to as“dollar-solve” or “term alternative.”Throughout this article, the use of the term UL is assumed toexclude IUL.Note that input comes from survey participants related tothe UL/IUL environment in late 2019. Data does not reflectthe current interest rate environment or the impact of thecoronavirus (COVID-19) pandemic. The key discoveries of thesurvey are highlighted in this article.UL SALESFigure 1 illustrates the product mix of UL sales reported by 26of the 30 survey participants for calendar years 2017 and 2018,and for year-to-date (YTD) 2019 as of Sept. 30, 2019 (YTD9/30/19). Sales were defined as the sum of recurring premiumsplus 10 percent of single premiums for purposes of the survey.PRODUCT MATTERS! 10
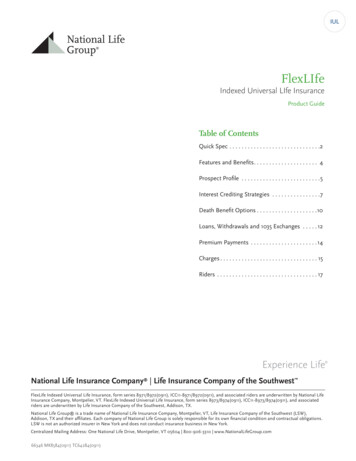
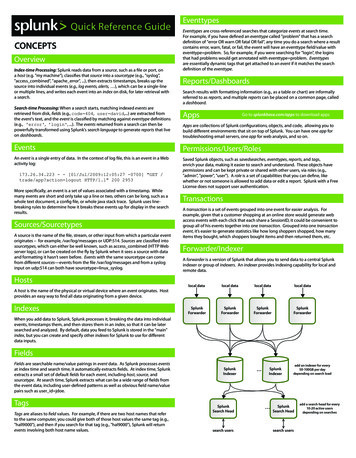
Universal Life and Indexed Universal Life Survey ResultsFigure 1Figure 1UL ProductUL ProductMix byMixYearby YearPercent of Total Individual UL 13%16%13%2018ULSGAccumUL15%YTD mulationlife; CAUL,currentassumptionuniversallife;ULSG, universalAbbreviations:AccumUL, cashaccumulationlife; CAUL, universalcurrent assumptionuniversallife; ULSG,universal life withsecondaryguarantees;YTD, year tolifedate.withsecondary guarantees; YTD, year to date.UL sales declined significantly when comparing 2017 sales Fully underwritten. Complete set of medical history questions and medical or paramedical exam, except where ageto annualized YTD 9/30/19 sales. Total individual UL salesand amount limits allow for nonmedical underwriting.decreased 31 percent, with 14 of the 26 participants reportingUL salesdeclinedsignificantlywhencomparing2017 sales to annualized YTD 9/30/19 sales. Totaldecreasesin theirUL sales.Eleven of the14 reporteddecreasesFor AU sales, participants were instructed to include total salesof 20 percent or more. The decline in sales by product was 34individual UL sales decreased 31 percent, with 14 of hich AUdecreasesis offered.inThedistributionofpercent for ULSG, 24 percent for AccumUL and 26 percent for2018 UL sales by underwriting approach (on a premium basis)sales.Elevenof theof14of 20 percentor 5.0more.The decline in sales by product was 34CAULsales.One driverthereporteddecrease decreasescould be movementin waspercent SI, 0.4 percent AU and 93.9 percent fullysales from UL to IUL. Nine of the 14 participants appear to be underwritten. For YTD 9/30/19 UL sales, the distribution bypercent for ULSG, 24 percent for AccumUL and 26 percent for CAUL sales. One driver of the decreasefocusing less on UL sales and more on IUL sales. Seven of the underwriting approach was 6.9 percent SI, 0.7 percent AU andbe movementin sales infromto IUL.14 participantsappear to beForfocusingULsales, theninecouldreportedsignificant increasesIULULsalesfromNine2017oftothe92.5percent fully underwritten.both ULlessandonIULYTD 9/30/19 (on an annualized basis).portion of AU business is surprisingly low. We believe that SIsales and more on IUL sales. Seven of the nine reported significant increases in IUL sales from 2017 toand AU are more commonly used on term insurance plans thanUL YTDsales9/30/19were reportedbyunderwritingapproachfor2018UL or IUL.(on an annualized basis).and YTD 9/30/19. For the purpose of the survey, underwritingINDEXED UL SALESapproachwas weredefinedas follows:UL salesreportedby underwriting approach for 20189/30/19.Forpurposeof the accountedIUL andsales YTDreportedby 22 ofthethe30 surveyparticipantsfor 63 percent of total UL/IUL sales combined during YTDsurvey, underwritingapproach wasdefinedfollows: Simplifiedissue (SI) underwriting.Lessthan a ascomplete9/30/19, increasing from the 50 percent of total sales itset of medical history questions and no medical or paramed- represented in 2017. The AccumIUL sales percentage increasedical exam.from 2017 to YTD 9/30/19, from 88 percent to 91 percent of2 total AccumUL/AccumIUL sales. IULSG sales also increased, Accelerated underwriting (AU). The use of tools such as a from 12 percent to 19 percent of total combined ULSG/IULSGpredictive model to waive requirements such as fluids and a sales over the survey period. CAIUL sales, as a percentage ofparamedical exam on an otherwise fully underwritten prod- total combined CAUL/CAIUL sales, increased from 33 percentuct for qualifying applicants without charging a higher pre- to 50 percent over this period. Figure 2 illustrates the productmium than for fully underwritten business.mix of IUL sales for calendar years 2017 and 2018 and for YTDCopyright 2020 Society of Actuaries. All rights reserved.PRODUCT MATTERS! 11
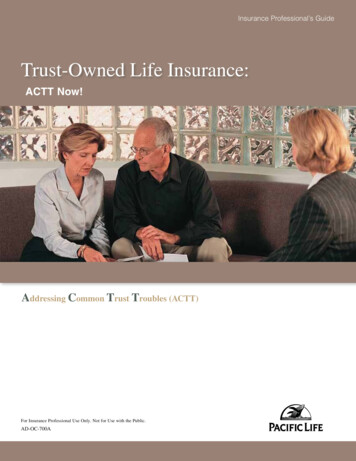
Universal Life and Indexed Universal Life Survey ResultsPercent of Total Individual IUL SalesFigure 2Figure 2IULMixMixby YearIULProductProductby 20177%10%2018IULSGAccumIUL9%YTD as of 9/30/19CAIULAbbreviations:AccumIUL,cash accumulationindexed universalindexedlife; CAIUL,universalcurrent assumptionindexedcurrentuniversal life;IULSG, Indexeduniversaluniversallife with secondaryguarantees; YTD, yearAbbreviations:AccumIUL,cash accumulationlife; CAIUL,assumptionindexedlife; IULSG,to date.Indexed universal life with secondary guarantees; YTD, year to date. Lien approach. The payment of accelerated death benefitsis considered a lien or offset against the death benefit. Accessto the cash value (CV) is restricted to any excess of the CVTheof of2018IUL(on(ona premiumbasis)by by ssalesa premiumbasis)1.2 otherpercentSI, 1.6 policyover the sum approachof the lien wasand anyoutstandingunderwriting approach was 1.2 percent SI, 1.6 percent AU andloans. Future premiums and charges for the coverage are unpercentAUfullyandunderwritten.97.1 percentForfullyunderwritten.YTD 9/30/19IUL sales, the distribution by97.1percentYTD9/30/19 IULForsales,affected, and the gross policy values continue to grow as ifthe distribution by underwriting approach was 0.6 percentthe 97.5lien didnot exist.In underwritten.most cases, lien interestunderwriting approach was 0.6 percent SI, 1.9 percent AU andpercentfullyThe charges areSI, 1.9 percent AU and 97.5 percent fully underwritten. Theassessed under this design.portionof ofIULsalessubjectto SItounderwritingwas 5 percentportionIULsalessubjectSI underwritingwas 5 topercent to 6 percent lower than reported for UL6 percent lower than reported for UL sales. The portion of IUL Dollar-for-dollar approach. There is a dollar-for-dollarsales.The toportionIUL thansalesdoublesubjecttowasAUreportedwas moredouble whatwasreportedfor ULsalessubjectAU wasofmorewhatfor than reductionin thespecifiedamountor sales.face amount of theUL sales.base plan and a pro rata reduction in the CV based on the9/30/19. Sales of AccumIUL products continued to dominatethe IUL market throughout the survey period.LIVINGBENEFITBENEFITRIDERRIDER SALESSALESLIVINGpercentage of the specified amount or face amount that wasaccelerated.There are three common approaches to chronic illnessaccelerated(ADB)riders: thetodiscounteddeath accelerated death benefit (ADB) riders: theThere aredeaththreebenefitcommonapproacheschronic illnessbenefit approach, the lien approach and the dollar-for-dollar Of the 26 participants reporting UL sales, 13 reported UL saleswithillness ADB riders.Fourteenthe 22 IUL surveydiscountedbenefit approach,lien h theincludesan explicit DB riders.premium, but the other approaches do not. Definitions of thedollar approach includes an explicit premium, but the otherapproachesdonot. Definitionsofchronicthe illness riders.Tenofthe14alsoreportedULsaleswithvarious approaches are as follows:various approaches are as follows: Discounted death benefit approach. The insurer pays the Figure 3 summarizes sales of chronic illness riders as aowner a discounted percentage of the face amount reduction, percentage of total sales by premium (separately for UL and Discounted death benefit approach. The insurer pays the owner a discounted percentage of thewith the face amount reduction occurring at the same time IUL products). During YTD 9/30/19, sales of chronic illnessriders as occurringa percentagesaleswereas11.4as the acceleratedbenefitpayment. withThis approachthe reductionface amountreduction,the face avoidsamountat ofthetotalsametimethepercent for ULproductsand37.3percentforIULproducts.The differenceneed for charges up front or other premium ctdevelopmentfor the rider, because the insurer covers its costs of early payment of the death benefit via a discount factor.in recent years relative to that for UL products.4Copyright 2020 Society of Actuaries. All rights reserved.PRODUCT MATTERS! 12
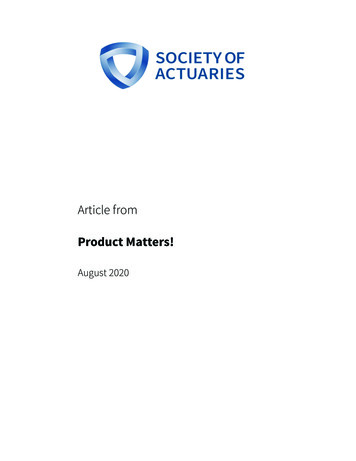
Universal Life and Indexed Universal Life Survey ResultsFigure 3Chronic Illness Rider Sales as a Percentage of Total SalesTotalCalendar IndividualYearULULSGCashCurrentAccumulation AssumptionULULUL Sales With Chronic Illness Riders as a Percentage ofTotal UL ar IndividualAccumulation AssumptionYearIULIULSGIULIULIUL Sales With Chronic Illness Riders as a Percentage ofTotal IUL .2%YTD9/30/1937.3%29.1%40.8%13.3%Abbreviations: IUL, indexed universal life; IULSG, indexed universal life with secondaryguarantees; UL, universal life; ULSG, universal life with secondary guarantees; YTD, year to date.Figure 4 shows sales of long-term care (LTC) riders as a percentageof total sales (measured by premiums and weighting singlepremium sales at 10 percent) for UL and IUL products separatelyby product type. During YTD 9/30/19, sales of policies with LTCriders as a percentage of total sales by premium were 54.6 percentfor UL products and 14.7 percent for IUL products. It is notablethat over half of UL sales by premium include an LTC rider. Inaddition, most of those sales include extension of benefit riders.Within 24 months, 90 percent of survey respondents intend tomarket either an LTC or chronic illness rider.DRIVERS OF UL/IUL PROFITABILITYThe UL/IUL survey included information about the followingkey drivers of UL/IUL pricing: profit measures and targets,target surplus,reserves,reinsurance,investment yields andexpenses.Profit Measures and TargetsThe predominant profit measure reported by survey participantscontinues to be an after-tax, after-capital statutory return oninvestment/internal rate of return (ROI/IRR). The median ROI/IRR target reported by survey participants was 10.0 percentfor ULSG, AccumUL, CAUL and IULSG; 10.5 percent forAccumIUL; and 11.0 percent for CAIUL.Figures 5 and 6 show the percentage of survey participantsreporting that they fell short of, met or exceeded their profitgoals by UL/IUL product type, for calendar year 2018 and YTD9/30/19, respectively. Of note is the percentage of participantsthat fell short of their profit goals for ULSG products: 44percent in 2018 and 50 percent during YTD 9/30/19. Theprimary reasons reported for not meeting profit goals werelower interest earnings and higher expenses.Figure 4LTC Rider Sales as a Percentage of Total Sales by tAccumulation AssumptionULULUL Sales With LTC Riders as a Percentage of Total UL dividualIULCashCurrentAccumulation AssumptionIULSGIULIULIUL Sales With LTC Riders as a Percentage of Total IUL .6%YTD9/30/1914.7%20.4%13.8%16.8%Abbreviations: IUL, indexed universal life; IULSG, indexed universal life with secondaryguarantees; UL, universal life; ULSG, universal life with secondary guarantees; YTD, year to date.Copyright 2020 Society of Actuaries. All rights reserved.PRODUCT MATTERS! 13
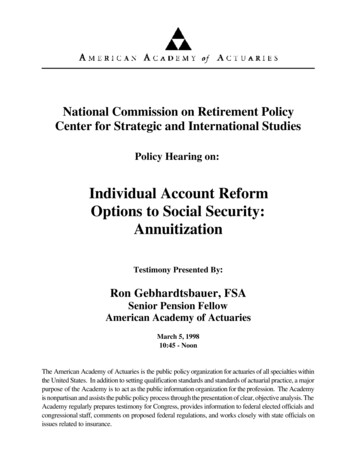
UniversalFigure5 Life and Indexed Universal Life Survey ResultsFigure 5Actual Results Relative to Profit Goals for 2018Actual Results Relative to Profit Goals for ccumulation Assumption ULULExceededMetIULSG25%14%CashCurrentAccumulation Assumption IULIULFell ShortAbbreviations: IUL, indexed universal life; IULSG, indexed universal life with secondary guarantees; UL, universal life; ULSG, universal life with secondary guarantees.Abbreviations: IUL, indexed universal life; IULSG, indexed universal life with secondary guarantees; UL, universallife; ULSG, universal life with secondary guarantees.Figure 6Actual Results Relative to Profit Goals for YTD 9/30/19Actual Results Relative to Profit Goals for YTD 9/30/19Figure cumulation Assumption ULULExceeded8MetIULSG15%CashCurrentAccumulation Assumption IULIULFell ShortAbbreviations: IUL,IUL,indexeduniversal life;IULSG, indexedlife;universallife with secondaryguarantees;UL, universalULSG,secondaryuniversal life withguarantees;secondary guarantees;YTD,year to iversallife life;withUL,universallife; ULSG, universal life with secondary guarantees; YTD, year to date.Copyright 2020 Society of Actuaries. All rights reserved.TARGET SURPLUSPRODUCT MATTERS! 14
Universal Life and Indexed Universal Life Survey ResultsTarget SurplusThe majority of survey participants continue to set target surpluspricing assumptions as a percentage of the National Associationof Insurance Commissioners (NAIC) company action level. Theoverall NAIC risk-based capital (RBC) percentage of companyaction level ranged from 250 percent to 450 percent.ReservesVarious questions were included in the survey relative toprinciple-based reserves (PBR) in accordance with the ValuationManual Chapter 20 (VM-20).The stochastic exclusion test (SET) is a means of determiningwhether the added effort of calculating stochastic reservesunder PBR is required. The majority of survey participants arenot using the SET. Of the 28 respondents, 20 are not using thetest, have not analyzed the test or PBR does not apply to them.Seven participants are using the ratio test for this aspect of VM20 relative to UL/IUL products. One participant is using thecertification option. Four of the eight participants using theSET ratio test or certification option indicated that the SETresults are consistent both pre-reinsurance and post-reinsurance.One participant noted that the results are not consistent.Two participants reported that SET results with respect toreinsurance have not been analyzed or completed. The eighthparticipant indicated that it is not modeling reinsurance at thistime because it is immaterial.Ten survey participants reported they are explicitly modelingthe deterministic reserve (DR) and stochastic reserve (SR) inpricing projections (i.e., projecting these reserve components).An additional seven participants are explicitly modeling theDR, but not the SR. The remaining 13 participants said theyare not explicitly modeling either the DR or the SR in pricingprojections or did not respond to the question.Many survey participants are struggling with challengespresented by forecasting the deterministic and stochasticreserves. Difficulties were reported with run times, scenarios,modeling and assumptions.A variety of responses were received from 18 survey participantsrelative to how their companies are reflecting reinsurance inthe DR/SR for yearly renewable term (YRT) deals. Approachesincluded not reflecting reinsurance, taking the ½ cx reservecredit for YRT deals, using prudent estimates for reinsureractions, adjusting YRT rates consistent with projected mortality,modeling expected experience with a margin on the YRTpremium, reflecting the YRT deals in the reserves and treatingreinsurance as a cash flow item in pricing.Survey participants provided responses relative to theaggregation of mortality segments for determining credibilityfor UL/IUL products. The Valuation Manual defines a mortalitysegment as “a subset of policies for which a separate mortalitytable representing the prudent estimate mortality assumptionwill be determined.” The majority expect to aggregate mortalitysegments across broad categories, such as all life products, allpermanent products or all fully underwritten products.ReinsuranceSurvey participants reported that retention limits on UL/IULbusiness ranged from 350,000 up to 30 million, with a medianlimit of 3 million and an average of about 6.1 million.Seventeen participants reported the level of reinsurance usedfor AU UL/IUL business. Seven of the 17 participants reportedthat AU UL/IUL business is being reinsured consistent withother UL/IUL business. AU business is being fully retained bysix other participants. The final four participants reported otherreinsurance approaches used with AU UL/IUL business thatsuggest the expanded use of reinsurance with these cases.The percentage of new UL/IUL business ceded in 2018 andYTD 9/30/19 reported by survey participants is shown inFigure 7. The percentages for IUL business are higher than thepercentages reported for UL business.Figure 7Percentage of New UL/IUL Business CededPercentage of New UL Business CededPercentage of New IUL Business Ceded2018YTD 9/30/192018YTD .0%90.0%100%100%StatisticNumber of ResponsesAbbreviations: IUL, indexed universal life; UL, universal life; YTD, year to date.Copyright 2020 Society of Actuaries. All rights reserved.PRODUCT MATTERS! 15
Universal Life and Indexed Universal Life Survey ResultsInvestment YieldsThe use of a new-money crediting strategy versus a portfoliostrategy in pricing UL/IUL products was reported in the survey.Figure 8 shows the split between respondents assuming a newmoney strategy and a portfolio strategy by UL/IUL product type.Figure 8UL/IUL New-Money vs. Portfolio Crediting StrategyCrediting StrategyUL/IUL ProductNew SG45%55%AccumIUL26%74%CAIUL50%50%Abbreviations: AccumIUL, cash accumulation IUL; AccumUL, cash accumulation UL;CAIUL, current assumption IUL; CAUL; current assumption UL; IUL, indexed universal life;IULSG, indexed universal life with secondary guarantees; UL, universal life; ULSG, universallife with secondary guarantees.Copyright 2020 Society of Actuaries. All rights reserved.Many survey participants arestruggling with challengespresented by forecasting thedeterministic and stochasticreserves.ExpensesActual expense levels and those assumed in pricing UL/IULproducts vary widely among survey participants. For comparisonpurposes, we converted acquisition and maintenance expensesto a dollar amount for a representative sample policy foreach participant. (Commissions and field expenses were notincluded.) The calculation was done for both pricing expensesand actual (fully allocated) expenses. We assumed an averageface amount of 500,000 issued at age 55, and premiums of 12(“low premium”) and 18 (“high premium”) per 1,000 of faceamount. The calculations were done including and excludingpremium taxes.PRODUCT MATTERS! 16
Universal Life and Indexed Universal Life Survey ResultsThe tables in Figure 9 show statistics relative to dollars of pricing and actual expenses for the representative sample policy for issueage 55, both including and excluding premium taxes.Figure 9Pricing and Actual Expenses for a Representative Sample PolicyPricing ExpensesNumber ofResponsesAverageMedianMinimumMaximumIssue Age 55—High PremiumAcquisition26 2,460 2,570 173 7,081Maintenance with premium taxes28 315 289 55 662Maintenance without premium taxes28 160 143 14 482Issue Age 55—Low PremiumAcquisition26 1,924 2,019 165 4,831Maintenance with premium taxes28 246 228 55 535Maintenance without premium taxes28 143 141 14 415Number ofResponsesAverageMedianMinimumMaximumActual (Fully Allocated) ExpensesIssue Age 55—High PremiumAcquisition20 3,357 2,794 345 14,281Maintenance with premium taxes22 362 330 207 662Maintenance without premium taxes22 201 178 32 482Issue Age 55—Low PremiumAcquisition20 2,597 2,260 345 9,631Maintenance with premium taxes22 288 269 152 531Maintenance without premium taxes22 200 178 32 482CONCLUSIONThe UL/IUL market has seen many years of evolution, withregulatory actions and economic issues commonly facing theindustry. The recent COVID-19 pandemic has forced the lifeinsurance industry to react quickly and to develop creativesolutions to survive in this challenging environment. Whatdirection will the UL/IUL market take as a consequence ofthis global crisis with its implications for mortality experience,interest rates and underwriting refinements? Following industrytrends and addressing challenges are key actions necessary tostaying competitive in this market.Copyright 2020 Society of Actuaries. All rights reserved.A complimentary copy of the key discoveries of the May 2020Universal Life and Indexed Universal Life Issues report may befound at . Susan J. Saip, FSA, MAAA, is a consulting actuary inthe Chicago office of Milliman. She can be reachedat sue.saip@milliman.com.PRODUCT MATTERS! 17
Abbreviations: Accum IUL, cash accumulation indexed universal life; CA UL, current assumptionindexeduniversal life; ULSG, Indexed universal life with secondary guarantees; YTD, year to date. The distribution of 2018 IUL sales (on a premium basis) by underwriting approach was 1.2 percent SI, 1.6 percent AU and 97.1 percent fully underwritten.