Transcription
Preliminary Estimates of the Quantities of Rare-EarthElements Contained in Selected Products and inImports of Semimanufactured Products to theUnited States, 2010By Donald I. Bleiwas and Joseph GambogiOpen-File Report 2013–1072U.S. Department of the InteriorU.S. Geological Survey
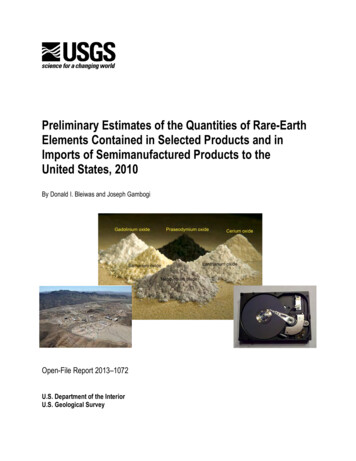
U.S. Department of the InteriorKEN SALAZAR, SecretaryU.S. Geological SurveySuzette M. Kimball, Acting DirectorU.S. Geological Survey, Reston, Virginia: 2013For more information on the USGS—the Federal source for science about the Earth,its natural and living resources, natural hazards, and the environment—visithttp://www.usgs.gov or call 1–888–ASK–USGSFor an overview of USGS information products, including maps, imagery, and publications,visit http://www.usgs.gov/pubprodTo order other USGS information products, visit http://store.usgs.govSuggested citation:Bleiwas, D.I., and Gambogi, Joseph, 2013, Preliminary estimates of the quantities of rare-earth elementscontained in selected products and in imports of semimanufactured products to the United States, 2010:U.S. Geological Survey Open–File Report 2013–1072, 14 p., http://pubs.usgs.gov/of/2013/1072/.Any use of trade, firm, or product names is for descriptive purposes only and does not implyendorsement by the U.S. Government.Although this information product, for the most part, is in the public domain, it also may containcopyrighted materials as noted in the text. Permission to reproduce copyrighted items must besecured from the copyright owner.Cover. Left: Aerial photograph of Molycorp, Inc.’s Mountain Pass rare-earth oxide mining and processing facilities in Mountain Pass,California. (Photograph courtesy of Molycorp, Inc., used with permission.) Middle: Oxide compounds manufactured from selectedrare-earth elements in powdered form. (Photograph courtesy of Peggy Greb, Agricultural Research Center, United States Departmentof Agriculture.) Right: A hard drive from a personal computer; the spindle motor and a voice coil contain rare-earth magnets.
ContentsAbstract . 1Introduction . 1Chemical Classification of Rare-Earth Elements . 2Mineralogical Occurrence of Rare-Earth Elements . 2How Rare-Earth Elements Are Used . 4Exploration Activity and Vulnerability of Supply . 5Current Sources of Production . 6Preliminary Estimates of Quantities of Rare-Earth Elements in Manufactured and Imported Products .in the United States . 7Additional Research Ongoing and Planned . 11Summary and Preliminary Conclusions . 12Acknowledgments . 13References Cited . 13Figures1–3. Photographic images showing:1. The oxides of rare-earth metals gadolinium (Gd), praseodymium (Pr), cerium (Ce),samarium (Sm), lanthanum (La), and neodymium (Nd) in powdered form . 22. Molycorp, Inc.’s Mountain Pass rare-earth oxide mining and processing facilities inMountain Pass, California . 73. A hard drive from a personal computer showing a spindle motor and a voice coil thatcontainrare-earth magnets . 8Tables1. Percentage distribution of rare-earth elements by type of ore at major production sites inthe United States and China . 32. Examples of common applications of rare-earth elements . 53. Estimated weight of rare-earth oxides contained in selected manufactured products thatentered service in the United States in 2010 and in material containing rare-earth metalsthat was imported into the United States in 2010 . 9iii
Conversion FactorsInch/Pound to SIMultiplyByTo obtainMasston, short (2,000 lb)0.9072megagram (Mg); metric ton (t)ton, long (2,240 lb)1.016megagram (Mg); metric ton (t)SI to Inch/PoundMultiplyByTo obtainMassmegagram (Mg); metric ton (t)1.102ton, short (2,000 lb)megagram (Mg); metric ton (t)0.9842ton, long (2,240 lb)iv
Preliminary Estimates of the Quantities of Rare-EarthElements Contained in Selected Products and inImports of Semimanufactured Products to theUnited States, 2010By Donald I. Bleiwas and Joseph GambogiAbstractRare-earth elements (REEs) are contained in a wide range of products of economic andstrategic importance to the Nation. The REEs may or may not represent a significant component ofthat product by mass, value, or volume; however, in many cases, the embedded REEs are criticalfor the device’s function. Domestic sources of primary supply and the manufacturing facilities toproduce products are inadequate to meet U.S. requirements; therefore, a significant percentage ofthe supply of REEs and the products that contain them are imported to the United States. In 2011,mines in China produced roughly 97 percent of the world’s supply of REEs, and the country’sproduction of these elements will likely dominate global supply until at least 2020. Preliminaryestimates of the types and amount of rare-earth elements, reported as oxides, in semimanufacturedform and the amounts used for electric vehicle batteries, catalytic converters, computers, and otherapplications were developed to provide a perspective on the Nation’s use of these elements. Theamount of rare-earth metals recovered from recycling, remanufacturing, and reuse is negligiblewhen the tonnage of products that contain REEs deposited in landfills and retained in storage isconsidered. Under favorable market conditions, the recovery of REEs from obsolete products couldpotentially displace a portion of the supply from primary sources.IntroductionBecause of the United States’ reliance on nondomestic suppliers of rare-earth elements(REEs), identification of the types and amounts of REEs imported both as impure and refinedmetals and oxides and intermediate (semimanufactured) products, as well as those contained(embedded) in the components of a wide range of products presently in use, is of economic andstrategic importance to the Nation. These types of information help in determining thesignificance of disruptions in the supply of these materials, as well as the amounts of REEs thatare potentially available for recycling.REEs embedded in products may or may not represent a significant component of thatproduct by weight, value, or volume; however, in many cases, the embedded REEs are criticalfor the device’s function. For example, the neodymium-iron-boron magnets used in the spindlemotors and voice coils of personal computers are considered embedded materials, and althoughthe magnets make up only a small portion of the computer, they are essential to its function.1
This report provides the results of initial research undertaken by the U.S. GeologicalSurvey (USGS) to assess the amount of REEs that flow through the U.S. economy annually. Thisresearch has thus far focused on assessing the quantity of REEs contained in selected products inuse in the United States and in selected imports of intermediate products in 2010. Some chemicaland mineralogical information on REEs and on current sources of production is also included.Chemical Classification of Rare-Earth ElementsThe International Union of Pure and Applied Chemistry defines the REEs as the set of15 chemical elements in the periodic table with atomic numbers 57 through 71 (the lanthanides),plus scandium and yttrium (Connelly and others, 2005). The lanthanides include, in order ofatomic number, lanthanum, cerium, praseodymium, neodymium, promethium, samarium,europium, gadolinium, terbium, dysprosium, holmium, erbium, thulium, ytterbium, and lutetium.Several rare-earth metal oxides in powdered form are shown in figure 1.Figure 1. The oxides of rare-earth metals gadolinium (Gd), praseodymium (Pr), cerium (Ce),samarium (Sm), lanthanum (La), and neodymium (Nd) in powdered form. Photograph courtesyof Peggy Greb, Agricultural Research Center, U.S. Department of Agriculture.REEs are often classified as either light rare-earth elements (LREEs) or heavy rare-earthelements (HREEs). The classification is based in part on the LREEs having unpaired electrons inthe 4f electron shell and HREEs having paired electrons in the 4f electron shell. The LREEsinclude the elements from atomic number 57 (lanthanum) through atomic number64 (gadolinium); the HREEs include the elements from atomic number 65 (terbium) throughatomic number 71 (lutetium) and also yttrium (atomic number 39).Mineralogical Occurrence of Rare-Earth ElementsThe principal ores from which REEs are extracted are characterized by the mineralsbastnäsite, loparite, monazite, lateritic ion-adsorption clays, and xenotime. Bastnäsite is theleading ore mineral source of REEs in the world; it is enriched with cerium, lanthanum,2
neodymium, praseodymium, and other REE (U.S. Bureau of Mines and U.S. Geological Survey,1980). Historically, bastnäsite has been a source primarily of LREEs. Bastnäsite is produced inChina and the United States. Loparite, which is an oxide that contains niobium, REEs, sodium,and titanium, occurs with certain alkaline rocks of magmatic origin. One mine in Russiaproduces loparite containing 30 to 36 percent REEs. Monazite is a phosphate mineral thatcontains REEs and the radioactive element thorium. Although monazite has been and could beproduced as a byproduct of many heavy-mineral operations, limited demand for thorium, and insome cases, environmental concerns associated with the radioactive nature of the mineral, hasled all domestic and most foreign producers to stop recovering monazite. Monazite continues tobe produced in Brazil and India. Xenotime, a phosphate mineral that is rich in yttrium andHREEs, has been produced from cassiterite deposits in Malaysia and is a potential byproductfrom the production of certain heavy-mineral placer deposits. Lateritic deposits in JiangxiProvince in southern China contain lateritic ion-adsorption clays that have rare-earth ionsadsorbed into their mineral structure. These deposits make up the world’s principal supply sourceof yttrium and the other HREEs (Gambogi and Cordier, 2012). Table 1 shows the percentagedistribution of REEs (by type of ore) of major producing sites in China and the United States.Table 1. Percentage distribution of rare-earth elements by type of ore at major production sites in theUnited States and China.[Data are percentage of total rare-earth elements in ore and are rounded to no more than three significant digits; maynot add to totals shown. Rare-earth elements are listed in ascending order of atomic number]Rare-earth �siteMonaziteMountain Pass,Bayan Obo, InnerNangang,Calif., United States1Mongolia, China2Guangdong, trace0.14100100100XenotimeRare-earth lateriteSoutheastXunwu, JiangxiLongnan, JiangxiGuangdong, China4Province, China5Province, .000.703.5031.703.002.203.902.800.200.500.103
Table 1. Percentage distribution of rare-earth elements by type of ore at major production sites in theUnited States and China.—Continued[Data are percentage of total rare-earth elements in ore and are rounded to no more than three significant digits; maynot add to totals shown. Rare-earth elements are listed in ascending order of atomic ng, China45.001.209.102.605.601.306.001.801001Johnson and Sisneros, 1981.2Zang and others, 1982.3Xi, Zhang, 1986.4Nakamura, 1988.5Government of Jiangxi Province, 1985.Rare-earth lateriteXunwu, JiangxiLongnan, JiangxiProvince, China5Province, trace0.700.302.500.100.40100100How Rare-Earth Elements Are UsedREEs were first isolated by researchers in the late 1700s. It was not until the 1930s thatthe unique characteristics of REEs found commercial application when cerium oxide wasemployed as a component of compounds used to polish glass. The chemical reaction of thecompound with glass forms cerium silicate, which fills microscopic scratches in the glass; thischemical change, along with cerium’s physical hardness, makes it an excellent polishing agent.The next significant commercial application was introduced in the 1960s when europium andyttrium were incorporated as components of phosphors to produce red in color television images(Gschneidner and Capellen, 1987; Gupta and Krishnamurthy, 2005). By the beginning of the21st century, REEs (individually and in combination with other REEs) were components in morethan 200 products across a wide range of applications, including batteries, catalysts, ceramics,electronics, glass, lasers, medicine, phosphors, polishes, and metallic alloys (includingpermanent magnets) (Gupta and Krishnamurthy, 2005). The elements are used in such commonhigh-tech consumer products as cellular telephones, computer hard drives, electric and hybridvehicles, and flat-screen monitors and televisions. They are also used in a significant array ofdefense applications, including in actuators on the fins of guided missiles and other munitions,such as smart bombs; electronic displays; fiber optics; guidance systems for drone aircraft; lasersfor various applications; optics, such as lenses and night vision systems; and radar and sonarsystems (Rare Earth Industry and Technology Association, 2009; Robinson, 2011). Table 2 listssome common applications of REEs.4
Table 2. Examples of common applications of rare-earth elements.Chemical element1ApplicationAlloys and metallurgical mpsXXXXXLasersXXXXXXXXXXMedical and pharmaceutical usesXNeutron XXXXXXXXXXXXXXXXXXXXXXXXXXXXXXXXXXXXXXXXXXX1The symbols used for chemical elements in this table include the following (in order of atomic number):Sc, scandium; Y, yttrium, La, lanthanum; Ce, cerium; Pr, praseodymium; Nd, neodymium; Pm, promethium;Sm, samarium; Eu, europium; Gd, gadolinium; Tb, terbium; Dy, dysprosium; Ho, holmium; Er, erbium;Tm, thulium; Yb, ytterbium; and Lu, lutetium.Heavy rare-earth elements (HREEs) are less abundant relative to the light rare-earthelements (LREEs). Among the most important HREEs used in advanced technologies aredysprosium, europium, neodymium, terbium, and yttrium. HREEs (especially dysprosium,europium, neodymium, terbium, and yttrium) are typically less common in rare-earth mineraldeposits than are LREEs (table 1). The market price per unit of rare-earth-oxide equivalent forHREEs is considerably higher than for LREEs given the relatively strong demand for themcoupled with their relative scarcity. Because of their importance for advanced technologies, anincrease in the demand for HREEs is likely unless substitutions are discovered or advances aremade to existing technologies so the products do not require—or at least require less—of therare-earth metals.Exploration Activity and Vulnerability of SupplyExploration activity at present emphasizes the search for deposits that are relatively highin HREEs (rather than LREEs) because of the anticipated proportionately greater increase indemand and higher value of HREEs than LREEs. It is likely, however, that China will remain theonly significant primary source of most HREEs, such as dysprosium, for the next several years(Gimurtu, 2012). The development of REE deposits is based on factors that include the elementaldistribution of the REEs and the grade and tonnage, the mineral processing requirements, thegeographic location, and the environmental remediation requirements. Numerous explorationand development projects are underway that may not only increase world production of REEsbut also introduce new sources of supply. By 2018, significant new or expanded mine productionmay be underway in Australia, Canada, Greenland, South Africa, Sweden, and the United States.5
To address questions of supply and demand for REEs, in 2011, the 111th U.S. Congressmandated that the U.S. Secretary of Defense conduct an assessment of REE supply-chain issuesand develop a plan to address the country’s vulnerability to supply shortages. TheU.S. Department of Defense was required to assess which REEs meet the following criteria:(a) the rare-earth material is critical to the production, sustainment, or operation of significantU.S. military equipment; and (b) the rare-earth material is subject to interruption of supply basedon actions or events outside the control of the Government of the United States. In March 2012,the DOD identified seven REEs (dysprosium, erbium, europium, gadolinium, neodymium,praseodymium, and yttrium) that were critical to the production, sustainment, or operation ofsignificant U.S. military equipment and were subject to the interruption of supply. NewU.S. production of the seven REEs was expected to satisfy consumption for defense needs, withthe exception of yttrium. Additional assessments of the REE supply chain were ongoing.In 2012, the United States joined with Japan and the European Union to bring a WorldTrade Organization (WTO) joint-dispute-resolution case against China. The case was broughtbecause of China’s restrictive policies on trade of certain rare-earth and other minerals (BaileyGrasso, 2012). The WTO’s review of the case is ongoing.Current Sources of ProductionThe United States relies primarily on nondomestic sources of production for its supply ofREEs. In 2011, mines in China produced roughly 97 percent of the world’s supply of REEs.Much of the output from China, especially the more valuable HREEs, was used within China toproduce value-added products, many of which were exported. Although modest changes toglobal supply patterns could take place in the next few years, a significant portion of the globalsupply chain of rare-earth ores and concentrates and of refined, intermediate, and final productsthat contain rare-earth metals is likely to be firmly anchored to China through at least 2020. Theworld supply of intermediate materials, components, and finished products that containrare-earth metals also originates in Asia, especially Japan. These include refined metals and suchproducts as consumer goods, electronic components, and permanent magnets that are made frommaterials supplied mainly by China. Some of these intermediate products are then exported backto China, assembled into finished products, and exported to global consumers.With respect to domestic production, about 3,000 metric tons (t) of rare-earth-oxideequivalents was produced from stockpiled concentrate at Molycorp Inc.’s Mountain Pass Mine inCalifornia in 2011 (fig. 2; Elmquist, 2011; Sullivan, 2012). The mine originally opened as arelatively small operation in 1952, but it dominated world REE production from the 1960sthrough the 1990s (Olson and others, 1954). Mining of ore was halted in 2002 for economic andenvironmental reasons, although processing of previously mined ore continued (Molycorp, Inc.,2012b). In 2012, the Mountain Pass operation began once again to mine ore, and Molycorpexpected to produce 19,050 t of rare-earth oxide equivalents by the end of the third quarter of2012 (Molycorp, Inc., 2012a). As of the end of 2012, the Mountain Pass Mine was the onlydomestic source of primary REEs. Except for a small amount of material that is recycled, thebalance of REEs and intermediate compounds containing REEs in the United States and much ofthe components and products in which REEs are incorporated have been imported. In 2012,Molycorp reported that it had entered into several agreements to supply cerium, lanthanum,neodymium, and other rare-earth-based products to domestic and foreign companies from theMountain Pass operation and from recently acquired subsidiaries in Arizona and Estonia(Mining.com, 2011).6
AFigure 2. Aerial photograph of Molycorp, Inc.’s Mountain Pass rare-earth oxide miningand processing facilities in Mountain Pass, California. Photograph courtesy of Molycorp, Inc.,used with permission.Preliminary Estimates of Quantities of Rare-Earth Elements inManufactured and Imported Products in the United StatesDetermination of the amount (tonnage) of REEs entering the U.S. economy or in serviceat a particular time period can be approximated by collecting data on (a) how the metal is used(its applications), (b) the amount of the metal that is used in specific products, and (c) thenumber of units produced and (or) sold. Such data are necessarily rough estimates because theamounts of material used in similar products can differ; also, companies often consider this typeof information to be confidential and the data are therefore unavailable. For example, datapertaining to the composition and amounts of domestically produced cerium-basedglass-polishing compounds, which is a major use for cerium, were not able to be estimated forthis report because of the confidential nature of the data. Once the types, proportions, and weightof rare-earth metals and other elements contained in components of “typical” products areknown, the data can then be multiplied by the estimated number of units that entered theeconomy to come up with the rough estimate of the tonnage entering the economy.Table 3 lists the estimated tonnage of REEs, expressed in terms of oxides (the industrystandard), contained in selected products that entered the U.S. economy in 2010. It was compiledusing the approach discussed above. Most of the estimates for contained rare-earth metals intable 3 were developed from published information that is publicly available and from dataprovided by sources in Government agencies, industry, and universities. The estimates weredeveloped for 2010 primarily from import-export data from UBM Global Trade’s PortImport/Export Reporting Service (PIERS) and from data collected, maintained, and analyzed bythe USGS, other Federal agencies, and private companies. In addition, numerous disc drives andmobile phones were dismantled and their magnets removed and weighed to obtain data onembedded REEs. In some cases, a manufacturer’s labeling of a component was used todetermine its rare-earth content. Consumption data were derived from an assortment of statistics7
that included the number of units imported, domestic sales, and unit production. The estimates intable 3 will likely be revised as new information is received and (or) becomes available.Approximately 12,000 t of rare-earth oxides was contained in the selected productsshown in table 3, of which nearly 65 percent was lanthanum oxide used in electric and hybridvehicles and fluid catalytic cracking catalysts for petroleum. Neodymium oxide and ceriumoxide each composed 14 percent of the total. Neodymium is an important component of magnetsin electronic devices and in catalysts used in petroleum refining. About 80 percent of the ceriumoxide was used in automotive catalytic converters.Table 3 indicates that, in 2010, roughly 15,000 t of rare-earth oxides was contained inimported impure metals and oxides, refined metals and oxides, and intermediate products. Someof these materials were reexported in their original form and as intermediate and finishedproducts. About 53 percent of the contained REEs was lanthanum oxide and 24 percent wascerium oxide. Most of the lanthanum oxide was for the domestic manufacture of automotivecatalytic converters, batteries, and catalysts for petroleum cracking (the largest use, by weight, ofREEs in the United States), and phosphors for light bulbs. Cerium was imported primarily ascerium oxide and was used mostly in the production of automotive catalytic converters,phosphors, and for glass polish. Oxides of cerium, lanthanum, europium, terbium, and yttriumwere contained in imports of fluorescent bulbs (the great majority of fluorescent bulbs are notproduced in the United States). The intermediate products included magnets, primarily of theneodymium-iron-boron type, that have a broad range of applications, including computers withhard drives (fig. 3), phosphors for lighting, and compounds used in producing nickel-metalhydride batteries. Assembled, or “finished,” products are not included in the data in table 3.Figure 3. Photograph of a hard drive from a personal computer showing (A) a spindlemotor and (B) a voice coil that contain rare-earth magnets.8
Table 3. Estimated weight (in metric tons) of rare-earth oxides contained in selected manufactured products that entered service in the United Statesin 2010 and in material containing rare-earth metals that was imported into the United States in 2010.[Estimates are rounded to two significant figures. t, metric tons; dashes (--), no data; Do., ditto.; LED, light-emitting diode; OEM, original equipment manufacturer.Rare-earth oxides: CeO2, cerium oxide; Dy2O3, dysprosium oxide; Er2O3, erbium oxide; Eu2O3, europium oxide; Gd2O3, gadolinium oxide; La2O3, lanthanum oxide;Lu2O3, lutetium oxide; Nd2O3, neodymium oxide; Pr6O11, praseodymium oxide; Sm2O3, samarium oxide; Tb4O7, terbium oxide; Y2O3, yttrium edrare-earth oxidesMass of compound in manufactured products that entered service in 2010, in metric .Do.Do.Do.Zinc-basedcoatings for lightgage steelsupports1Electric andhybrid vehiclesAutomotivecatalyticconvertersFluid catalyticcracking (FCC)catalysts )Cell phone andother mobiledevicesElectric andhybrid vehiclemotorsElectronic powersteering invehiclesExternal discdrives for serversGame consolesOEM speakers invehiclesPersonalcomputers 5----------------------44030--------
Table 3. Estimated weight (in metric tons) of rare-earth oxides contained in selected manufactured products that entered service in the United Statesin 2010 and in material containing rare-earth metals that was imported into the United States in 2010.—Continued[Estimates are rounded to two significant figures. t, metric tons; dashes (--), no data; Do., ditto.; LED, light-emitting diode; OEM, original equipment manufacturer.Rare-earth oxides: CeO2, cerium oxide; Dy2O3, dysprosium oxide; Er2O3, erbium oxide; Eu2O3, europium oxide; Gd2O3, gadolinium oxide; La2O3, lanthanum oxide;Lu2O3, lutetium oxide; Nd2O3, neodymium oxide; Pr6O11, praseodymium oxide; Sm2O3, samarium oxide; Tb4O7, terbium oxide; Y2O3, yttrium edrare-earth oxidesMass of compound in manufactured products that entered service in 2010, in metric tons—ContinuedPhosphorsPhosphors anddiodesSolutionsTOTALFluorescentbulbs2LED televisions3Imaging 0.0049--------------0.11----------23 to 70----------------1,700455023 to 707,6001,7005056740--4.26701,5006Mass of compound in materials imported in 2010, in metric tons10Catalysts,electronics, fueladditives, glass,imagingcontrast dyes,magnets,nuclear fuelrods, phosphors,polishingpowders, andothersImported refinedmetal and oxides,impure, andintermediateproducts4, 53,600253325807,90027590948.81Includes only GALFAN , which contains approximately 0.1 percent rare-earth oxide in a hot-dip coat that makes up about 2 percent of the total weight of the steel.2Includes phosphors used in tube-type and compact fluorescent lights.3Estimates are based on the number of LED televisions sold in the United States in 2010 and assumes a 42-inch screen.4Some material may be exported in various forms. Estimate does not include finished products, such as contrast dye.5Based on United Business Med
Left: Aerial photograph of Molycorp, Inc.'s Mountain Pass rare-earth oxide mining and processing facilities in Mountain Pass, California. (Photograph courtesy of Molycorp, Inc., used with permission.) Middle: Oxide compounds manufactured from selected rare-earth elements in powdered form.