Transcription
(2022) 21:68Clark et al. Environmental en AccessRESEARCHMaternal serum concentrationsof one‑carbon metabolism factors modifythe association between biomarkers of arsenicmethylation efficiency and birth weightJeliyah Clark1,2, Paige Bommarito1, Miroslav Stýblo2,3, Marisela Rubio‑Andrade4, Gonzalo G. García‑Vargas4,Mary V. Gamble5 and Rebecca C. Fry1,2,6*AbstractBackground: Inorganic arsenic (iAs) is a ubiquitous metalloid and drinking water contaminant. Prenatal exposure isassociated with birth outcomes across multiple studies. During metabolism, iAs is sequentially methylated to monoand di-methylated arsenical species (MMAs and DMAs) to facilitate whole body clearance. Inefficient methylation (e.g.,higher urinary % MMAs) is associated with increased risk of certain iAs-associated diseases. One-carbon metabolismfactors influence iAs methylation, modifying toxicity in adults, and warrant further study during the prenatal period.The objective of this study was to evaluate folate, vitamin B12, and homocysteine as modifiers of the relationshipbetween biomarkers of iAs methylation efficiency and birth outcomes.Methods: Data from the Biomarkers of Exposure to ARsenic (BEAR) pregnancy cohort (2011–2012) with maternalurine and cord serum arsenic biomarkers and maternal serum folate, vitamin B12, and homocysteine concentrationswere utilized. One-carbon metabolism factors were dichotomized using clinical cutoffs and median splits. Multivari‑able linear regression models were fit to evaluate associations between each biomarker and birth outcome overalland within levels of one-carbon metabolism factors. Likelihood ratio tests of full and reduced models were used totest the significance of statistical interactions on the additive scale (α 0.10).Results: Among urinary biomarkers, % U-MMAs was most strongly associated with birth weight (β 23.09, 95%CI: 44.54, 1.64). Larger, more negative mean differences in birth weight were observed among infants bornto women who were B12 deficient (β 28.69, 95% CI: 53.97, 3.42) or experiencing hyperhomocysteinemia(β 63.29, 95% CI: 154.77, 28.19). Generally, mean differences in birth weight were attenuated among infantsborn to mothers with higher serum concentrations of folate and vitamin B12 (or lower serum concentrations ofhomocysteine). Effect modification by vitamin B12 and homocysteine was significant on the additive scale for someassociations. Results for gestational age were less compelling, with an approximate one-week mean difference associ‑ated with C-tAs (β 0.87, 95% CI: 0, 1.74), but not meaningful otherwise.*Correspondence: rfry@email.unc.edu1Department of Environmental Sciences and Engineering, Gillings Schoolof Global Public Health, University of North Carolina, Chapel Hill, NorthCarolina, USAFull list of author information is available at the end of the article The Author(s) 2022. Open Access This article is licensed under a Creative Commons Attribution 4.0 International License, whichpermits use, sharing, adaptation, distribution and reproduction in any medium or format, as long as you give appropriate credit to theoriginal author(s) and the source, provide a link to the Creative Commons licence, and indicate if changes were made. The images orother third party material in this article are included in the article’s Creative Commons licence, unless indicated otherwise in a credit lineto the material. If material is not included in the article’s Creative Commons licence and your intended use is not permitted by statutoryregulation or exceeds the permitted use, you will need to obtain permission directly from the copyright holder. To view a copy of thislicence, visit http:// creat iveco mmons. org/ licen ses/ by/4. 0/. The Creative Commons Public Domain Dedication waiver (http:// creat iveco mmons. org/ publi cdoma in/ zero/1. 0/) applies to the data made available in this article, unless otherwise stated in a credit line to the data.
Clark et al. Environmental Health(2022) 21:68Page 2 of 13Conclusions: Tissue distributions of iAs and its metabolites (e.g., % MMAs) may vary according to serum concentra‑tions of folate, vitamin B12 and homocysteine during pregnancy. This represents a potential mechanism throughwhich maternal diet may modify the harms of prenatal exposure to iAs.Keywords: Inorganic arsenic, Birth weight, Gestational age, Effect modification, One-carbon metabolismBackgroundExposure to inorganic arsenic (iAs) is a substantial public health issue. As a result of its natural occurrence insoil and rock, globally, at least 200 million individuals areexposed at harmful levels in contaminated groundwater[1, 2]. In addition to contaminated drinking water, iAsexposure can also occur through diet (e.g., rice intake)[1]. Exposure to iAs is associated with adverse healthoutcomes [2] and is of particular concern for pregnantwomen due to associations with lower birth weight andpreterm delivery [3–6]. Arsenic crosses the placentaand has been associated with molecular alterations infetal cells and tissue [7–12]. Potential mechanisms linking prenatal iAs exposure to adverse birth outcomes mayinclude generalized oxidative stress, epigenetic dysregulation of key genes involved in fetal growth, and alteredfunction and expression of genes critical to proper placentation [7–10, 13]. As an example, higher iAs exposureis positively associated with cord blood expression ofSoluble Fms-Like Tyrosine Kinase-1 (sFLT1), an antagonist of Vascular endothelial growth factor (VEGF) [10].Impacts on the function and expression of genes relatedto placentation (e.g., sFLT1) and fetal growth (e.g., Potassium Voltage-Gated Channel Subfamily Q Member 1(KCNQ1)) [10, 11] observed in relation to iAs exposurecould also impair fetal development. Fortunately, modifiable factors influencing iAs metabolism may also be targets for public health intervention.iAs is metabolized and eliminated from the bodythrough a process that is influenced by micronutrientsinvolved in one-carbon metabolism. This pathway iscomposed of the folate and methionine cycles and contributes to DNA synthesis, cellular growth, and proliferation [14]. During a critical step in the pathway, the methylgroup of 5-methyl-tetrahydrofolate (5-methyl-THF) istransferred to homocysteine by methionine synthase in areaction that utilizes vitamin B12 as a cofactor. This stepgenerates methionine, an amino acid and component ofseveral compounds [15]. Methionine is then activated toform S-adenosylmethionine (SAM), the primary methyldonor to iAs. Arsenic-3-methyltransferace (AS3MT)sequentially methylates iAs to mono- and dimethylarsenical species (MMAs and DMAs), using SAM as acofactor, to drive metabolism and tissue clearance. Inefficient methylation (e.g., higher urinary %MMAs) during pregnancy may indicate higher maternal and fetalexposure to trivalent MMAsIII, an arsenic species established as the most toxic form in most tissues, includingplacenta [8, 16, 17].Each methylation reaction produces a methylatedproduct and S-adenosylhomocysteine (SAH), which ishydrolyzed to homocysteine [15], a non-protein aminoacid independently associated with pregnancy complications and intrauterine growth restriction [14]. Giventhe role of one-carbon metabolism in iAs metabolism,individual susceptibility to iAs toxicity is associated withserum concentrations of folate and vitamin B12 amongadults [15, 18, 19]. Impacts during pregnancy, whereone-carbon metabolism is already strained to supportthe demands of the developing fetus, are also likely andwarrant further study. To this end, in the present studywe explore maternal serum concentrations of one-carbonmetabolism factors as potential modifiers of the relationship between biomarkers of methylation efficiency (e.g.,% urinary MMAs) and birth outcomes.We estimate associations between each biomarkerand (1) birth weight and (2) gestational age overall andwithin levels of folate, vitamin B12, and homocysteineusing data from the Biomarkers of Exposure to ARsenic (BEAR) pregnancy cohort. Likelihood ratio tests ofmain effects models against full models incorporatinginteraction terms were also used to evaluate statisticalinteractions, or potential effect modification, on the additive scale. We hypothesized that greater bioavailabilityof folate and vitamin B12 would increase conversion ofMMAs to DMAs, thereby attenuating negative associations between biomarkers and birth outcomes.MethodsStudy populationThe Biomarkers of Exposure to ARsenic (BEAR) cohortcomprises pregnant women who resided in Gómez Palacio, State of Durango, Mexico between August 2011 andMarch 2012 [6]. Arsenic contamination of drinking wateris a global public health issue, and the State of Durangois characterized by especially high exposure risk [20].Mothers were recruited for the study prior to delivery(usually within 24 hours of birth) at the General Hospital of Gómez Palacio, Mexico. Inclusion criteria consistedof: (a) a one-year minimum residence in the Gómez Palacio region, including urban locations of Gómez Palacioand Tlahualilo and their surrounding rural locations, (b)
Clark et al. Environmental Health(2022) 21:68a confirmed, singleton, intrauterine pregnancy withoutcomplications (e.g., preeclampsia), and (c) a good overallhealth status (e.g., no indications of chronic or acute disease). In total, 221 women were approached for the study,and 93% (n 206) provided informed consent for participation. Six of the women providing informed consentwere excluded due to a confirmed twin pregnancy (n 1)or sample collection failure (n 5), with the final cohortcomposed of 200 mother-infant pairs.Participants completed detailed questionnaires capturing information on demographic characteristics (e.g.,time at residence and socioeconomic indicators) andsources of iAs exposure (e.g., sources of drinking, cooking and bathing water). Birth weight was measured atthe time of delivery by the physician. Gestational age wasestimated using the date of each mother’s last menstrualperiod. All study procedures were previously approvedby the Institutional Review Boards at the University ofNorth Carolina at Chapel Hill and the Universidad Juárezdel Estado de Durango, and each participant gave written, informed consent to participate and provide urinesamples, drinking water samples, and umbilical cordblood.Determination of total iAs and metabolites in urineand cord serumTo characterize maternal exposure to iAs, concentrationsof iAs and its metabolites were assessed in spot urinesamples. These samples were collected at the time ofdelivery, immediately transferred to cryovials, and storedin liquid nitrogen. Urine samples packed in dry ice wereshipped to the University of North Carolina at ChapelHill for further processing. To account for differences inwater intake or differential hydration, the specific gravity(SG) of each urine sample was measured using a handheld refractometer (Reichert TX 400 #13740000; ReichertInc., Depew, NY). Additionally, urine iAs (U-iAs) andmetabolites (U-MMAs and U-DMAs) were measuredusing hydride generation atomic absorption spectroscopy (HG-AAS) with cryotrapping [21]. As applied, thismethod measured total U-iAs, total U-MMAs and totalU-DMAs, without differentiating between trivalent (AsIII) and pentavalent (AsV) species. The limits of detection (LODs) for U-iAs, U-MMAs, and U-DMAs were0.2, 0.1, and 0.1 μg/L, respectively. These LODs are basedon the previously published instrumental LODs [21, 22]and consider volume and dilution of urine samples usedfor the HG-AAS analysis. Urine samples were adjustedfor SG using the following formula: iAs x (mean SG inBEAR cohort-1)/(individual SG-1) [23]. Total urine arsenic (U-tAs) concentrations were estimated as the sum ofSG-adjusted U-iAs, U-MMAs, and U-DMAs. BiomarkersPage 3 of 13of maternal iAs methylation efficiency were calculated asthe percent of U-tAs (e.g., U-iAs/U-tAs 100%).To characterize fetal exposure to iAs, concentrations ofiAs and its metabolites in cord serum (C-iAs, C-MMAs,and C-DMAs) were measured using hydride generationwith cryotrapping coupled to inductively-coupled plasmamass spectrometry (HG-CT-ICP-MS), as described previously [24]. This technique provides sensitive LODs,and is thus suited for analysis of biological matrices withvery low levels of arsenic species, like serum [25]. LODsfor C-iAs, C-MMAs, and C-DMAs were 1.45, 0.06, and0.12 pg/L, respectively. Additional details on LODs areprovided in Laine et al. (2018) [5]. Total cord serum arsenic (C-tAs) concentrations were calculated as the sum ofC-iAs, C-MMAs, and C-DMAs.Determination of serum concentrations of folate, vitaminB12, and homocysteineFolate, vitamin B12, and homocysteine were previouslymeasured in maternal serum samples collected betweenadmission to the hospital and the time of delivery [5]. Allsamples were stored at 80 C and shipped to Columbia University, New York, NY for the determination ofserum concentrations. Maternal serum folate and vitamin B12 levels were quantified using radio protein-binding assay (SimulTRAC-S; MP Biomedicals, Orangeburg,NY, USA), and homocysteine levels were quantified viahigh performance liquid chromatography (HPLC) withfluorescence detection [26]. As described previously,and as in other iAs-exposed populations, B12 deficiencywas defined at 128 pM, folate deficiency was defined at 9 nM, and hyperhomocysteinemia (high homocysteinefor non-pregnant populations) was defined at 10.4 nM[27, 28]. One-carbon metabolism factors were not measured in mothers (n 7) with inefficient amounts of serum( 200 μL) required for analyses.Statistical analysisBiomarker levels in maternal urine or infant cord serumbelow the LOD were adjusted using the following formula:LOD/ ( 2) [29]. Descriptive statistics were calculated todescribe select characteristics of the population. Relationships between variables were estimated using Spearmancorrelation tests. Correlation tests excluded mothers delivering preterm (n 3) or those missing data on one-carbonmetabolism factors (n 7). Unadjusted and adjusted associations between biomarkers of iAs methylation efficiency(%) and first birth weight (grams) and then gestational age(weeks) were estimated overall and within levels of folate,vitamin B12, and homocysteine. Folate, vitamin B12, andhomocysteine were dichotomized using clinical cut-offs(e.g., B12-deficient mothers vs. mothers with normal B12)and median splits. Using a directed acyclic graph approach,
Clark et al. Environmental Health(2022) 21:68model covariates were selected for if they were: on anopen backdoor path and/or (2) based on their a prioristatus as determinants of low birth weight [30] (see Additional file 1). The general model form was as follows:birth outcome α X1 β Zβ ewhere birth outcome is either birth weight or gestationalage. X1 is the biomarker of iAs methylation efficiency(e.g., % MMAs). The β coefficient for Xi is the expectedmean difference in birth weight or gestational age corresponding to a 1% increase in the respective biomarker. Zβis a matrix of potential confounders. Model 1 includedthe following covariates: maternal age at delivery (years),smoking during pregnancy (0 no, 1 yes), and U-tAs(μg/L). Model 2 incorporated the same covariates andfolate, vitamin B12, and homocysteine to account forthe entire profile of one-carbon metabolism factors.Model 3 incorporated the same covariates as model 1and excluded women reporting seafood intake within7 days of providing samples to evaluate potential exposure misclassification resulting from additional sourcesof organic arsenic species in fish [31]. Models for birthweight excluded mothers delivering preterm (n 3) toreduce confounding by gestational age [32], those missing data on smoking (n 2), and those missing data onone-carbon metabolism factors (n 7), resulting in thefinal inclusion of 188 mother-infant pairs in unadjustedand adjusted models (174 where C-tAs was evaluated).Models for gestational age excluded mothers missingdata on smoking (n 2) and one-carbon metabolism factors (n 7), resulting in the final inclusion of 191 motherinfant pairs in unadjusted and adjusted models (177where C-tAs was evaluated). The leave-one-out approachwas also used in a sensitivity analysis to account for thedynamics of arsenic metabolism, as done in other studies[33, 34]. Results from models are presented as the meandifference (95% confidence interval (CI)) in birth weightor gestational age associated with a one-percent increasein each biomarker of iAs methylation efficiency.Statistical interactions (representing potential effectmodification) between biomarkers and one-carbon metabolism factors were also assessed on the additive scale usinga likelihood ratio test (LRT) to test whether an interactionmodel fit the data better than a main effects model, withstatistical significance defined at α 0.10. The (1) interaction and (2) main effect model forms were as follows:(1) Birth outcome α X1 β X2 β X3 β Zβ e(2) Birth outcome α X1 β X2 β Zβ ewhere X1 and X2 are the biomarker and one-carbonmetabolism factor, respectively, and X3 represents thePage 4 of 13interaction between the two. P-values corresponding toeach LRT are displayed alongside estimates from the corresponding stratified model.ResultsThis study includes 200 mother-infant pairs (18–41 yearsold) participating in the Biomarkers of Exposure to ARsenic (BEAR) pregnancy cohort. Women were recruited inthe State of Durango, Mexico, a region characterized byhigh exposure risk [20]. Select cohort demographics havepreviously been described [6]. In brief, nearly all (99.0%)women self-reported daily prenatal vitamin supplementintake and 21.7% reported recent seafood intake. Gestational ages ranged from 34 to 42 weeks and three infantswere born preterm ( 37 completed weeks of gestation).Fifty-two percent of newborns were male, and the meanbirth weight was 3339 g. The prevalence of low birthweight ( 2500 g) was minimal (n 4), and the averagebirth weight among male and female newborns was 3453(range of 2100 to 5120) grams and 3215 (range of 1800to 4200) grams, respectively. The distributions of iAs,MMAs, DMAs, and total arsenic (tAs) measured in urine(U-) and cord serum (C-) are detailed in Table 1. Themean concentration of U-tAs was 37.54 μg/L, rangingfrom 4.33 to 319.74 μg/L. U-tAs concentrations were alsohighly correlated with drinking water concentrations ofiAs [6]. Biomarkers of iAs exposure were below the limitof detection (LOD) for U-iAs (n 7), U-MMAs (n 4),C-iAs (n 186), C-MMAs (n 127), and C-DMAs(n 54). Since fewer than 30% of samples containedmeasurements above the LOD for C-iAs and C-MMAs,only C-tAs was used to represent fetal exposure. Themean concentrations of vitamin B12, folate, and homocysteine were 130.97 pM, 40.93 nM, and 6.86 μM, respectively. Two women were deficient in folate ( 9 nM), 142(74%) women were deficient in B12 ( 128 pM), and14 (7%) women experienced hyperhomocysteinemia( 10.4 μM).Generally, biomarkers of iAs methylation efficiencywere strongly correlated with each other (Spearmancorrelation coefficient (ρ) 0.60), but the strength ofother correlations was weak (ρ 0.40) (Fig. 1). VitaminB12 was inversely correlated with U-tAs (ρ 0.25),while homocysteine was positively correlated (ρ 0.24).Plasma folate was negatively correlated with homocysteine (ρ 0.23) and birth weight (ρ 0.15). Birthweight was also negatively correlated with % U-MMAs(ρ 0.14). Gestational age was correlated with birthweight (ρ 0.17) and vitamin B12 (ρ 0.13).Associations (95% confidence intervals (CI)) betweenbiomarkers of methylation efficiency and birth outcomes were first evaluated across all mother-infantpairs. Among urinary biomarkers, % U-MMAs was most
Clark et al. Environmental Health(2022) 21:68Table 1 Select demographic and exposure characteristics forthe Biomarkers of Exposure to ARsenic (BEAR) cohort (N 200),2011–2012Characteristicn (% non-missing) or mean,median [range]Maternal age at delivery (years)24, 23 [18–41]Page 5 of 13Table 1 (continued)eghiSmoking statusaNonsmokers185 (93.4)Current smokers13 (6.6)Prenatal vitamin daily intake197 (99.0)Recent seafood intakebNo155 (78.3)Yes43 (21.7)Gestational age (weeks)All39, 40 [34–42] 373 (1.5) 37197 (98.5)Male104 (52.0)Female96 (48.0)Newborn sexBirth weight (grams)All3339, 3355 [1800–5120]Male3453, 3490 [2100–5120]Female3215, 3150 [1800–4200]Low birth weight ( 2500 g)4 (2.0)Drinking water iAs (μg/L)24.6, 13.0 [ LODc–236.0]Urinary biomarkers (SG-adjusted)U-tAs (μg/L)37.54, 23.32 [4.33, 319.74]U-iAs (%)6.08, 5.25 [0.77–45.13]U-MMAs (%)6.43, 6.02 [0.68–24.86]U-DMAs (%)87.49, 88.48 [32.68–96.65]U-iAs (μg/L)d2.1, 1.3 [0.14–23.0]U-MMAs (μg/L)e2.3, 1.4 [0.12–18.2]U-DMAs (μg/L)33.1, 20.6 [1.4–292.5]Cord serum biomarkersC-tAs (pg/mL)1.35, 1.24 [1.15–4.0]C-iAs (%)78.83, 82.86 [25.63–88.96]C-MMAs (%)4.69, 3.68 [2.90–19.13]C-DMAs (%)16.48, 13.45 [6.88–67.61]C-iAs (pg/L)f LODC-MMAs (pg/L)g LODC-DMAs (pg/L)h0.26, 0.17 [ LOD-2.70]One-carbon metabolism factorsiaFolate (nM)40.93, 38.59 [7.06–171.46]Folate deficient ( 9 nM)2 (1.0)Homocysteine (μM)6.86, 6.37 [4.05–19.42]Hyperhomocysteinemia ( 10.4 μM)14 (7.3)B12 (pM)130.97, 117.17 [48.03–747.91]B12 deficient ( 128 pM)142 (74.6)Missing data on smoking status for 2 mothersbMissing data on seafood consumption for 2 mothersclimit of detection (LOD) 0.456 μg/LdN 7 below LODN 4 below LODfN 186 below LODN 127 below LODN 54 below LODN 7 missing data on one-carbon metabolism factorsstrongly associated with birth weight in unadjusted andadjusted models (β 23.09, 95% CI: 44.54, 1.64)(Fig. 2, Table 2). Associations with C-tAs were greater inmagnitude with wider confidence intervals (β 233.17,95% CI: 577.60, 111.26). Unadjusted associations weregenerally attenuated by the exclusion of potential outlying values (defined as values above Q3 1.5 x IQR orbelow Q1–1.5 x IQR) in the birth weight and biomarkerdistributions. Generally, adjustment for potential confounders, one-carbon metabolism factors, or excludingmothers reporting recent seafood intake attenuated associations between biomarkers and birth weight, with theexception of C-tAs, where β estimates became strongerand more negative. Using the leave-one-out approach,we included % U-MMAs as an additional covariate inthe % U-DMAs model while adjusting for potential confounders in model 1. With this approach, the β estimatefor % U-MMAs was strengthened (β 34.37, 95% CI: 73.65, 4.91) and the β estimate for % U-DMAs shiftedfrom positive to negative (β 6.66, 95% CI: 26.06,12.74) (see Additional file 2).Mean differences in gestational age were less than 0.5days for urinary biomarkers and in the unadjusted modelfor C-tAs (Table 2). Neither adjustment for covariatesnor exclusion of mothers reporting recent seafood intakehad a substantial influence on estimates for urinary biomarkers. In contrast, each one-unit increase in C-tAs wasassociated with a nearly 1-week mean difference in gestational age after adjustment for covariates (β 0.87, 95%CI: 0, 1.74) and exclusion of mothers reporting recentseafood intake (β 0.90, 95% CI: 0.31, 2.12).Adjusted models were next stratified by levels of onecarbon metabolism factors to evaluate heterogeneity ofeffects (Table 3). The negative associations between arsenic variables, including % U-iAs, % U-MMAs and C-tAs,and birth weight were stronger among women with vitamin B12 and folate below the median, as compared tothose falling within a healthier range (Figs. 3 and 4). Anopposite trend was observed in relation to % U-DMAs,where the negative association between % U-DMAs andbirth weight was more positive in relation to lower levelsof folate or vitamin B12. As an example shown in Table 3,each one-percent increase in U-MMAs was associatedwith a 14.57 g (95% CI: 57.98, 28.85) mean difference in birth weight among infants born to women with
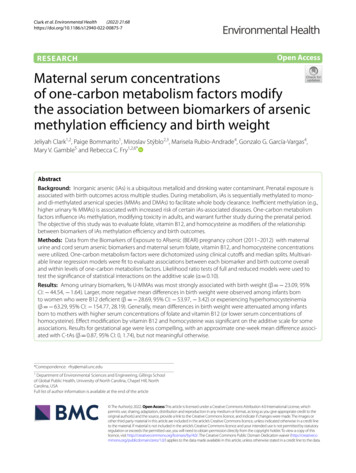
Clark et al. Environmental Health(2022) 21:68Page 6 of 13Fig. 1 Correlations between biomarkers, one-carbon metabolism factors, and birth outcomes. Excluding preterm births (n 3) and mothersmissing data for one-carbon metabolism factors (n 7). Significant (p 0.05) Spearman correlations are indicated with an asteriskFIG. 2 Unadjusted associations (standard error (SE)) between biomarkers and birth weight. Unadjusted linear regression models were fit to modelthe association (SE) between urinary biomarkers and birth weight, excluding infants born preterm (n 3) and mothers missing data for one-carbonmetabolism factors (n 7)
Clark et al. Environmental Health(2022) 21:68Page 7 of 13Table 2 Associations (95% CI) between biomarkers and birth weight (grams) and gestational age (weeks) overallUnadjusted β (95% CI)Model 1a β (95% CI)Model 2b β (95% CI)Model 3c β (95% CI)Birth weight (grams)% U-iAs% U-MMAs 4.61 ( 21.21, 11.98) 23.09 ( 44.54, 1.64) 5.55 ( 22.28, 11.19) 22.92 ( 44.50, 1.35) 3.65 ( 21.25, 13.96) 21.07 ( 45.24, 3.11)% U-DMAs7.62 ( 3.16, 18.40)7.56 ( 3.11, 18.22)7.91 ( 2.82, 18.65)6.42 ( 5.21, 18.05)C-tAs (pg As/mL) 51.47 ( 225.84, 122.90) 233.17 ( 577.60, 111.26) 238.72 ( 585.25, 107.82) 385.54 ( 892.83, 121.76)Gestational age (weeks)a 6.11 ( 22.80, 10.58) 20.84 ( 42.65, 0.97)% U-iAs0.01 ( 0.04, 0.05)0 ( 0.04, 0.05)0.01 ( 0.04, 0.05)0 ( 0.05, 0.05)% U-MMAs 0.03 ( 0.09, 0.02) 0.04 ( 0.10, 0.02) 0.04 ( 0.10, 0.02) 0.03 ( 0.10, 0.03)% U-DMAs0.01 ( 0.02, 0.03)0.01 ( 0.02, 0.04)0.01 ( 0.02, 0.04)0.01 ( 0.02, 0.04)C-tAs (pg As/mL) 0.06 ( 0.54, 0.41)0.87 (0, 1.74)0.86 ( 0.01, 1.74)0.90 ( 0.31, 2.12)Model 1 adjusts for smoking status during pregnancy, maternal age, and U-tAsbModel 2 adjusts for smoking status during pregnancy, maternal age, U-tAs, B12, folate, and homocysteinecModel 3 adjusts for smoking status during pregnancy, maternal age, and U-tAs and excludes mothers reporting recent seafood intakenormal B12 levels versus a 28.69 g (95% CI: 53.97, 3.42) mean difference in infants born to B12-deficientmothers.These trends were conserved in relation to homocysteine, where the negative association between biomarkers and birth weight was stronger among infants bornto mothers with hyperhomocysteinemia or serum concentrations equal to or greater than the median. As anexample, shown in Table 3, each one-percent increasein U-MMAs was associated with a 21.71 g (95% CI: 44.14, 0.72) mean difference in birth weight amonginfants born to women with normal levels homocysteine versus a 63.29 g (95% CI: 154.77, 28.19) meandifference among infants born to mothers with hyperhomocysteinemia. Also seen in Table 3, the negativeassociation between biomarkers and birth weight wasstrongest, yet most imprecise, in relation to C-tAs. Neither adjustment for additional one-carbon metabolismfactors nor exclusion of mothers reporting seafood intakehad a substantial influence on trends in estimates. Effectmodification was significant (likelihood ratio test (LRT)p-value 0.10) on the additive scale for homocysteine (inrelation to % U-iAs, % U-DMAs, and C-tAs) and vitaminB12 (in relation to % U-DMAs).Models evaluating gestational age were also stratifiedby levels of one-carbon metabolism factors (Table 3).No meaningful associations between urinary arsenicvariables and gestational age were observed. However, asseen in Table 3, the association between C-tAs and gestational age ranged from 0.45-weeks to 2.87-weeks,albeit with wider confidence intervals. Generally, thepositive association between C-tAs and gestational agewas stronger among infants born to mothers with higherserum levels of vitamin B12. This trend was conservedin relation to homocysteine. Effect modification wassignificant on the additive scale for folate (in relation to %U-iAs, % U-MMAs, and % U-DMAs) despite associationsnot being meaningful Table 4.DiscussionOne-carbon metabolism factors modify iAs toxicity andthe severity of iAs-associated health outcomes amongadults [19, 35], but are understudied during the prenatalperiod [15]. To this end, we tested effect modification ofassociations between biomarkers of iAs methylation efficiency and birth outcomes by folate, vitamin B12, andhomocysteine in a cohort of mother-infant pairs residing in Durango, Mexico. This region is characterized byhigh levels of arsenic in drinking water [20], ranging upto 236 μg/L. The average concentration of 37.54 U-tAs(μg/L) measured in the BEAR cohort was an order ofmagnitude higher than those measured in US pregnancycohorts (range: 1.96–28.75 μg/L) [36, 37], approachingthose observed in highly exposed populations in Bangladesh (range: 5.1–325 μg/L) [38, 39]. Effect modificationby vitamin B12 and homocysteine was significant on theadditive scale for some associations with birth weight.Using stratified models, we found that the negative association between arsenic biomarkers and birth weight wasstronger among infants born to mothers with lower levels of vitamin B12 or folate. Findings for gestational agewere less compelling, as meaningful differences were onlyobserved with respect to C-tAs. These findings highlighta potential role for maternal diet in modifying iAs-associated lower birth weight.Seventy-four percent of mothers in the BEAR cohortwere deficient in vitamin B12, a clinical conditionindependently associated with maternal and neonataloutcomes, including impaired fetal growth [40]. The relationship between vitamin B12 intake and the distribution
Clark et al. Environmental Health(2022) 21:68Page 8 of 13Table 3 Associations (95% CI) between biomarkers and birth weight (grams) within levels of one-carbon metabolism factorsBiomarkerLevelModel 1a β (95% CI)% U-iAsNormal B122.07 ( 22.72, 26.85)B12 deficient 16.81 ( 42, 8.37)0.19 79.06 ( 196.3, 38.19)0.16 22.79 ( 54.67, 9.09)0.18 17.57 ( 53.40, 18.26)0.37Normal
the role of one-carbon metabolism in iAs metabolism, individual susceptibility to iAs toxicity is associated with serum concentrations of folate and vitamin B12 among adults [1815, 19]. Impacts during pregnancy, where one-carbon metabolism is already strained to support the demands of the developing fetus, are also likely and warrant further study.