Transcription
Yoshida et al. Renal Replacement 2020) 6:60RESEARCHOpen AccessEvaluation of frailty status and prognosis inpatients aged over 75 years with chronickidney disease (CKD)Masaki Yoshida*, Yurie Takanashi, Takako Harigai, Noriyuki Sakurai, Keiko Kobatake, Hiroaki Yoshida,Satsuki Kobayashi, Takayuki Matsumoto and Kazue UekiAbstractBackground: There is a higher frequency of advanced chronic kidney disease (CKD) in frail patients than in thegeneral population. This study evaluated frailty status before initiation of dialysis and clarified the prognosis inpatients aged over 75 years with advanced CKD.Method: This study involved 310 patients who initiated dialysis between January 2011 and December 2018. Frailtywas evaluated using the Rockwood Clinical Frailty Scale (CFS). Age, sex, body mass index (BMI), laboratory data, theCharlson Comorbidity Index (CCI), geriatric syndrome (based on SPICES score), nutritional status (based on theControlling Nutritional Status [CONUT] score), and the effects of frail conditions on the prognosis were examined.Results: There were 107 robust participants (34.5%), 100 pre-frail participants (32.3%), and 103 frail participants(33.2%). The median survival time was significantly different among the robust (54.3 months), pre-frail (39.7 months),and frail participants (18.7 months) by the log-rank test (P 0.001). HR of frail group compared to robust group was1.59 (P 0.04). Pre-frail group did not show a significantly higher hazard than frail group. The other significantvariables maintained in the model were CONUT score (P 0.001), CCI, and SPICES score. The Kruskal–Wallis testshowed that CONUT score (P 0.001), SPICES score (P 0.001), and CCI (P 0.013) were significant differences inthree independent groups (robust, pre-frail, frail).Conclusion: Frail patients receiving dialysis have a poor prognosis. Frailty was associated with comorbidities,nutrition, and especially geriatric syndrome.Keywords: Frail, Clinical Frailty Scale, Charlson Comorbidity Index, SPICES score, CONUT scoreIntroductionFrailty is a major public health problem in the olderpopulation. It has been recently defined by the International Association of Gerontology and GeriatricsFrailty Consensus as reduced strength and physiologicmalfunctioning that increases an individual’s susceptibility to increased dependency, vulnerability, and death [1].Frailty can be used as a marker of adverse outcome risk* Correspondence: masakiyoshida-knz@umin.ac.jpDialysis and Nephrology Center, Sanshikai TOHO Hospital, 1155 Azami,Kasagake-machi, Midori, Gunma 379-2311, Japanin older adults and is increasingly used to predict patientoutcomes across specialties, such as nephrology, oncology, cardiology, and orthopedics.A systematic review and meta-analysis identified fivestudies incorporating 11,940 Japanese people aged 65years or older living in the community and demonstrated that the pooled prevalence of frailty, pre-frailty,and robustness based on the Fried criteria were 7.4, 48.1,and 44.4%, respectively. Stratified analyses showed thatwomen were frailer than men and that the prevalence offrailty increased with age [2]. The Author(s). 2020 Open Access This article is licensed under a Creative Commons Attribution 4.0 International License,which permits use, sharing, adaptation, distribution and reproduction in any medium or format, as long as you giveappropriate credit to the original author(s) and the source, provide a link to the Creative Commons licence, and indicate ifchanges were made. The images or other third party material in this article are included in the article's Creative Commonslicence, unless indicated otherwise in a credit line to the material. If material is not included in the article's Creative Commonslicence and your intended use is not permitted by statutory regulation or exceeds the permitted use, you will need to obtainpermission directly from the copyright holder. To view a copy of this licence, visit http://creativecommons.org/licenses/by/4.0/.The Creative Commons Public Domain Dedication waiver ) applies to thedata made available in this article, unless otherwise stated in a credit line to the data.
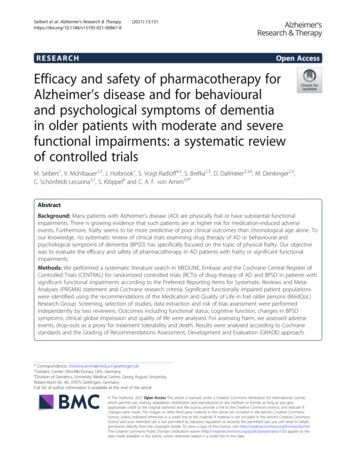
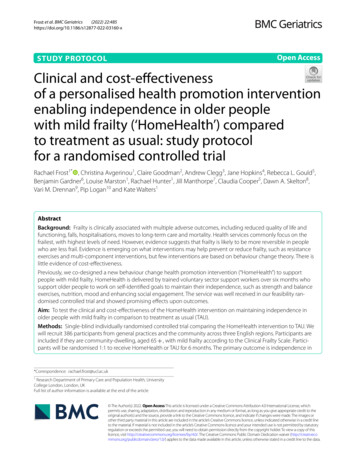
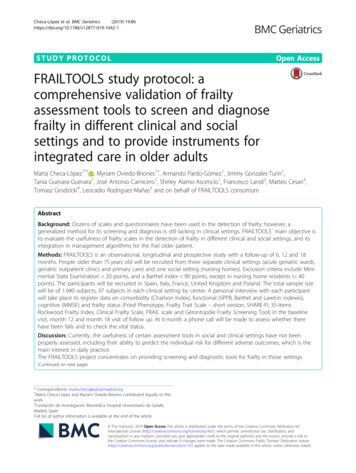
Yoshida et al. Renal Replacement Therapy(2020) 6:60There are no established criteria for diagnosing frailty, butthe Cardiovascular Health Study (CHS) criteria for frailtybased on Fried’s phenotype model (FP) [3] and the frailtyindex (FI) established by Mitnitski et al. and defined as a proportion of accumulated deficits [4] are the main methods.More recently, in the Asia-Pacific region, CFS has emergedas a well-validated 9-point global assessment tool that predicts adverse outcomes in older adults. The CFS allowsfrailty to be defined and graded using simple clinical descriptors available from routine clinical assessment [5–8].The reference standard for diagnosing frailty inCKD patients, FP, is a time-consuming evaluation andtherefore challenging to use outwith the researchenvironment.The CFS was the most effective screening method offrailty, comparable to that of the FP, suggesting it is auseful test offering prognostic value. Considering thatthe CFS has also been demonstrated to be an accuratescreening tool for frailty, as defined by the FP [9], Nixonet al. recommend its use in patients with advanced CKDand encourage systematic frailty screening programswithin nephrology services.In a report examining the relationship between frailtyand stage of chronic kidney disease (CKD) in predialysis patients in a hospital in Korea, the frequency offrailty increased as the stage of CKD progressed (stages1–2, 5.9–14.0%; stages 3–5, 10.7–56.0%). The frailpatients had a notably reduced physical and mental quality of life, as measured by the Short Form-36 Health Survey, indicating that frailty is a risk factor for mortality orrenal replacement therapy (odds ratio [OR] 2.0–2.5)[10–12]. The frequency of frailty in dialysis patients is13.8–66.7%, which is higher than in the general population and conservative CKD patients, and frailty is ofprognostic value for dialysis patients [13].There is an increasing trend of chronic dialysis patientsin Japan. The number reached about 330,000 at the end of2017. The average age of these patients was 68.43 years,and 34.2% were aged 75 years and over. The number ofnewly initiated dialysis patients is also increasing every year.In 2017, the average age of these patients was 69.68 years,and 41.6% were aged 75 years and over [14].In this study, we evaluated the frequency of frailty andthe factors associated with frailty in patients aged over75 years with CKD (stages 4–5). The aim of this studyexamined the correlation among CFS and other indicesrepresenting comorbidities, nutritional disorders, andgeriatric syndrome, considering the prognosis.Materials and methodsStudy design and sampleWe conducted a prospective cohort study of 751patients initiated dialysis between January 1, 2011,Page 2 of 12and December 31, 2018, at TOHO Hospital, Gunma,Japan.TOHO Hospital is a certified facility recognized bythe Japanese Society for Dialysis Therapy. Patients’characteristics included age, sex, body mass index(BMI), cardiothoracic ratio (CTR), laboratory data[serum albumin (Alb), serum sodium, serum potassium, estimated glomerular filtration rate (eGFR),serum chloride, corrected serum calcium, serumphosphorus, blood urea nitrogen, hemoglobin, brainnatriuretic peptide (BNP), total cholesterol, totallymphocyte count, and C-reactive protein (CRP)], theCharlson Comorbidity index (CCI) as comorbidity,SPICES score as a measure of geriatric syndrome,Controlling Nutritional Status (CONUT) score as ameasure of nutrition, and Rockwood’s Clinical FrailtyScale (CFS) as a measure of frailty. Baseline clinicaland laboratory data were collected from an electronicmedical chart before dialysis was initiated. Comorbidity data were obtained from clinic letters of eachpatient prior to admission. The presence or absenceof each comorbid condition was verified with thepatient at the time dialysis was initiated. A detailedassessment of each patient’s functional abilities andlevel of dependency was documented in the admissionreport by nurses and doctors. The report is writtenaccording to a pre-specified template. The templateincludes sections on comorbidity, patient mobility,ability to cope with activities of daily living, and thelevel of social support available or required. Thereports contain all the information required to generate a CFS, CCI, and SPICES score for each patient.Inclusion criteria were patients aged over 75 years.Exclusion criteria were patients on peritoneal dialysis;patients whom doctors found difficult to assess in termsof medical history, clinical course, and daily life beforeadmission; and patients with a CFS score of 9.In total, 359 patients were considered eligible for thisstudy. However, 49 patients who had undergone maintenance dialysis outside TOHO Hospital and threerelated facilities (Oura Hospital, Hikari Clinic, ShirotaClinic) after the initiation of dialysis were excluded,resulting in a study sample of 310 patients (Fig. 1).Frailty screening in the clinical setting: Rockwood’s CFSMore recently, in the Asia-Pacific region, the ClinicalFrailty Scale (CFS) has emerged as a well-validated 9point global assessment tool that predicts adverse outcomes in older adults. The CFS allows frailty to bedefined and graded using simple clinical descriptorsavailable from routine clinical assessment. However, thetool requires some clinical judgment, and trained assessors are required for accurate classification [5–8].
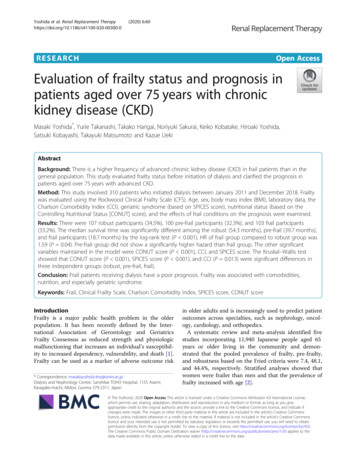
Yoshida et al. Renal Replacement Therapy(2020) 6:60Page 3 of 12Fig. 1 Study design1. Very fitPeople who are robust, active, energetic, andmotivated. These people commonly exerciseregularly. They are among the fittest for their age.2. WellPeople who have no active disease symptoms butare less fit than category. Often, they exercise or arevery active occasionally, e.g., seasonally.3. Managing wellPeople whose medical problems are well controlledbut are not regularly active beyond routine walking.4. VulnerableWhile not dependent on others for daily help, oftensymptoms limit activities. A common complaint isbeing “slowed up” and/or being tired during theday.5. Mildly frailThese people often have more evident slowing andneed help in high order instrumental activities ofdaily living (IADLs) (finances, transportation, heavyhousework, medications). Typically, mild frailtyprogressively impairs shopping and walking outsidealone, meal preparation, and housework.6. Moderately frailPeople need help with all outside activities and withkeeping house. Inside, they often have problemswith stairs and need help with bathing and mightneed minimal assistance (cuing, standby) withdressing.7. Severely frailCompletely dependent for personal care, fromwhatever cause (physical or cognitive). Even so,they seem stable and not at high risk of dying(within—6 months).8. Very severely frailCompletely dependent, approaching the end of life.Typically, they could not recover even from aminor illness.9. Terminally illApproaching the end of life. This category appliesto people with a life expectancy 6 months, whoare not otherwise evidently frail.In this study, terminally ill was excluded.According to Rockwood’s CFS, the patients weredivided into three groups: robust (CFS 1–3), pre-frail(CFS 4), and frail (CFS 5–8) [5].Charlson comorbidity indexThis is a health tool based on the CCI model thatassesses the comorbidity risk associated to a seriesof conditions in order to offer medical specialists aninformed decision-making process in terms of specific screenings or medical procedures. The indexaccounts for the patient age and 16 conditions. Thisinstrument is used to categorize comorbidities ofpatients and uses the International Classification ofDiseases (ICD) diagnosis codes [15].
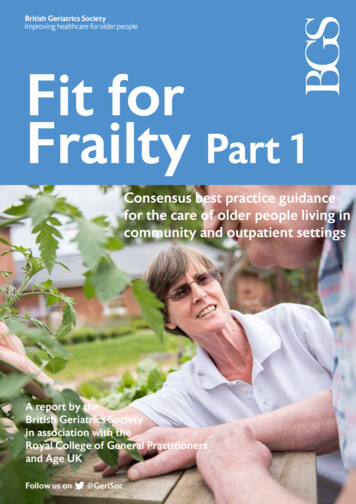
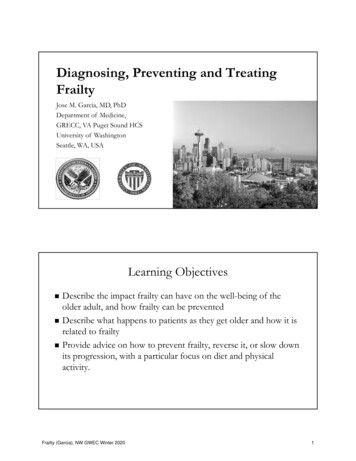
Yoshida et al. Renal Replacement Therapy(2020) 6:60SPICES scoreSPICES is an acronym for a brief protocol for multidimensional assessment to identify risk factors related tocaring for older adults: skin integrity, problem with eating, incontinence, confusion, evidence of falls, and sleepdisturbance.Skin integrity is documented presence of a pressureulcer on admission by a registered nurse and/or physician. Problem with eating are evaluated by FunctionalIndependence Measure (FIM) [16]. Incontinence (boweland/or bladder) is evaluated by FIM. Confusion is evaluated by screening at admission (Delirium ScreeningTool). Evidence of falls is defined as fracture history offalls within past year.Sleep disturbance is defined as insomnia, restless legsyndrome, periodic limb movements in sleep, and sleepapnea syndrome. All factors are scored as one, and thetotal score is evaluated [17].Controlling Nutritional Status scoreThe CONUT considers the Alb level, total cholesterollevel, and total lymphocyte count. Alb scores were 0 ( 3.5 g/dL), 2 (3.0–3.4 g/dL), 4 (2.5–2.9 g/dL), and 6 points( 2.5 g/dL). Total cholesterol score was 0 ( 180 mg/dL), 1 (140–179 mg/dL), 2 (100–139 mg/dL), and 3points ( 100 mg/dL). Total lymphocyte score was 0 ( 1600/μL), 1 (1200–1599/μL), 2 (800–1199/μL), and 3points ( 800/μL). Each score was totaled and evaluated.Patients with a total score of 2 were considered tohave malnutrition [18].Statistical analysisThe Kruskal–Wallis test and Pearson’s χ2 test were performed for comparing three independent groups (robust,pre-frail, frail). As a method of multiple comparisonsbetween groups, the Steel–Dwass test and the Mann–Whitney U test were performed for two-group comparisons, and Bonferroni adjustments were conducted whereappropriate.Survival times after dialysis initiation of patients underdifferent frailty conditions were evaluated by a longitudinal cohort study. The Kaplan–Meier method was usedto examine crude survival in the three groups defined bytheir frailty status (frail, pre-frail, and robust). Cox proportional hazards regression was applied firstly to estimate unadjusted hazard ratios (HRs) in the threegroups. Next, multidimensional Cox proportional hazards regression model was used to adjust for possibleconfounders. This was performed by entering all the variables potentially associated with survival into the model:Rockwood’s CFS, CCI, SPICES score, CONUT score,age, sex, BMI, CTR, laboratory data (Alb, serum sodium,serum potassium, serum creatinine, serum chloride, corrected serum calcium, serum phosphorus, blood ureaPage 4 of 12nitrogen, hemoglobin, BNP, total cholesterol, totallymphocyte count, and CRP). The Cox proportionalhazards regression modeling results were summarizedwith HRs for each variable, 95% confidence intervals,and associated p values.Statistical analysis was conducted using SPSS24 forWindows.EthicsThis study was performed with the approval of theInstitutional Review Board of our institution.ResultsThe median follow-up period after dialysis initiation was27.3 months (interquartile range [IQR] 8.0–46.2), andthe average was 29.2 months (standard deviation [SD] 24.2).Patient data are shown in Table 1. The median agewas 83.1 years (interquartile range [IQR] 80.6–86.7), and144 were women (45.4%). The median eGFR at the timeof evaluation was 8.5 ml/min/1.73 m2 (IQR 5.6–10.9).The median CCI was 4 (IQR 3–5), the medianCONUT score was 6 (IQR 4–8), and the medianSPICES score was 1 (IQR 0–2). The primary causesof CKD were diabetes mellitus (n 95, 30.5%),glomerulonephritis (n 48, 15.4%), nephrosclerosis(n 35, 11.3%), and autosomal-dominant polycystickidney disease (n 7, 2.3%).FrailtyThe status of frailty before initiation of dialysis wasclassified by Rockwood’s CFS. Patients were divided intothree groups: robust (n 107; CFS 1–3, 34.5%), prefrail (n 100; CFS 4, 32.3%), and frail (n 103; CFS 5–8, 33.2%) (Fig. 2).Prognosis after dialysis initiationAs of March 31, 2020, 27 patients (8.7%) were censoredbecause they were transferred to another hospital duringmaintenance dialysis, and 155 patients (50.0%) died.The causes of death and the number of patients areshown in Fig. 3. Infection was the leading cause of death(16.8%). In the frail group, mortality of infectious diseases tended to be high, and in the robust group, mortality of heart disease tended to be high.For the prognosis after initiation of dialysis, theKaplan–Meier curve was constructed. The median survival was 54.3 months (95% confidence interval [CI],36.6–71.9) in the robust group, 39.7 months (95% CI,21.7–57.8) in the pre-frail group, and 18.7 months (95%CI, 5.3–32.2) in the frail group, and a significant difference was found by log-rank analysis (P 0.001).Cumulative survival rates at 12, 36, and 60 monthsafter initiation of dialysis were 85.7, 72.5, and 45.8%
Yoshida et al. Renal Replacement Therapy(2020) 6:60Page 5 of 12Table 1 Characteristics of all study participants with frailty classification and frailty status. Values of categorical variables are given asnumber (percentage). Values for continuous variables are given as median (interquartile range)CharacteristicTotal (N 310)Robust (N 107)Pre-Frail (N 100)Frail (N 103)P-valueAge (year)83.1 (80.6-86.7)82.6 (80.6 ― 85.3)82.9 (80.4 ― 87.1)83.8 (81.2 ― 87.7)0.124Sex (Female)144 (45.4)38 (32.3)55 (55.1)51 (49.0)0.027*Body mass index (kg/m2)19.7 (17.5-22.0)19.6 (18.2 ― 22.0)19.6 (17.4 ― 21.9)18.5 (15.9 ― 21.6)0.028*Cardio-Thoracic Ratio (%)54.5 (50.0-60.8)55 (50 ― 61)54.4 (51 ― 60)55 (50 61)0.828Charlson Comorbidity index4 (3-5)4.0 (3.0 ― 5.0)4.0 (3.0 ― 5.0)4.0 (3.0 ― 6.0)0.013*Cardiovascular disease57 (18.4)18 (16.8)23 (23.0)16 (15.5)0.388Congestive heart failure80 (25.8)28 (26.2)26 (26.0)26 (25.2)0.924Peripheral vascular disease12 (3.9)5 (4.7)4 (4.0)3 (2.9)0.791Dementia89 (28.7)12 (11.2)26 (26.0)51 (49.5) 0.001**Chronic obstructive pulmonary disease15 (4.8)4 (3.7)4 (4.0)7 (6.8)0.519Collagen disease16 (5.2)7 (6.5)5 (5.0)4 (3.9)0.680Peptic ucler5 (1.6)1 (0.9)1 (1.0)3 (2.9)0.436Mild Liver dysfunction10 (3.2)4 (3.7)3 (3.0)3 (2.9)0.917Diabetes mellitus without end-organ damage22 (7.1)2 (1.9)11 (11.0)9 (8.7)0.599Hemiplegia46 (14.8)11 (10.3)13 (13.0)22 (21.4)0.149Diabetes mellitus with end-organ damage107 (34.5)40 (37.4)35 (35.0)32 (31.1)0.650Malignant Tumor (no metastasis)22 (7.1)6 (5.6)8 (8.0)8 (7.8)0.765Moderate/Sever Liver dysfunction6 (1.9)0 (0.0)4 (4.0)2 (1.9)0.122Metastatic malignant tumor4 (1.3)0 (0.0)1 (1.0)3 (2.9)0.178SPICES Score0 (0-3.0)0.0 (0.0 ― 1.0)1.0 (0.0 ― 1.5)2.0 (1.0 ― 3.0) 0.001**Sleep disorder67 (21.6)30 (28.0)18 (18.0)19 (18.4)0.13Problem with eating92 (29.7)9 (8.4)26 (26.0)57 (55.3) 0.001**Incontinence93 (30.0)8 (7.5)22 (22.0)63 (61.2) 0.001**Confusion89 (28.7)12 (11.2)26 (26.0)51 (49.5) 0.001**Evidence of Falls34 (11.0)6 (5.6)10 (10.0)18 (17.5)0.021*Skin breakdown18 (5.8)1 (0.9)2 (2.0)15 (14.6) 0.001**Diabetes mellitus101 (32.6)37 (34.6)33 (33.0)31 (30.1)0.452Glomeruonephritis49 (15.8)16 (15.0)16 (16.0)17 (16.5)0.591Nephrosclerosis38 (12.3)13 (12.1)13 (13.0)12 (11.7)0.206Etiology of chronic kidney diseaseOther16 (5.2)6 (5.6)6 (6.0)4 (3.9)0.353Unknown107 (34.5)35 (32.7)33 (33.0)39 (37.9)0.225Serum Albumin (g/dl)2.9 (2.2-3.4)3.1 (2.8―3.4)2.9 (2.4―3.3)2.6 (2.2―3.0) 0.001**Hemoglobin (g/dl)9.0 (7.8-10.1)8.8 (8.3―10.1)8.9 (8.0―9.9)8.8 (7.8―9.9)0.452Serum Sodium (mEq/l)137.6 (133-141)138 (136―141)138 (135―141)138 (133―141)0.591Serum Potassium (mEq/l)4.5 (3.9-5.4)4.3 (3.9―5.0)4.3 (3.8―4.9)4.6 (3.9―5.4)0.206Serum Chloride (mEq/l)105.8 (110-111)107 (103―111)106 (101―110)106 (101―110)0.24LabodataBlood Urea Nitrogen (mg/dl)81.4 (54.0-111)72.5 (57.4―88.6)73.2 (54.0―93.6)75.3 (60.8―111)0.156Serum Creatinine (mg/dl)5.3 (4.0 -6.6)5.6 (4.2―7.2)4.9 (4.0―6.2)5.2 (4.3―7.4)0.078Corrected Serum Calcium (mg/dl)9.3 (8.9-9.9)9.3 (8.8―9.5)9.3 (8.9―9.6)9.6 (9.2―9.9) 0.001**Serum Phosphorus (mg/dl)5.1 (3.8-6.2)4.7 (3.9―5.5)4.6 (3.8―5.5)5.2 (4.2―6.2)0.012*Brain Natriuretic Peptide (pg/ml)196 (72.2-570)162.5 (76―405)147 (63―458)162.5 (76―405)0.432
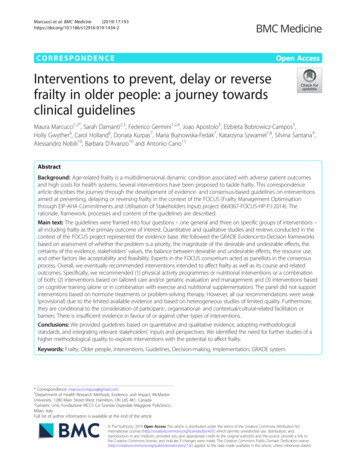
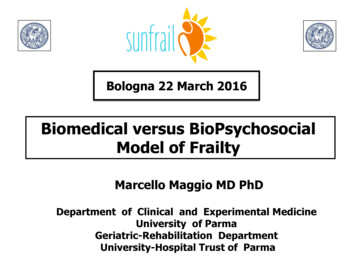
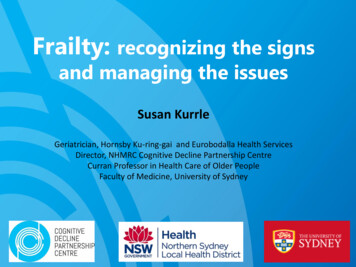
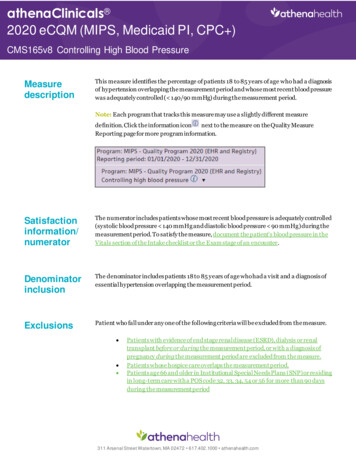
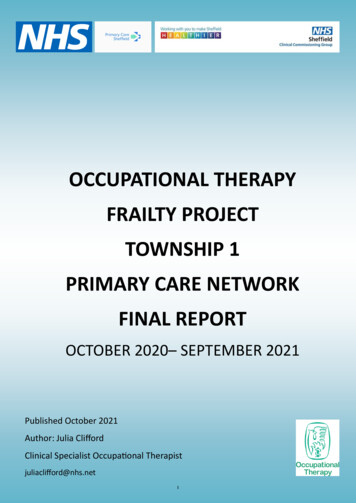
Yoshida et al. Renal Replacement Therapy(2020) 6:60Page 6 of 12Table 1 Characteristics of all study participants with frailty classification and frailty status. Values of categorical variables are given asnumber (percentage). Values for continuous variables are given as median (interquartile range) (Continued)CharacteristicTotal (N 310)Robust (N 107)Pre-Frail (N 100)Frail (N 103)P-valueTotal Cholesterol (mg/dl)161 (136-192)167 (141―197)159 (130―180)160 (131―193)0.161Total Lymphocyte Count (1000/μL)0.98 (0.70-1.35)0.99 (0.8―1.4)1.01 (0.8―1.4)0.93 (0.6―1.2)0.083C-reactive protein (mg/dl)0.7 (0.72-1.44)0.16 (0.06―0.76)0.78 (0.07―1.42)1.12 (0.42―1.95) 0.001**CONUT score6 (4.0-8.0)5 (4―7)6 (4―8)7 (6―9) 0.001*** P value 0.05** P value 0.001(robust group); 75.3, 53.2, and 31.0% (pre-frail group);and 52.7, 39.7, and 16.1% (frail group), respectively(Fig. 4).In the Cox proportional hazards model of patientsurvival, the unadjusted hazard rate of mortality forfrailty, using the robust group as a reference, was 1.64(95% CI, 1.07–2.53; P 0.025) and 3.13 (95% CI, 2.08–4.73; P 0.001) for pre-frail and frail group, respectively.When adjusted by the other significant variables for mortality, HR of frail compared to robust group was 1.59 (95%CI, 1.10–2.58; P 0.001). Pre-frail group did not show asignificantly higher hazard than robust group. The othersignificant variables maintained in the multivariable Coxproportional hazards model were CCI, SPICES score, andCONUT score. HR of CONUT score was 1.13 (95% CI,1.05–1.21; P 0.001), HR of CCI was 1.17 (95% CI, 1.08–1.27; P 0.001), and HR of SPICES score was 1.29 (95%CI, 1.14–1.47; P 0.002) (Fig. 5, Table 2).CONUT score, SPICES score, and CCI showed significant differences by the Kruskal–Wallis test. Furthermore, in the comparison of the groups (robust, pre-frail,frail), SPICES scores were distinct between all groups;CONUT score and CCI were distinct among somegroups (Fig.6a–c, Table 1).Fig. 2 Distribution of the Clinical Frailty Scale in CKD patients. Thedistribution of the Clinical Frailty Scale is presented as a histogramof the number of participants with a given score. The Clinical FrailtyScale ranges from 1 to 9, with a higher score representingworse frailtyThe correlation between CFS and CONUT score,SPICES score, and CCI was examined using Spearman’srank correlation coefficient. CFS was positively correlated with all indicators, with a significance probabilityof less than 5% (Table 3).DiscussionIt is important to evaluate frailty because it is thenumber one cause of nursing care needs in people agedover 75 years. Frailty is an independent predictor ofadverse outcomes in chronic kidney disease. The number of Japanese CKD patients is estimated to be about13.3 million, and about one in eight adults has CKD.CKD prevalence is particularly high in the elderly [19].In a systematic review of cohorts and observational studies assessing the association of frailty with CKD andprognosis, CKD was associated with frailty or reducedphysical function (OR 1.30–3.12). It has already beenshown that frailty is associated with the initiation ofdialysis or death in CKD patients (OR 2.00–5.88) [20].As a result of examining the relationship betweeneGFR and frailty, the frequency of frailty increased asthe eGFR decreased. The ORs for CKD stage 4 andCKD stage 5 are 2.02 and 4.83, respectively, comparedto CKD stage 1-2 [21]. In a report of CFS’s assessmentof frailty in dialysis patients, 26% were frail, and a 1point increase in CFS increased the risk of death by1.22 times (95% CI 1.04–1.43) [13].As shown in Table 1, the proportion of females washigher in the pre-frail/frail group than in the robustgroup. Although the pathophysiological pathwaysleading to frailty are not well defined, gender appearsto be an important factor affecting the aging trajectory. Compared with age-matched males, females tendto be frail but have a higher life expectancy [22].It is known that female hormone levels decreasewith menopause. In comparison to males, femalesare more likely to develop dementia and osteoporosis, thereby affecting ADL and QOL decline. Inaddition, females have a relatively long life expectancy and healthy life expectancy. However, the differences between both life expectancy and the lengthof care required also become longer, and ADL andQOL are likely to decline. The Kaplan-Meier curve
Yoshida et al. Renal Replacement Therapy(2020) 6:60Page 7 of 12Fig. 3 Leading cause of death among dialysis patients by frail statusin Fig. 4 shows a sharp decrease in survival until 12months after the introduction of dialysis. Especiallyin the frail group, the tendency is remarkable, andthe survival rates at 3, 6, and 12 months were 76,62.8, and 55.9%. In previous reports, only severe(bedridden) and moderately (overt difficulties inexerting basic activities of daily living) impairedfunctional status was significantly associated withearly mortality after initiation of dialysis (adjustedrisk ratio 3.93 and 2.38, respectively) [23]. Functionalstatus among older people with severe and moderatedisabilities is consistent with the frail group classified by the CFS. Physical function in older peoplemay be further reduced after the introduction of dialysis. In a study of nursing home residents, theFig. 4 Kaplan-Meier survival curves by frailty statusproportion of deaths or reduced functional statusamong the residents was 61% compared with predialysis within 3 months after initiation of dialysis,and 39% had the same functional status as beforedialysis. By 12 months, the proportion of deaths orreduced functional status among the residents was87% [24].ComorbidityAmong the groups, the frail patients had a significantlyhigher CCI. Of the diseases that make up CCI, only dementia showed a significant difference, with 51 (49.5%)in the frail group. Cross-sectional studies show thatabout 20–55% of frail patients have cognitive impairment [25]. In a longitudinal study, the risk of having
Yoshida et al. Renal Replacement Therapy(2020) 6:60Page 8 of 12Fig. 5 Multivariable Cox proportional hazards models of the association of frailty and mortality adjusted by CONUT score, Charlson ComorbidityIndex, and SPICES scoredementia in a patient with a frail status was 1.33 for alldementias (hazard ratio of 2.70 for vascular dementiaand 1.28 for Alzheimer’s-type dementia, respectively)[26]. Combined frailty and cognitive dysfunction tend toreduce the activities of daily living and physical functionand increase mortality [27, 28].Although no significant difference was observed inother comorbidities, the risk of frailty is considered toincrease because of the accumulation of various comorbidities. In a previous study, the frequency of frailpatients with acute coronary syndrome was 5.1–30%,which was associated with increased death and readmission [29]. The frequency of heart failure among frailpatients is 19–40%, which is higher than that of the general population and is associated with increased deathand readmission [30]. In Japan, diabetic nephropathy isthe largest primary cause of dialysis (42.5%) [14]. Therefore, in CKD stages 4–5, the incidence of diabetes ishigh. Diabetes increases the risk of becoming frail, andfrailty increases the incidence of diabetes [31, 32]. Frailpatients with diabetes have a poor prognosis [33]. Theprevalence of frailty in elderly patients with chronicobstructive pulmonary disease (COPD) is reported to be10.2%, and frailty is associated with physical dysfunction,and it is also a prognostic predictor. Frailty has thegreatest effect on the prognosis of COPD patients[34, 35]. Early management of chronic comorbidityleads to the prevention of frailty and prevents deterioration of frailty progression because frailty andchronic comorbidity interact.Geriatric syndromeThe simple-to-use screening strategy alerts the bedside nurse to be vigilant in the surveillance ofpatients and to initiate care team activities. SPICESis recommended by the Nurses Improving Care forHealth System Elders (NICHE) as a valuable screening tool for identifying frailty risk amonghospitalized older patients, and it is commonly usedfor this purpose.The SPICES score was significantly higher in the frailgroup. Significant differences were observed in the following constituent factors: skin integrity, problem witheating, incontinence, confusion, and evidence of falls.Some factors can cause outcomes, as well as frailty,which can affect interactivity and accelerate the negativecascade. Major outcomes of frailty include falls/fractures,need for nursing care (decreased ability to perform routine activities of daily living, assistance with excretion),and death [36].Exercise interventions for the frail are recommendedto improve gait, muscle strength, physical motor function, and daily activities, and to prevent the progressionof frailty. Exercise intervention for disability in dailyactivities should be implemented early in frail patients[37]. However, this study has some limitations. TheSPICES score is considered competent, but the scaleused to assess activities of daily living, sleep disorder,and confusion varies among reports. In the future, it willbe necessary to establish unified evaluation criteria byrepeating cases.MalnutritionMalnutrition and frailty are frequent among the olderpopulation [38]. An index of malnutrition includes Alb,BMI, total cholesterol, total lymphocyte count, andweight loss, among others [18, 39–41]. Compared withthe other groups, Alb, BMI, and total lymphocyte countwere significantly lower in the frail group.The CONUT score is a screening tool to identify malnutrition by consideration of the protein reserves (Albvalue), caloric depletion (total cholesterol), and immunedefense (lymphocyte count) [18]. There have been manyreports about the association between each componentof CONUT score and outcomes. The drop in thelymphocyte count, which is caused by physical stress,malnutri
this was performed by entering all the var- iables potentially associated with survival into the model: rockwood's cfs, cci, spices score, conut score, age, sex, bmi, ctr, laboratory data (alb, serum sodium, serum potassium, serum creatinine, serum chloride, cor- rected serum calcium, serum phosphorus, blood urea nitrogen, hemoglobin, bnp, total