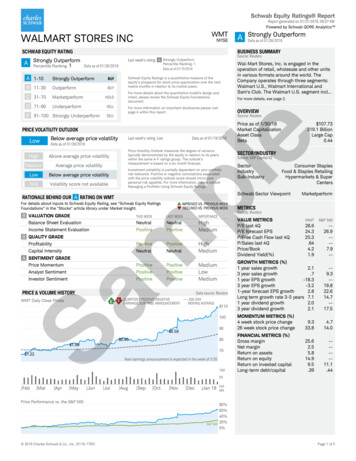
Transcription
Schwab EquityRatings explained 2022 Charles Schwab & Co., Inc. (“Schwab”). All rights reserved.Member SIPC. (0722-2ZKV)
Important information This workshop is a service offered to existing and prospective Schwab brokerage customers. It will discuss technical analysis conceptsand strategies and does not include the recommendation or endorsement of any particular security, chart pattern or investment strategyby Schwab. The concepts and strategies discussed may not be suitable for all investors. It is important that investors consider the informationpresented in light of their individual circumstances and objectives, including personal risk tolerances and investment goals. Pastperformance should not be construed as indicative of future results. Schwab does not recommend the use of technical analysis as a sole method of investment research. Schwab Equity Ratings and the general buy/hold/sell guidance are not personal recommendations for any particular investor or clientand do not take into account the financial, investment or other objectives or needs of, and may not be suitable for, any particularinvestor or client. Investors and clients should consider Schwab Equity Ratings as only a single factor in making their investmentdecision while taking into account the current market environment. If you are not completely satisfied for any reason, at your request Charles Schwab & Co., Inc. (“Schwab”) or Charles Schwab Bank(“Schwab Bank”), as applicable, will refund any eligible fee related to your concern within the required timeframes. Schwab reserves theright to change or terminate the guarantee at any time. Go to schwab.com/satisfaction to learn what’s included and how it works. 2022 Charles Schwab & Co., Inc. (“Schwab”). All rights reserved. Member SIPC.
Todaywe’ll discussSchwab EquityRatings (SER)ImplementingSERSchwab PriceVolatility OutlookSER toolsand resources
Schwab Equity Ratings (SER)
Foundations of SER010203PhilosophyConstructionPerformanceWhere do thecriteria come from?How are ratingsdecided?How has SERperformed over time?
01 PhilosophySome elements might include:What are someof the attributesyou look for ina stock? High historic earnings per share (EPS)growth rates Above-average future EPS growth forecasts “Strong buy” or “buy” recommendation fromWall Street analysts High profit margins Dividends Perhaps even stocks that have lagged themarket over the last year but have recentlybegun outperforming
01 Philosophy (Cont’d)Analyst EPS growth forecastsAnalyst stock recommendationsTraditional Wall Streetanalyst favoritesoften underperformStock return performance ofanalyst forecasts andrecommendations, 1995-2021Average annual .7%13.8%12.7%12.4%12%10.6%10%8%1234Quintile portfoliosPast performance is no guarantee of future results. The portfolios are hypothetical, calculated with the benefit of hindsight, and provided for illustrative purposes only. It is not intended to represent aspecific investment product. Dividends and interest are assumed to have been reinvested, and the example does not reflect the effects of taxes or fees which would cause performance to be lower.For more information see slide 29.5
01 Philosophy – Multi-dimensional ApproachManagement signalsWe take a multi-dimensionalapproachAnomalies exist in the market due to mispricingof useful information.We believe investors can benefit from periodsof unsustainable mispricing, often found at theintersection of: Investor sentiment Management signals Analyst opinions Company fundamental undamental performanceInvestorsentiment
01 Philosophy – Schwab’s Research ProcessSchwab’s research processWe test the historicaleffectiveness of stockselection strategies: How would the strategy haveperformed (i.e., return, risk,turnover)? How would the strategy haveworked on stocks in differentgroups (i.e., style, sector,industry)? How consistent would the strategyhave been over time?We store methodologies thathave worked (and not worked)in the past: Schwab’s “Factor Library” containsnumerous stock selection criteriathat have historically beencorrelated to returns. We consider what characteristicsbetter-performing stocks haveshared before they began toperform well.
01 Philosophy – Research Cont’dWe use the research to create an investment decision-making tool.We combine various stockselection criteria into a“multifactor model”: We use a scoring system based ona “weight-of-the-evidence”approach to stock selection. We consider stocks that score wellon several attractive investmentattributes to be preferable to thosethat score well on just a few. We employ research output as arating for each stock.In a nutshell:Our multifactor model isconsistent and objective,offering comprehensivebuy and sell guidance toactive traders.
02 ConstructionOur multifactor model: five investment timentperspectiveStabilityperspectivePercent ofSER universe12-monthreturn outlookGeneral adviceguidanceATop 10%StrongoutperformBuyBNext 20%OutperformBuyCMiddle 40%MarketperformHoldDNext 20%UnderperformSellFBottom tor results calculated for each stockHow is the stock classified? Within the model there are seven options:Large Cap Growth, Large Cap Value, Small Cap Growth, Small Cap Value,Banks, Diversified Financials, or Biotechnology & PharmaceuticalsFinal score assigned – determined by a stock’s classification within theseven groups listed aboveSchwab equity rating(A, B, C, D, F)SER
03 PerformanceSchwab Equity RatingsBroker Consensus mance comparison:Schwab Equity Ratings vs.Broker Consensus Ratings(May 2002 – December 2021)15%Sch16.05%Schwab vs. othertraditional brokeragefirm analysts20%5%0%Top 10%Next 20%Middle 40%Next 20%Lowest 10%Source: Schwab Center for Financial Research: Average percent return of all 52-week periods from May, 2002 through December, 2021. Past performance is no guarantee of future results.Limitations of Schwab Equity Ratings Model PerformanceQuantitative model performance results have certain inherent limitations. Unlike an actual performance record, these results are hypothetical and do not represent actual investment performance or trading. Also, since the trades have not actually beenexecuted, the results may have under- or over-compensated for the impact, if any, of certain market factors, such as the effect of limited trading liquidity. No representation is being made that any investor will or is likely to achieve profits or losses similar tothose shown.For more information see slide 30.
03 Long-term performance12 month performancesince inception(5/6/2002 – 6/30/2022)Average Schwab equity ratings returnsAverage percent return of all 52-week periods since May 6, 2002Average performance ofall Schwab-rated %5%0%ABCDFRatingsSource: Schwab Center for Financial Research: Average percent return of all 52-week periods from May 6, 2002 through June 30, 2022. Past performance is no guarantee of future results.Limitations of Schwab Equity Ratings Model PerformanceQuantitative model performance results have certain inherent limitations. Unlike an actual performance record, these results are hypothetical and do not represent actual investment performance or trading. Also, since the tradeshave not actually been executed, the results may have under- or over-compensated for the impact, if any, of certain market factors, such as the effect of limited trading liquidity. No representation is being made that any investorwill or is likely to achieve profits or losses similar to those shown.
03 Mid- and short-term performanceAverage 13-week performanceAverage 4-week performancePerformance sinceinception(5/6/2002 – %1.85%1.12%1%1.02%0.87%CD0.52%0.98%0%-1%ABFAverage SchwabRated StockRatingsSource: Schwab Center for Financial Research: Average percent return of all 13- and 4-week periods from May 6, 2002- Dec 31, 2021.Past performance is no guarantee of future results.Limitations of Schwab Equity Ratings Model PerformanceQuantitative model performance results have certain inherent limitations. Unlike an actual performance record, these results are hypothetical and do not represent actual investment performance or trading. Also, sincethe trades have not actually been executed, the results may have under- or over-compensated for the impact, if any, of certain market factors, such as the effect of limited trading liquidity. No representation is beingmade that any investor will or is likely to achieve profits or losses similar to those shown.
Introducing SchwabPrice Volatility Outlook
Schwab Price Volatility OutlookAdditional insight into the potential volatility of your investment This is a supplemental piece of information which measures the degree of variance typicallydemonstrated by a stock in relation to its peers within the same A-F SER ratings group. The outlook’s measurement is based on a six-month forecast. It assigns a High, Medium, or Low assessment based on available data. The Price Volatility Outlook is currently available within the Schwab Stock Screener and is foundwithin an individual stock’s SER pdf report:
Price Volatility Outlook – Key AttributesSupplemental information – The Price Volatility Outlook is not part of Schwab Equity Ratings (SER) model The Price Volatility Outlook consists of three components:– Historical return volatility– Analyst dispersion– Betting against beta The distribution of the Price Volatility Outlook is as follows: More information can be found within the Schwab Equity Ratings Foundations documentavailable on Schwab.com.
Implementing SER
Leverage our extensive research to screen forstocks you believe are worthy of furtherconsideration.Employ SER tohelp complement anexisting strategy Consult SER as an objective second opinion toyour own ideas. Ask yourself: are theconditions right? Use SER as a “sell discipline.” The model hashistorically excelled at identifying theunderperformers in the market.
How can you use Schwab Equity Ratings?Use SER as the primary basis for an equity portfolio strategyBuild a diversifiedportfolio of stocksthat are preferablyA-rated by SERMonitor yourportfolio holdingsfor changesin their ratingsConsider sellingstocks rated D or FStick withyour strategythrough time
SER tools and resources
More SER tools and resourcesReferences Schwab Equity RatingsFoundations documentManaging a Portfoliousing Schwab EquityRatings documentTools Stock Screener Schwab Stock Lists Schwab Equity RatingsReport Schwab Equity RatingsPerformance page Schwab Equity RatingsRationale for our Rating page Email alerts
Additional resourcesPublications: Selecting dividend-paying stocks – can youdo better? Looking for equity income? Try shareholder yield Going global? Selecting ADRs or foreign stocks Cross-listed international stocks: anotherinvesting alternative Earning surprises – is there a better wayto capitalize on them?Where canI find more?Ask your Schwab RepresentativeSchwab Market Perspective:Bi-weekly, broad overviewof domestic and internationalmarkets:schwab.com/marketinsight
A few finalthoughtsSchwab’s research approach hasmany potential advantages Models can be tested Models are systematic and easy to use Let us do some of your homework!Schwab has created equity research tools to helpyou make more informed investment decisions
Let’s reviewwhat we’velearned Schwab Equity Ratings (SER) represents amultifactor approach to selecting stocks that have thepotential to outperform the general equities model. There are a variety of ways to leverage SER toresearch, screen, and select stocks. Schwab provides SER tools, resources, andpublications for all types of investors.
Important information1The information provided here is for general informational purposes only and should not be considered an individualized recom mendation or personalized investment advice. Theinvestment strategies mentioned here may not be suitable for everyone. Each investor needs to review an investment strategy for his or her own particular situation before making anyinvestment decision.All expressions of opinion are subject to change without notice in reaction to shifting market, economic or geopolitical cond itions. Data contained herein from third party providers isobtained from what are considered reliable sources. However, its accuracy, completeness or reliability cannot be guaranteed.Past performance is no guarantee of future results and the opinions presented cannot be viewed as an indicator of future perf ormance.Investing in U.S. securities is not without risk. Investment returns will fluctuate and are subject to market volatility, so that an investor's shares, when redeemed or sold, may be worthmore or less than their original cost. The potential for profit or loss from transactions in the U.S. market will be affected by fluctuations in exchange rates.Investing involves risk including loss of principal.
Important information2How Schwab Equity Ratings Performance Is CalculatedSchwab calculates performance using the holding period rate of return (for short, the holding period return methodology). The holding period return is the return earned from investing in anasset over a specified time period. Holding period returns are a combination of two separate sources of investment returns, i nvestment income (i.e. dividends) and price appreciation (i.e. capitalgains).First, Schwab creates five Cohorts, defined as all stocks with the same Schwab Equity Rating – A, B, C, D, or F – as of a Start Date, defined as the first day of a Performance Reporting Period(defined below). Schwab then calculates the total return for each stock in each Cohort in three steps: first, add the closing price as of the End Date, defined as the last day of a reporting period,to any dividends received during the Performance Reporting Period. Second, divide that sum by the closing price on the Start Date. Third, subtract one from the result. For example, the totalreturn of a stock with a Start Date price of 20 and an End Date price of 22.20, which paid 1 in dividends during the Perfo rmance Reporting Period, would be 16% ( ( [ 22.20 1.00] / 20) 1) Start Dates and End Dates are the first trading day of the week, generally Mondays. Performance Reporting Periods are gene rally 52 weeks long (for example, from Dec. 3, 2012 through Dec.2, 2013).As of January 29th 2018 and henceforward, the performance calculations represented across the five cohorts are calculated usi ng the “total returns” formula where dividends are reinvested inthe underlying stock for the remainder of the twelve month holding period. Stock value appreciation or depreciation is there fore compounded by dividend reinvestments.All stocks within a Schwab Equity Ratings cohort are equal-weighted at the beginning of the performance calculation period, meaning that each stock has the same value relative to any otherstock. Performance is calculated assuming stocks are held for the entire holding period, unless the stock has stopped trading due to acquisition, financial distress, delisting by an exchange, orother similar circumstance. If the stock has stopped trading, it is assumed that the stock position was liquidated on the close of its last trading day, without transaction costs. Proceeds, if any,are held as non-interest bearing cash. In instances in which a stock continues to trade but its stock symbol changes during a pe rformance calculation period, the symbol reflected will be thestock's symbol as of the start of the applicable performance calculation period.After individual stock returns are calculated, Schwab averages the total returns for all of the stocks within a cohort during that time period to find the average return.Transaction costs such as brokerage commissions, fees or other expenses are not deducted from the total return calculations. Performance would have been lower if such costs were deducted.The amount of the actual commissions and other fees you may pay will vary depending on, among other things, the number of sha res you buy and the way you execute the trade (such as viaschwab.com or through a Schwab representative ). A list of commission charges and other fees is available on request on by ca lling (877) 284-9817.Since ratings are generally updated weekly which may result in some rating changes and subsequent cohort turnover, new perfor mance numbers are also calculated on a weekly basis but maybe presented less frequently. Fifty-two week time periods were selected for tracking performance because Schwab Equity Ratings are meant to identify those stocks that will most likelyoutperform or underperform the broader market over the next 12 months. Shorter time periods have also been included to demonstrate more recent performance. Over time, the model uponwhich ratings are based may be altered.
Important information3Comparison of Performance to BenchmarksFor comparison purposes, Schwab compares the performance of ratings cohorts (stocks rated A, B, C, D, or F as of a certain start date) to the Average Performance of Stocks Rated A-F.The Average Performance of Stocks Rated A-F is the arithmetic mean return of all stocks with Schwab Equity Ratings for each performance period. This benchmark provides acomparison of the relative performance of each cohort against all stocks with Schwab Equity Ratings at the beginning of that time period.Some key points regarding the Average Performance of Stocks Rated A-F:–Approximately 3000 rated stocks are included in the Average Performance of Stocks Rated A-F–The Average Performance of Stocks Rated A-F is compiled by giving all stocks equal weight at the beginning of the period–The Average Performance of Stocks Rated A-F treats dividends as non-interest bearing cash for the remainder of the holding period. In other words, dividends are not reinvestedLimitations of Model Performance: Model performance results have certain inherent limitations. Unlike an actual performance record, simulated results do not represent actualinvestment performance or trading. Also, since the trades have not actually been executed, the results may have under- or over-compensated for the impact, if any, of certain marketfactors, such as the effect of limited trading liquidity. No representation is being made that any investor will or is likely to achieve profits or losses similar to those shown.The results presented should not and cannot be viewed as an indicator of future performance, as an indicator of the returns a Schwab client would have realized or will realize in relyingon Schwab Equity Ratings, or how individual Schwab Equity Ratings are performing or will perform in the future. This material is for informational purposes only and is not an offer to sellor the solicitation of an offer to buy. Additionally, Schwab Equity Ratings, Percentile Rankings, and the general guidance are not personal recommendations for any particular investor orclient and do not take into account the financial, investment or other objectives or needs of, and may not be suitable for an y particular investor or client. Before buying, investors andclients should consider whether the investment is suitable. Investors and clients should consider Schwab Equity Ratings as on ly a single factor in making their investment decision whiletaking into account the current market environment. Accordingly, Charles Schwab & Co., Inc. ("Schwab") does not assess the su itability (or the potential value) of any particularinvestment. Schwab also does not provide tax advice and the views in the material do not take into account any client's or in vestor's tax situation. Clients and investors should consulttheir tax advisers before investing. Schwab Equity Ratings utilize third-party data in establishing a rating. While Schwab believes such third-party information is reliable, we do notguarantee its accuracy, timeliness or completeness. Schwab Equity Ratings are generally updated weekly, so you should review and consider any recent market or company news beforetaking any action. Stocks may go down as well as up and investors (including clients) may lose money, including their origina l investment. Past history is no indication of futureperformance and returns are not guaranteed. For individualized advice, please contact Schwab at (877) 284 -9817.
Important information4The Institutional Brokers’ Estimate System (IBES) database from Thomson Reuters collects analysts’ long term EPS growth rate forecasts from hundreds of brokerage firms and averagesthe forecasts for each stock into a “consensus” long-term EPS growth forecast. IBES also collects analyst stock ratings (e.g., buy/hold/sell recommendations) from these same brokeragefirms, transforms the ratings into a numerical scale, and averages the ratings for each stock into a “consensus” rating.For these tests, the Schwab Equity Ratings Department used the Russell 3000 Index of stocks at the beginning of each year (i .e., 12/31/2005). Then, within these approximately 3000stocks, stocks were ranked into uniform quintile portfolios (i.e., the top 20% of stocks were ranked into portfolio #1, the n ext 20% into portfolio 2, and so on) based on consensus EPSgrowth forecasts and consensus broker ratings.Stocks in each portfolio were held constant and average total returns (including dividends) over the subsequent one -year period (i.e., through 12/31/2006) were compiled for eachportfolio. No transaction costs were subtracted from returns. Returns shown in Figure 1 are the average of each portfolio’s annual returns over period 12/31/1995-12/31/2021.Past performance is no guarantee of future performance.
Important information5Source: IBES, Schwab Center for Financial Research, May 2002 - December 2020. IBES collects analyst stock ratings (e.g., buy/hold/sell recommendations) from hundreds of brokeragefirms, transforms them to a numerical 1 to 5 scale, and averages the ratings for each stock into a "consensus" rating. For these tests, Schwab used the Russell 3000 Index constituents atthe end of each month. Then, these stocks were divided into five cohort (hypothetical) portfolios (i.e., the top 10% of stock s were ranked into portfolio #1, the next 20% into portfolio 2,the next 40% into portfolio 3, the next 20% into portfolio 4, and the last 10% into portfolio 5) based on Schwab Equity Ratings and IBES consensus ratings. Stocks in each portfolio wereheld constant and average total returns (including reinvestment of dividends) over the subsequent one-year period were compiled for each portfolio. No transaction costs were subtractedfrom returns. Returns shown are the average of each portfolio's annual returns from May 31, 2002 to December 31, 2021. 2022 Charles Schwab & Co., Inc. (“Schwab”). All rights reserved. Member SIPC.
Schwab Equity Ratings vs. Broker Consensus Ratings (May 2002 -December 2021) Schwab Equity Ratings Broker Consensus Ratings Sch % % % % % % % % % % 07% % % 81% 69% 0% 5% 10% 15% 20% Top 10% Next 20% Middle 40% Next 20% Lowest 10% Source: Schwab Center for Financial Research: Average percent return of all 52-week periods from May, 2002 through .