Transcription
APRIL 4, 2019AGENDA ITEM 3ACTION ITEMSCHOLARSHARE INVESTMENT BOARDResolution to Approve Amendment to Agreement No. SIB 15-10 with TIAA-CREFTuition Financing, Inc. for Program Management Services for ScholarShare 529RecommendationScholarShare Investment Board (SIB or Board) staff recommends the Board adopt Resolution No.2019-02 approving an amendment to Agreement No. SIB 15-10 with TIAA-CREF TuitionFinancing, Inc. (TFI) for program management services for ScholarShare 529 (Plan).BackgroundIn 2011, following a competitive request for proposals process, TFI was selected to provideprogram management services for the Plan. Agreement No. SIB 15-10 (Contract) with TFIprovides for an initial five-year term, with options for five (5) one-year extensions. In March 2018,the Board approved an amendment to the Contract to extend the term for one year. The Contractis set to expire in November 2019.DiscussionSIB staff reviewed both quantitative and qualitative factors in determining the recommendation togrant a one-year extension to the Contract with TFI. As part of the review process, SIB staff soughtinput from SIB’s 529 industry consultant, AKF Consulting Group (AKF), and SIB’s investmentconsultant, Pension Consulting Alliance, LLC (now Meketa Investment Group).Following a review of the analyses provided by AKF and PCA (Exhibit A and Exhibit B,respectively), SIB staff has found that since TFI assumed the position of program manager inNovember 2011, ScholarShare 529 remains competitively positioned amongst the 529 industryrelative to asset and account growth, investment structure, and fees. ScholarShare’s growthperformance and overall positioning is in-line within the industry. Investment portfolios andunderlying mutual funds have performed well relative to benchmark, industry, and peer groupplans. Additionally, TFI has consistently met three of the four Board-approved marketingperformance account and asset benchmarks for the Plan. However, TFI continues to lag the 529industry annual asset growth rate benchmark. While overall performance and comparison factorsfor ScholarShare 529 are generally positive and places the Plan competitively within the 529industry, there are opportunities for growth and improvement. As a result, SIB staff has determinedthat a one-year extension to the Contract is warranted.PresenterJulio Martinez, Executive Director, ScholarShare Investment BoardAndrea Feirstein, Managing Director, AKF Consulting GroupSoohyang Lee, Vice President, AKF Consulting GroupEric White, Executive Vice President, Meketa Investment Group
RESOLUTION NO. 2019-02RESOLUTION OF THE SCHOLARSHARE INVESTMENT BOARDRELATING TO THE APPROVAL OF AN AMENDMENT TOAGREEMENT NO. SIB 15-10 WITH TIAA-CREF TUITION FINANCING, INC.FOR PROGRAM MANAGEMENT SERVICES FOR THESCHOLARSHARE 529 COLLEGE SAVINGS PLANWHEREAS, the ScholarShare Investment Board ( “SIB” or the “Board”) was created underEducation Code section 69980 et seq. (the “Golden State ScholarShare Trust Act” or “Act”);WHEREAS, the Board, pursuant to Education Code Section 69982(b), has authority tocontract for goods and services and engage personnel as necessary for the purpose of renderingprofessional, managerial, and technical assistance and advice to the Board;WHEREAS, the Board, pursuant to Education Code Section 69981(c)(10), may authorizethe Executive Director to enter into contracts on behalf of the Board or conduct any businessnecessary for the efficient operations of the Board;WHEREAS, a program manager is needed to provide management services for California’sScholarShare 529 College Savings Plan (the “Plan”), which includes maintaining and managinginvestments, performing administration and customer service, and providing marketing;WHEREAS, the term of the Board’s existing contract, Agreement No. SIB 15-10 (the“Agreement”), with TIAA-CREF Tuition Financing, Inc. (“TFI”) for program management servicesfor the Plan expires on November 6, 2019;WHEREAS, the Agreement provides for five optional one-year extensions to the term of theAgreement; andWHEREAS, following a review of the analyses prepared and provided by the Board’sinvestment consultant and 529 industry consultant, SIB staff has determined that a one-yearextension term to the Agreement is warranted.NOW, THEREFORE, BE IT RESOLVED, that the Executive Director is hereby authorizedto execute necessary documents and take whatever steps necessary to obtain all requiredapprovals for an amendment to the Agreement with TFI to extend the term of the Agreement forone additional year, expiring on November 6, 2020.Attest:ChairpersonDate of Adoption:
MEMORANDUM TO THE BOARDTO:FROM:DATE:RE:I.SCHOLARSHARE INVESTMENT BOARDAKF CONSULTING GROUPMARCH 25, 2019SCHOLARSHARE 529 PLAN REVIEWINTRODUCTIONIn November 2011, the ScholarShare Investment Board (the “Board”) selected TIAA-CREF TuitionFinancing, Inc. (“TFI”) as the Plan Manager for the ScholarShare 529 College Savings Plan(“ScholarShare 529” or “California”). The Board and TFI entered into a five-year ManagementAgreement, which includes five optional one-year extensions. The Board has previously approvedthree extensions, resulting in a term ending November 6, 2019. As the Board now contemplates afourth one-year extension, Staff has asked AKF Consulting Group to provide an overall Plan review.To that end, this memo includes current information about ScholarShare 529, the national savingsmarket and certain Peer Plans (defined below), including relative asset and account growth rates andcomparisons of investment structures and fees. We believe the summarized information supportsanother extension of the Management Agreement.II.RELATIVE GROWTH RATESTo assess relative growth rates, we have compared ScholarShare 529 to:(i) the national savings market (“National Total Savings,” including Direct and Advisor Plans)(ii) the national direct market (“National Direct”), and(iii) select Direct Plans (“Peer Plans”)The Appendix to this memo includes the twenty largest Direct Plans by assets and accounts. In ourview, Peer Plans include the following (California is included for comparison purposes):PlanProgramManagerAssets1MorningstarPlan RatingReasons for InclusionCaliforniaTFI 8,251,321,353Silver–IllinoisUnion Bank 5,508,720,693GoldKansas2AmericanCentury 5,844,549,617Neutral3MichiganTFI 5,172,905,035SilverProgram Manager, Size, Morningstar Rating,Investment StructureHigh California account concentration,Investment StructureProgram Manager, Size, Morningstar RatingCollege Savings Plans Network (“CSPN”) as of December 31, 2018Kansas represents three Direct-sold Plans: Schwab 529 College Savings Plan (“Schwab 529”), Learning Quest Education Savings Plan Direct(“Learning Quest Direct”), and Schwab Learning Quest 529 Plan (“Schwab Learning Quest”). While we have included all three Direct-soldPlans for growth comparisons, we note that the Schwab 529 is the Plan with high California account concentration3Schwab 529 and Learning Quest Direct are both rated Neutral by Morningstar12
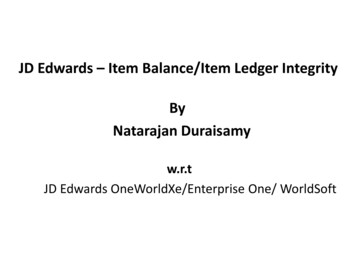
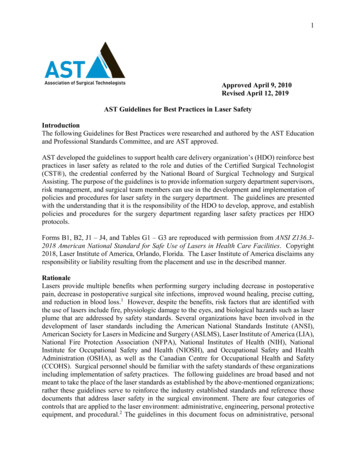
ScholarShare Investment Board, March 25, 2019PlanProgramManagerAssets1MorningstarPlan RatingReasons for InclusionNew YorkAscensus 23,182,523,641BronzeProgram Manager, State Distribution, SizeNewHampshireFidelity 12,070,606,575BronzeProgram Manager, Investment StructureWisconsinTFI 3,004,236,741BronzeProgram ManagerTo analyze relative growth rates, we have reviewed calendar years 2012 through 2018, the timeperiod during which TFI has managed ScholarShare 529. We base our analysis on December 31 datafrom the College Savings Plans Network (“CSPN”), with clarifications by certain States.National Savings Asset Growth. The following chart shows the asset growth of California versuseach of National Total Savings and National Direct:CALIFORNIA VS NATIONAL ASSET GROWTH 2012 – 201825%21% onal Total Savings2014-152015-16National Direct2016-17California2017-18This chart shows that between 2012 and 2018, California asset growth rates lagged National growthrates in early years but closed the gap more recently: Prior to TFI’s management, California asset growth lagged National Total Savings andNational Direct growth rates in 2012 by approximately 6% and 7%, respectively The gap narrowed in 2014, with California asset growth rates lagging National Direct by1% but surpassing National Total Savings by 1% In each year between 2014 and 2018, California asset growth rates consistently exceededNational Total Savings growth rates while falling just short of National Direct growth ratesOver the long term, California asset growth has closely followed National asset growth rates: Over the seven-year period, California assets grew on par with the growth of National TotalSavings (10.0% versus 10.3%, respectively) but lagged the growth of National Direct (10.0%versus 12.4%, respectively) Removing the impact of the 2012 transition year, over the six-year period:o The gap between California and National Direct growth rates narrows(9.8% and 11.4%, respectively, as opposed to 10.0% and 12.4%)-2-
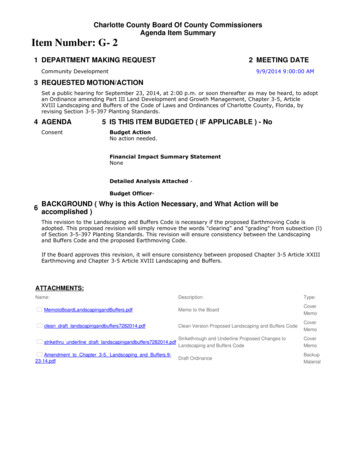
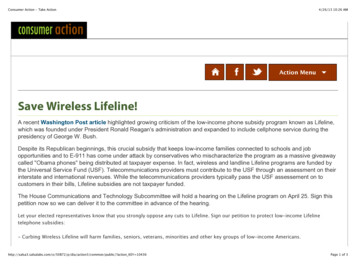
ScholarShare Investment Board, March 25, 2019o California’s growth rate exceeds the National Total Savings growth rate(9.8% versus 9.4%, respectively)National Account Growth. The following chart shows the account growth of California versus eachof National Total Savings and National Direct:CALIFORNIA VS NATIONAL ACCOUNT GROWTH 2012 – 6%5%6%4%0%-5%-3%2011-122012-13National Total Savings2013-142014-152015-16National Direct2016-172017-18CaliforniaThis chart shows that between 2012 and 2018, California account growth rates lagged Nationalgrowth rates overall in early years but began to exceed National Total Savings growth rates in lateryears: Reflecting the conversion from Fidelity to TFI (shown in 2011-12), California accountgrowth lagged National Total Savings and National Direct in 2012 by 8% and 10%,respectively California account growth improved strongly in 2013, with continued improvement since California account growth has surpassed the growth of National Total Savings since 2016Over the long term, California account growth has lagged National account growth rates: Over the seven-year period, California accounts increased on average 3.6% annually, laggingthe account growth of National Total Savings (4.4%) and National Direct (7.0%) Removing the transition impact of 2012, over the six-year period, California accountsincreased on average 4.6% annually, exceeding the growth of National Total Savings (4.4%)but still lagging the growth of National Direct (6.9%)-3-
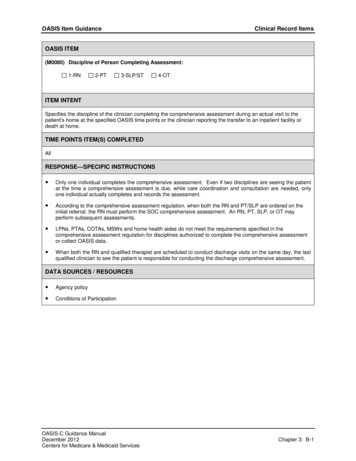
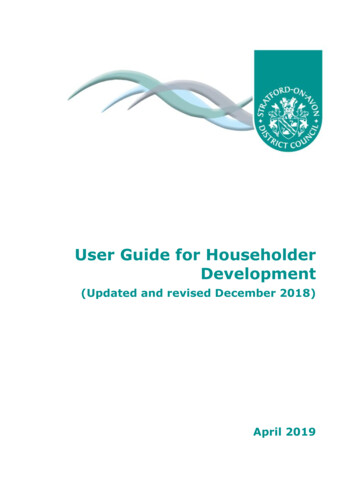
ScholarShare Investment Board, March 25, 2019Peer Plan Asset Growth. The following chart shows the asset growth of California versus Peer Plans:CALIFORNIA VS PEER PLAN ASSET GROWTH 2012 – 2%10%11%10%9%8%16%15%8%5%2%3% 3%4%4% 4%3%0%-1% nsas2014-15Michigan2015-16New Hampshire2016-17New York-0.1%-0.4%-2%2017-18WisconsinThe chart shows that between 2012 and 2018, California’s relative asset growth rates have generallyimproved: In the 2012 transition year, California asset growth (11%) underperformed all Peer Plans(lagging the fastest growing Illinois Plan by approximately 13%) Since 2013, California has remained in the middle of the pack, relatively grouped ahead ofKansas, Michigan and New Hampshire in each year In 2018, California asset growth (-0.4%) surpassed all Plans but for Illinois (3%) and NewYork (-0.1%)Peer Plan relative positions have remained more or less consistent over time: While California’s position improved, Michigan and New Hampshire relative asset growthrates have lagged over timeo Michigan has generally lagged comparably-sized Peer Plans in Illinois and Kansaso Plans that are larger than California exhibit strikingly different growth rates – NewHampshire lags all Peer Plans while New York maintains a strong relative positiondespite its asset size Wisconsin’s comparatively strong asset growth reflects its small asset base compared to otherPeer PlansOver the long term, California assets have grown steadily: Between 2012 and 2018, average annual California asset growth (10.0%) outpaced Michigan(9.8%) and New Hampshire (8.6%), while lagging other Peer Plans over the same period Removing the impact of the 2012 transition year, California assets increased on average 9.8%,outpacing Michigan (8.7%) and New Hampshire (7.7%) by a greater margin-4-
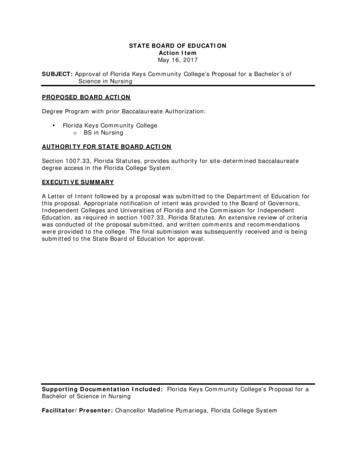
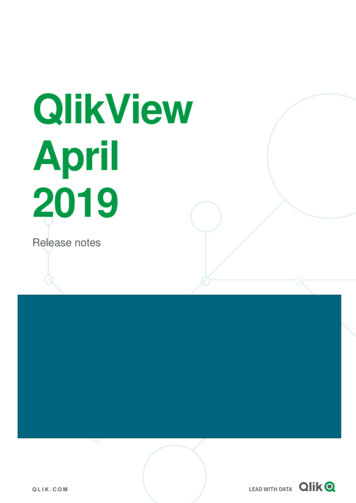
ScholarShare Investment Board, March 25, 2019Peer Plan Account Growth. The following chart shows the account growth of California versusPeer Plans:CALIFORNIA VS PEER PLAN ACCOUNT GROWTH 2012 – 201830%25%20%15%10%10%6% 6%5% 5%4% 4%5%9%8%8% 8%7%7%5%6% 6%8%7% 7%4% 4%6%6% 6% 6%4% 4%8%5%5% 5% 5%6% 6%7%7%6% 7% 7% 7%5%6%7% 7% 7% -14Kansas2014-15Michigan2015-16New Hampshire2016-17New York2017-18WisconsinThe chart shows that between 2012 and 2018, California account growth rates have improved slightlybut lag most Peer Plans in relative terms: California’s negative growth in 2012 reflects the conversion California account growth rates have steadily improved from 3% in 2013 to 6% in each of2017 and 2018 In more recent years, California account growth rates have approximated other Peer Plansbut still lag the leader in IllinoisWe observe noteworthy trends among Peer Plans: Illinois has consistently outpaced Peer Plans, including New York and California, boostedby a smaller account base Wisconsin (close behind Illinois in most years) has also enjoyed a relatively strong accountgrowth due to its small account baseOver the long term, California account growth rates lagged Peer Plans: California and Michigan lagged all Peer Plans over the seven-year and six-year periods Removing the impact of the transition year, California accounts increased on average 4.6%annually, slightly outpacing Michigan’s average annual growth rate (4.5%)In general, California has made notable improvements in asset and account growth over time. Wenote, in absolute terms, California has maintained its status as the fifth largest Direct Plan since2012.44Only New York, Nevada, New Hampshire and Utah exceed California in terms of absolute assets and accounts-5-
ScholarShare Investment Board, March 25, 2019III.COMPARISON OF INVESTMENT STRUCTURESWe have reviewed the investment structure of California and seven Peer Plans to identify differencesin open- versus closed-architecture, portfolio management style and the breadth of options offered.For purposes of this analysis, we modified the Peer Plans defined on page 1 to include theConnecticut Direct Plan and to exclude the Kansas Learning Quest Plan, reflecting a morecomparable investment analysis.5 Thus, the Peer Plans for the investment structure analysis include: Connecticut, Michigan and Wisconsin (managed by TFI)Illinois (managed by Union Bank)Kansas Schwab (managed by American Century)New York (managed by Ascensus)New Hampshire (managed by Fidelity)Data for this section was provided by individual Program Disclosure Statements as of March 6, 2019.Overall Plan Structure. In terms of overall investment structure and fund families involved, all butNew York include non-proprietary investments. Green rows represent TFI-managed Plans.Direct PlanProgram ManagerOVERVIEW OF PLAN INVESTMENT STRUCTUREOpenArchitectureUnderlying Funds CaliforniaTFIYesConnecticutTFIYes IllinoisUnion BankYes Kansas Schwab 529American CenturyMichiganTFIYesYes New HampshireFidelityNew YorkAscensusWisconsinTFI5YesPassive – 100% TIAA-CREFActive – Mostly non-TIAA-CREF(includes DFA, MetWest, PIMCO, T. Rowe Price)Mostly TIAA-CREF(others include BlackRock, DFA, Franklin Templeton, Harding Loevner,MetWest, PIMCO, SSGA, T. Rowe Price, Vanguard)Passive – 100% VanguardMulti-firm – Various fund companies (includes Ariel, Baird, BlackRock,DFA, Dodge & Cox, Dreyfus, Nuveen, Oppenheimer, Prudential, T. RowePrice , Vanguard)Passive –100% Schwab except one VG fundActive – Mostly American Century(others include American Beacon, Baird, JPMorgan, Laudus, MetWest,Schwab)100% TIAA-CREF except one Vanguard fundIndex – 100% FidelityFidelity (Active) – 100% FidelityMulti-firm (Active) – Mostly non-Fidelity (includes Acadian,AllianceBernstein, AQR, BlackRock, Brandywine, Causeway, CreditSuisse, Hotchkis & Wiley, JPMorgan, Loomis Sayles, LSV, MainStay,MetWest, MFS, PGIM, PIMCO, Western Asset, William Blair)No100% VanguardYesMostly TIAA-CREF(others include DFA, MetWest, T. Rowe Price and Templeton)Connecticut is a TFI-managed, Bronze-rated Plan; Schwab 529 has a large number of California-based accounts-6-
ScholarShare Investment Board, March 25, 2019While Peer Plans are characterized as “open architecture” (based on at least one fund unrelated tothe Program Manager), a large number of the underlying funds are still proprietary to each ProgramManager. For example, the chart above shows that the TFI-managed Plans predominantly use TIAAfunds. Kansas generally includes either an American Century or Schwab Fund. New Hampshireincludes an all-Fidelity line-up in two out of three age-based options.Age-Based Portfolio Management Style. The following chart shows information about the portfoliomanagement style for the Peer Plans. The style skews towards passive management since six ofeight Plans, including California, offer at least one passively-managed age-based option.OVERVIEW OF AGE-BASED PORTFOLIO M ANAGEMENT STYLECaliforniaIllinoisKansasMichiganNew YorkNew sas6New HampshirePassiveActiveNote: TFI-managed states shown in blueAs further detailed in the following chart, it is interesting to note that Michigan and New York offeronly passive management for age-based options. Four of eight Plans – California, Illinois, Kansasand New Hampshire – offer a choice of passive and blended or active management. Plans inConnecticut and Wisconsin solely use a blended management style.MANAGEMENT STYLE OF AGE-BASED OPTIONSNumber of Options6Direct PlanPassiveBlend or ActiveOverallManagement StyleCalifornia1 Passive1 ActiveChoice of Passive and ActiveConnecticut--3 BlendBlendedIllinois3 Passive3 BlendChoice of Passive and BlendedKansas Schwab 5294 Passive4 ActiveChoice of Passive and ActiveMichigan3 Passive--PassiveNew Hampshire1 Passive2 ActiveChoice of Passive and ActiveNew York3 Passive--PassiveWisconsin--3 BlendBlendedUnderlying funds include just one index fund that comprises, at most, 8.50% of any actively-managed age-based portfolio-7-
ScholarShare Investment Board, March 25, 2019Breadth of Investment Options. California offers a selection of investment choices that is on parwith Peer Plans. As shown in the following chart, California (19) exceeds the average number oftotal options offered by Peer Plans (17.4). We also note differences in the TFI-managed Plans inMichigan (9), Connecticut (14) and Wisconsin (17). Kansas Schwab 529 offers the greatest numberof age-based options – four passively-managed and four actively-managed options. The Illinois lineup offers 28 options overall, including 16 individual options (the most individual options offered).DISTRIBUTION OF INVESTMENT OPTIONSDirect nsas Schwab 529218121California192125Wisconsin17287New York16358New Hampshire15366Connecticut14347Michigan9342Average of Peer Plans17.43.87.16.5Taking a closer look at individual options, we note that the total number of options ranges widelyfrom 1 to 16, with California in the lower end, as shown in the following chart:INDIVIDUAL OPTIONS OFFEREDDirect Plan# of Options 7Illinois16New York8Connecticut7Wisconsin7New Hampshire6California5PassiveUS / Int’l EquityUS/ Int’l BondTIPSReal EstateUS / Int’l EquityBondUS / Int’l EquityBondUS EquityBondUS /
Apr 04, 2019 · (“Learning Quest Direct”), and Schwab Learning Quest 529 Plan (“Schwab Learning Quest”). While we have included all three Direct-sold Plans for growth comparisons, we note that the Schwab 529 is the Plan with high California account concentration 3 Schwab 529 and Le