Transcription
The 54th International Conference of the Architectural Science Association (ANZAScA) 2020A bio-hygrothermal mould growth analysis of typicalAustralian residential wall systems1Shruti Nath1, Mark Dewsbury1, Phillipa Watson1, Heather Lovell1 and Hartwig Künzel2University of Tasmania, Launceston, Australia and University of Tasmania, Hobart, Australia{Shruti.Nath@utas.edu.au , Mark.Dewsbury@utas.edu.au , Phillipa.Watson@utas.edu.au ,Heather.Lovell@utas.edu.au }2Fraunhofer Institute for Building Physics, Stuttgart, Germanyhartwig.kuenzel@ibp.fraunhofer.deAbstract: Since 2014, Australian scholars and design and construction professionals have raised concerns aboutthe increased presence of mould and condensation within new stand-alone and multi-residential buildings.Several studies have identified significant material decay and mould growth within external wall systems due tolong-term moisture accumulation. This paper focusses on moisture and mould growth in buildings by providingan in-depth analysis of the most common external wall system for Australian residential buildings (cavity brickveneer). This wall’s moisture accumulation over a ten-year period was simulated using multi-year transienthygrothermal software. Transient hygrothermal simulation is novel within the Australian research and regulatorycontext. Mould growth was simulated and analysed using a post-processing mould growth software. To assist ininforming regulatory development, simulations were completed for three temperate Australian climate zones.The modelled wall system applied typical and regulation-compliant building material configurations for pre-2003,2004, 2007 and 2010. The results of the modelled wall system will be used to inform national building regulationsin Australia. A key component of this paper includes the evaluation of internationally accepted methods formould growth simulation.Keywords: Mould; health; WUFI ; biohygrothermal software1. IntroductionMoisture accumulation leads to condensation and mould formation within habitable environments, and hasemerged as a serious challenge for many Australian homes (CBOS, 2018). Moreover, recent enhancements toenergy efficiency requirements within the National Construction Code (NCC) have resulted in warmer interiorenvironments in standalone single dwellings (Class 1) and apartment buildings (Class 2) buildings withinAustralia's temperate and cool temperate climates (NCC climate zones 2 to 7). Many new buildings in theseclimates are now presenting the co-related problems of condensation and mould (Dewsbury and Law, 2017).Condensation has been identified as a national problem by the Australian Building Codes Board (ABCB) andindustry-based partners (Dewsbury et al., 2016; Law, 2019). In a nationwide survey, conducted by the ABCB,respondents identified that up to 40% of Class 1 and Class 2 contemporary homes were showing the presence ofinterior surface condensation and mould (Dewsbury and Law, 2016). Law (2019) states that 1 in 3 homesthroughout Australia may be water or mould damaged.Managing water vapour diffusion is essential to reduce the occurrence of mould sporing in homes. Mouldgrowth and the accumulation of interstitial and surface moisture can take place due to the combination ofwarmer internal temperature and higher relative humidity (hereafter RH) coming onto contact with coolersurfaces or interacting with a cooler airflow (Dewsbury and Law, 2017). This is significant because moistureaccumulation or mould growth within the habitable environments and interstitial spaces leads to buildingmaterial decay, structural failure and has adverse effects on occupant health (WHO, 2009 ). Nath et al. (2019)stressed the importance of controlling mould exposure and moisture related damage within buildings to preventadverse health effects. WHO (2009 ) highlighted that there is a 50% increase in asthma rates when there isresidential dampness. Asthma is known to be exacerbated by mould and is the leading disease in children aged0–14 years in Australia, accounting for 12.3% of the total asthma burden (Knibbs et al., 2018). Compounding this,children spend around 60-75% of their time indoors (Knibbs et al., 2018). Exposure to damp housing andsensitization to dust allergens and mould are the key risk factors for asthma (Douwes and Pearce, 2003).Dewsbury and Law (2016) strongly emphasized the requirement for building regulations in Australia tomitigate moisture accumulation and mould growth, and to require construction methods that manage the causesImaginable Futures: Design Thinking, and the Scientific Method. 54th International Conference of theArchitectural Science Association 2020, Ali Ghaffarianhoseini, et al (eds), pp. 1–10. 2020 andpublished by the Architectural Science Association (ANZAScA).1
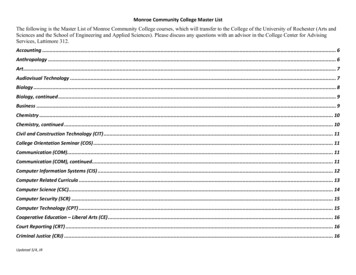
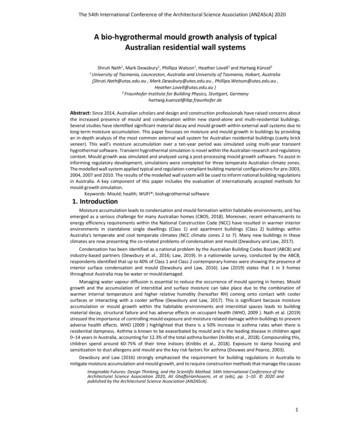
Shruti Nath, Mark Dewsbury, Phillipa Watson, Heather Lovell and Hartwig Künzelof moisture accumulation. To assist in informing regulatory development, in this research simulations werecompleted for three different Australian climate zones, (CZ7 – cool temperate, CZ6 - temperate, CZ2 – warm andhumid) in compliance with Australian regulations for external wall fabric configurations for pre-2003, 2004, 2007and 2010. Figure 1, below, shows the ABCB climate zones across Australia, with: CZ7 as dark blue, CZ6 as lightblue and CZ2 as yellow. These three climate zones include Australia’s largest centres of population and residentialbuilding construction.This paper reports on the most common external wall systems used in residential buildings in Australia asa part of a larger research project on “Healthy built fabric systems for zero energy residential buildings inAustralia.” Research activities of the larger project include the detailed hygrothermal analysis of commonexternal wall types used for residential buildings: cavity brick veneer, compressed fibre cement sheetweatherboard (timber) and sheet-metal. This paper focusses on a regulation compliant cavity brick veneer wallsystem, representing approximately 50% of new stand-alone dwellings. This paper provides an indication of thelikely performance of a notable proportion of houses in these climate zones, further progressing understandingof moisture and mould challenges that may arise in homes built to NCC energy efficiency requirements.In this paper, results for moisture accumulation for cavity brick veneer wall type were simulated for a tenyear period using the transient hygrothermal simulation software, WUFI Pro, version 6.5, (2020) (hereinafterreferred to as the hygrothermal simulation/software). Hygrothermal simulation calculates heat, air and moisturemovement. Mould growth was simulated using two add-on (post-processing) software, WUFI VTT andWUFI Bio. These post processors are vital software add-ons when wishing to ascertain the full impact of moistureaccumulation and its likely relationship to mould growth in buildings. This paper reports on the results from theWUFI VTT mould growth simulation (here after referred to as bio-hygrothermal simulation/software).This paper supports research on moisture and mould in buildings by providing an in-depth analysis of acommon external wall system for Australian residential buildings. Learnings from this paper and the larger projectwill inform national heath and amenity regulations within the NCC.Figure 1: ABCB Australian climate zone map (2019)2. Background & Literature ReviewIn Australia, over the last two decades, building regulations for energy efficiency have increased substantiallywith the focus on reducing greenhouse gas emissions via the provision of more energy efficient and sustainablehomes (ABCB, 2019). Energy security and environmental sustainability are the two main policy issues which droveimprovements in energy efficiency in the building industry (Berry and Marker, 2015). Energy efficiency provisionsfor stand-alone homes are discussed in the NCC Volume 2 (ABCB, 2019). To meet NCC energy efficiencyrequirements, broadly, houses need to use insulation and weather sealing building materials (Dewsbury and Law,2017). Weather sealing is required because it prevents air leakage and improves the energy efficiency of thebuilding envelope. The energy efficiency regulation for the building envelope is established by setting minimuminsulation levels (R-values) required by walls, roofs and floors in different climate zones (Ambrose and Syme,2017). The thermal transmittance (U value) of the windows also plays a vital role in the energy efficiencyprovisions of the residential buildings (Ballinger and Lyons, 1996). The commensurate changes in the energyefficiency standards of the NCC have created more airtight homes (Ambrose and Syme, 2017).Airtightness has not been considered as an area of concern by the building industry for many years (Ambroseand Syme, 2017). Research conducted by the CSIRO, on a selection of relatively new homes, found that theairtightness results varied from quite leaky to quite airtight. The more air-tight houses showed a much higher2
A bio-hygrothermal analysis of typical Australian residential wall systemsthan required air-tightness value for contemporary homes (Ambrose and Syme, 2017). Interestingly, theairtightness profile of New Zealand houses has been extensively studied as one feature for a new industry designtool to inform and guide indoor moisture risks identified in the New Zealand Building Code (Leardini and VanRaamsdonk, 2010). The combination of warmer well insulated homes combined with greater airtightness levelscan lead to moisture accumulation in the built environment, creating a perfect condition for “Sick BuildingSyndrome” (Ghaffarianhoseini et al., 2018). The NCC currently provides inadequate guidance to deal withcondensation and residential dampness in contemporary code-compliant homes (Bulic et al., 2019). This lack offocus has unintentionally given rise to condensation problems in homes (Dewsbury et al., 2016). The currentAustralian regulatory framework provides inadequate guidance for the Design, Construction and Certifyingprofessions regarding the design methods, management and mitigation of moisture accumulation strategies inresidential buildings (Bulic et al., 2019). Inappropriate material assemblages combined with a lack of ventilation,will lead to unacceptable moisture levels in the built fabric and mould growth (Chang et al., 2020). The Presenceof mould within the habitable environment could also impact the indoor air quality (Douwes and Pearce, 2003).The passive management of inward and outward moisture and water vapour is a critical part of designing anintegrated building enclosure. Internationally, moisture control design of the built structure commonly useseither project specific hygrothermal simulation or envelope regulations informed by hygrothermal simulation(Künzel and Zirkelbach, 2013). Currently, moisture control design of the built structure using hygrothermalsimulation is state-of-the-art (Künzel and Zirkelbach, 2013). In a multi-layered external wall system, adjacentelements also play a major role in the functioning of the building (Nath and Dewsbury, 2019). In Tasmania, andAustralia, the cavity brick veneer wall is the most common type of external wall (CSIRO, 2020). This wall type hasa high barrier for wind driven rain and a relative low cavity ventilation rate (Vanpachtenbeke, 2019). Additionally,the clay brick can store significant amounts of moisture. In addition to the normal outward flow of water vapour,in this wall type, the moisture levels within the cavity may become high, which could lead to an inward vapourflow and a higher moisture content in the internal layers of the wall. Furthermore, there might be significantinterstitial condensation risk in case of solar driven inward vapour transport (Vanpachtenbeke, 2019). Lstiburek(2002) stated that interstitial condensation on the plastic vapour barrier can be caused by solar driven inwardvapour transport due to wet cavity brick veneer cladding. The usage of the varied terms has led to the existenceof terminologies like Air Barrier, Water Barrier, Vapour Barrier and ventilated cavities (Nath and Dewsbury, 2019;Olaoye and Dewsbury, 2019). Since no material can provide a permanent or perfect barrier, many researchersare striving to amend the term from Barrier to Control Layer (Nath and Dewsbury, 2019).In a framed wall construction the critical area where moisture build-up usually takes place is within theinternal portion of the weather control layer (Nelson, 2017). The movement of water vapour within the builtfabric should be passively controlled to avoid high interior relative humidity conditions, mould growth andmoisture accumulation in the wall assembly (Smith, 2017). The air movement within a wall is much more complexthan modelled by many one-dimensional hygrothermal simulation tools. Due to any differences between thesimulation of the perfect wall and the construction of a real wall, the wall may be unable to manage water vapourand moisture accumulation. Furthermore, these features must also be applied to other building enclosureelements, such as the roof, floor, footings and foundation condition, to minimise serious moisture-relateddamage (Vanpachtenbeke, 2019).A preliminary simulation study found that in NCC Climate Zone 7, there were varying amounts of moistureaccumulation in the North, East, West, and South facing walls. The west wall showed the greatest amount ofmoisture accumulation (Nath and Dewsbury, 2019). This extensive desktop study found similarities withobserved moisture contents in the external walls of Tasmanian houses. The output data from the hygrothermalsimulation software was then used as input data in the bio-hygrothermal post processing simulation.Complex transient hygrothermal calculation tools model dynamic changes within the built fabric (walls,floors and roofs or building elements), on an hourly basis throughout the year, and for multiple years (Mumovicet al., 2006). Künzel et al. (2005) highlighted that to understand the hygrothermal processes in the buildingenvelope requires an understanding of water vapour control strategies which prevent mould formation on theinternal, interstitial, and external surfaces of the building. An added feature of the hygrothermal simulationsoftware, is its ability to analyse and assess mould growth conditions (Viitanen et al., 2015). Mould growthmodels are available as post processors in WUFI and other world leading hygrothermal simulation tools.3. MethodologyTo establish whether Australian regulatory compliant, commonly constructed residential Australian externalwall types may have caused increased levels of moisture accumulation within the built fabric, required a multifacetted approach. As the hygrothermal simulation software had already been selected (Nath and Dewsbury,2019), the methodology included several steps, namely:3
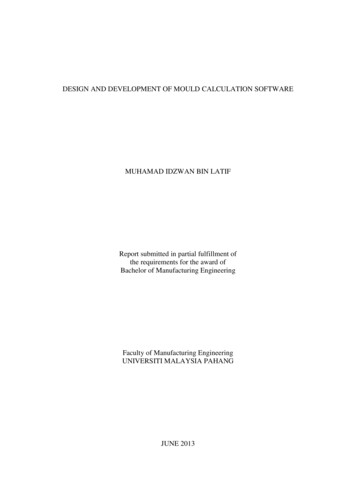
Shruti Nath, Mark Dewsbury, Phillipa Watson, Heather Lovell and Hartwig Künzel the selection of a typical Australian regulatory compliant residential wall systems from pre-2003, 2004,2007 and 2010;the selection of appropriate NatHERS Climate Zones; andthe selection of an appropriate mould growth model.The National Construction Code applies eight climate types to Australia’s building regulatory framework, asshown in Figure 1 above. However, the regulatory approved climate data for use in Nationwide House EnergyRating Scheme (NatHERS) energy efficiency calculations include 69 climate types. For the purposes of thisresearch, and recognising a combination of State (Tasmania) and National relevance, the NatHERS climate datathat was selected include: Hobart (NCC CZ 7), Melbourne (NCC CZ 6), and Amberley (NCC CZ 2).In this research project simulations for different wall types (cavity brick veneer, compressed fibre cementsheet and weatherboard) were completed for three different climate zones (CZ7, CZ6 and CZ2) usinghygrothermal simulation software for the span of 10 years. The simulations were completed for all the fourorientations – north, south, east and west. The international practice of single years, 3 years and 5 years hasbeen significantly critiqued as inadequate (Arena and Mantha, 2013). The selection of longer span provides amore suitable long-term analysis of moisture accumulation within the built fabric. This paper focusses onmoisture and mould growth in buildings by providing an in-depth analysis of the most common external wallsystem for Australian residential buildings (cavity brick veneer) in CZ7. The biohygrothermal simulation resultsdiscussed in this paper are for the West orientation wall simulated for a span of 10 years. Due to the need tokeep a tight scope in this paper, we present findings for western orientations. This orientation was chosen dueto previous empirical and preliminary hygrothermal simulation data, which showed this to be the most moistureeffected wall orientation. This wall orientation also experiences notable swings in temperature, which isinstructive in this instance.Since 2003 the changes made in the construction of a cavity brick veneer wall type is shown in Figure 2below. Before 2003 a cavity brick veneer wall comprised of 110mm clay brick, 130 mm air gap (90mm structuralframe and 40 mm cavity), 10mm paper faced gypsum plasterboard and the painted interior surface layer,respectively. Later there was an addition of 1mm pliable membrane to the external wall system. According toAS/NZ 4200 a pliable membrane could be installed to perform as a sarking membrane, vapour barrier, thermalinsulation, or even as a combination of all three. A pliable membrane can be a vapour impermeable membrane(vapour barrier) or vapour permeable membrane (breathable). In 2003, most pliable membranes available inAustralia were vapour impermeable. As per the later enhancements in the NCC (2003-2019), a cavity brick veneerwall comprises of 110mm clay brick, 40mm air cavity, 1mm pliable membrane, 90mm insulated timber frame,10mm paper faced gypsum plasterboard and the painted interior surface layer, respectively. Since 2014, theresearch team has conducted empirical and hygrothermal simulation research to understand the impact ofvapour permeable and vapour impermeable membranes within the Australian residential wall systems.Figure 2: Sectional details of a code compliant cavity brick veneer wall in Climate Zone 7A mould prediction model or bio hygrothermal simulation software can be used to predict the mouldgrowth risk in the design phase, allowing assessment of the building envelope and construction details at a timewhen they can still be changed before construction (Vereecken et al., 2011). Several models are found in theliterature (e.g. temperature ratio, isopleth systems, biohygrothermal model, ESP-r mould prediction model,empirical VTT-model) (Vereecken et al., 2011). The WUFI Bio model and the VTT/Viitanen model are twointernationally recognised mould growth simulation methods (Viitanen et al., 2015).4
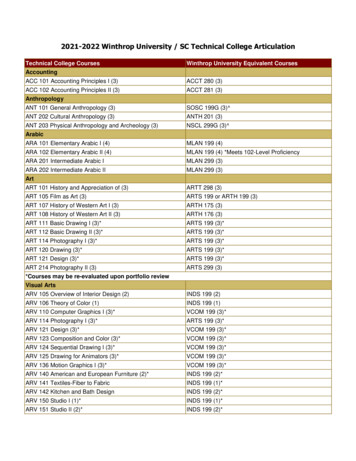
A bio-hygrothermal analysis of typical Australian residential wall systems3.1 Biohygrothermal simulation software, (WUFI VTT)The hygrothermal simulation software has two internationally recognised mould growth models; WUFI Bio model, and the updated VTT/Viitanen model (WUFI VTT). The resulsy from the updated Viitanen model aredescribe in this paper. The VTT/Viitanen model was developed by Hukka and Viitanen at the VTT (TechnicalResearch Centre of Finland) (Vereecken et al., 2011). This method uses a six-step assessment approach, with thefinal step generating the Mould Index (MI), which indicates the concentration of mould growth on the surface asa percentage (Viitanen et al., 2015). Mould indexes, discussed in Table 1 below, show mould growth intensities,otherwise called growth rates or colonization rates. This model also calculates the amount of mould growth inmm (Viitanen et al., 2015) which we report in tables in the results section.Table 1: Mould index for empirical validation as used in the VTT modelIndex0123456Description of the growth rateNo growthSmall amounts of microscopic mould growth on surfacesSeveral local colonization of microscopic mould growth on surfacesVisual results of mould on surface, 10 % coverage, or 50 % coverage of microscopic mouldVisual results of mould on surface, 10 - 50 % coverage, or 50 % coverage of microscopic mouldHigh colonization of mould growth on surface, 50 % coverage (visual)Very high and tight colonization of mould growth on the surface, coverage about 100 %The material selection list in this model is broad. Factors for each material are predefined and can also bemodified based on individual requirements. The different factors include the sensitivity class, material class, andtype of wood. The sensitivity class allows the selection of four different sensitivity class – very sensitive, sensitive,medium resistant and resistant. The selection of specific sensitivity class can be done depending on the materialselection. The material class establishes the four different material specific mould decline classes and allows foruser defined settings. The type of wood (hardwood or softwood) can also be selected. Both bio-hygrothermalpost processing mould growth models (WUFI Bio and WUFI VTT) were used in the research, but due to sizelimitations, this paper reports on the results from WUFI VTT.4. Results & DiscussionThis section discusses the typical building material arrangement in an Australian code compliant cavity brickveneer wall in climate zone 7. Section 4.1 discusses the results from the hygrothermal simulations that werecompleted to assess likely moisture accumulation. Section 4.2 discusses the results from the mould growth modelthat were completed to assess likely mould growth conditions using the postprocessor bio-hygrothermal postprocessing simulation tool. Results from the analysis of compressed-fibre-cement-sheet, timber and sheet metalclad external framed walls and masonry construction external wall systems are not discussed here and will bediscussed in future publications.4.1 Hygrothermal results using transient state hygrothermal simulation software, WUFI ProThis section discusses the hygrothermal results in a cavity brick veneer wall model in climate zone 7 usingthe hygrothermal simulation tool (described above). Simulations have been completed for the span of ten yearsto investigate the condensation risk analysis. Temperature and dewpoint fluctuations and moisture accumulationfindings are presented first. Figure 3 shows a graphical sample of the simulation result from a typical west facingcavity brick veneer wall in Hobart’s climate, constructed according to the NCC 2019 regulations. This graphicalrepresentation of the wall comprises from left to right; 110mm clay brick, 40mm cavity, 1mm (impermeable)pliable membrane, insulated timber frame (R2.8 glass-wool batt insulation), 10mm paper faced gypsumplasterboard and acrylic paint. The top portion of the Figure 3 shows the temperature fluctuations between theinterior and exterior of the wall. In this case the exterior temperature fluctuates between 1 C to 30 C. The redhorizontal line indicates temperature and the purple horizontal line indicates dew point temperature. The lowerportion of the figure shows relative humidity and moisture accumulation. The green line and the green fill showthe variation in relative humidity, which varies between 20% and 100% through the various components of thewall. The blue fill indicates moisture accumulation, the Figure 3 also shows moisture accumulation in the claybrick, vapour cavity and insulated timber frame (inside surface of pliable membrane) layers. Viitanen and Ojanen(2007), affirmed that conducive environments for mould growth occur when the internal temperature isbetween5
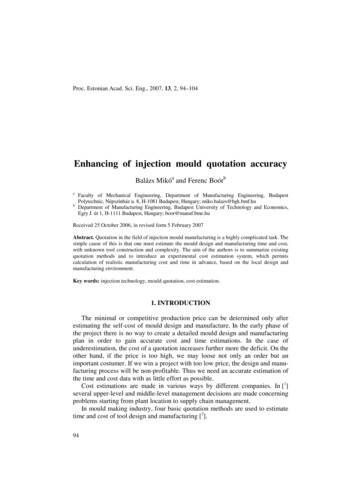
Shruti Nath, Mark Dewsbury, Phillipa Watson, Heather Lovell and Hartwig Künzel20 C and 50 C and the relative humidity is above 75%. Therefore, Figure 3 shows simulated moistureaccumulation results which is likely to lead to mould growth.The temperature at which the water vapour condenses is known as dew point (Dewsbury et al., 2016).Dew point temperature constantly varies, as it responds to air temperature, the amount of water vapour in theair and air pressure (Dewsbury et al., 2016). It is important to simulate the occurrence of dewpoint because itprovides detailed results on various aspects of water vapour transport and moisture accumulation within andthrough the built fabric. Hygrothermal software (in this instance WUFI Pro) is used to validate and review thevarious dew points that occur within a building and its construction elements. Figure 4 shows the dewpoint andtemperature fluctuations on the exterior surface of the brick. The red lines show the annual temperaturefluctuations, whilst the purple lines show the annual dewpoint fluctuations. Where temperature and dewpointlines converge in the graph shows where moisture will form. It is evident in this graph that air temperature anddewpoint temperature often converge.Figure 3: Graphical output of a West orientation cavity brickveneer wall in climate zone 7 as per NCC 2019Figure 4: Graph showing the temperature anddewpoint fluctuations in the exterior surface ofthe brick4.2 Mould growth results using bio-hygrothermal simulation software, (WUFI VTT)This section discusses the mould growth simulation results for a cavity brick veneer wall, in climate zone8. The ten years of output data from the hygrothermal simulation software was used as input data for the postprocessing bio-hygrothermal simulation tool. The critical moisture content of moulds spores was analysed usingthe bio-hygrothermal software. When critical moisture content is reached, the germination of the spore takesplace and mycelium starts to grow. In the results below, each element of the cavity brick veneer wall system isanalysed for dew point, moisture accumulation and mould growth.The first element analysed is the clay brick. Figure 5 shows the relative humidity, critical relative humidity,and temperature fluctuations from the bio-hygrothermal software. The critical relative humidity required for thegermination of mould spores or mould growth (mould index) is a function of temperature and exposure time(Viitanen and Ojanen, 2007). The simulation result for this layer from this post-processing software is a red trafficlight, which indicates that the mould growth rate is at an unacceptable level. This is further supported by Figure6 from bio-hygrothermal software, which shows the simulated mould growth over the ten-year period. Thisshows a continual mould growth pattern for the ten-year period. Figure 7 shows the mould growth indices frombio-hygrothermal software. The graph shows a mould growth index range from 0 to 4 with a gradual increasefrom 0 to 4 in the first seven years. This indicates that this form of construction supports dangerous levels ofmoisture accumulation and mould growth on the inside surface of the clay brick.Figure 5: Graph showing temperature andrelative humidity fluctuations in the brick layerusing bio- hygrothermal software6Figure 6: Graph showing the mould growth rate inthe brick layer using bio-hygrothermal software
A bio-hygrothermal analysis of typical Australian residential wall systemsFigure 7: Graph showing the mould index in the brick layer using bio-hygrothermal softwareThe next element analysed is the 40mm air cavity. Figure 8 shows the relative humidity, critical relativehumidity, and temperature fluctuations from bio-hygrothermal software. Like the clay brick results discussedabove the resultant red traffic light indicates that the mould growth rate is at unacceptable level. Figure 9 frombio-hygrothermal software, shows the simulated mould growth over the ten-year period. The graph shows acontinual mould growth pattern over the ten-year period. Figure 10 shows the mould growth indices from biohygrothermal software. The graph shows a mould growth index range from 0 to 5 or 6. The graph shows a gradualincrease from 0 to 4 in the first year, with an increase to 5 in the second and subsequent years. This indicatesthat this form of construction supports dangerous levels of moisture accumulation and mould growth in the aircavity space.Figure 8: Graph showing temperature and relativehumidity fluctuations in the air cavity layer using biohygrothermal softwareFigure 9: Graph showing the mould growth rate inthe air cavity layer using bio-hygrothermal softwareFigure 10: Graph showing the mould index in the air cavity layer using bio-hygrothermal softwareThe next element analysed is the 1mm pliable membrane. Figure 11 shows the relative humidity, criticalrelative humidity, and temperature fluctuations from bio-hygrothermal software. The results include the redtraffic light indicating that the mould growth rate is unacceptable. Figure 12 from bio-hygrothermal software,shows the simulated mould growth over the ten-year period. The graph shows a continual mould growth patternover the ten-year period. Figure 13 shows the mould growth indices from bio-hygrothermal software. The graphshows a mould growth index range from 0 to 4. The graph shows a gradual increase from 0 to 2 in the first year,with an increase to 4 in the third and subsequent years. This indicates that this form of construction supportsdangerous levels of moisture accumulation and mould growth on the inside surface of the pliable membrane.Figure 11: Graph showing temperature andrelative humidity fluctuations in the vapourimpermeable membrane layer using biohygrothermal softwareFigure 12: Graph showing the mould growth rate inthe vapour impermeable membrane layer using biohygrothermal software7
Shruti Nath, Mark Dewsbury, Phillipa Watson, Heather Lovell and Hartwig KünzelFigure 13: Graph showing the mould index in the vapour impermeable membrane using bio-hygrothermalsoftwareThe next element analysed is the 90mm insulated timber frame. Figure 14 shows the relative humidity,
Mar 1, 2021