Transcription
Bruse et al. BMC Medical Imaging (2016) 16:40DOI 10.1186/s12880-016-0142-zTECHNICAL ADVANCEOpen AccessA statistical shape modelling framework toextract 3D shape biomarkers from medicalimaging data: assessing arch morphologyof repaired coarctation of the aortaJan L. Bruse1*, Kristin McLeod2,3, Giovanni Biglino1,4, Hopewell N. Ntsinjana1, Claudio Capelli1, Tain-Yen Hsia1,Maxime Sermesant3, Xavier Pennec3, Andrew M. Taylor1, Silvia Schievano1 for the Modeling of Congenital HeartsAlliance (MOCHA) Collaborative GroupAbstractBackground: Medical image analysis in clinical practice is commonly carried out on 2D image data, without fullyexploiting the detailed 3D anatomical information that is provided by modern non-invasive medical imagingtechniques. In this paper, a statistical shape analysis method is presented, which enables the extraction of 3Danatomical shape features from cardiovascular magnetic resonance (CMR) image data, with no need for manuallandmarking. The method was applied to repaired aortic coarctation arches that present complex shapes, with theaim of capturing shape features as biomarkers of potential functional relevance. The method is presented from theuser-perspective and is evaluated by comparing results with traditional morphometric measurements.Methods: Steps required to set up the statistical shape modelling analyses, from pre-processing of the CMR imagesto parameter setting and strategies to account for size differences and outliers, are described in detail. The anatomicalmean shape of 20 aortic arches post-aortic coarctation repair (CoA) was computed based on surface modelsreconstructed from CMR data. By analysing transformations that deform the mean shape towards each of theindividual patient’s anatomy, shape patterns related to differences in body surface area (BSA) and ejectionfraction (EF) were extracted. The resulting shape vectors, describing shape features in 3D, were comparedwith traditionally measured 2D and 3D morphometric parameters.Results: The computed 3D mean shape was close to population mean values of geometric shape descriptorsand visually integrated characteristic shape features associated with our population of CoA shapes. Afterremoving size effects due to differences in body surface area (BSA) between patients, distinct 3D shapefeatures of the aortic arch correlated significantly with EF (r 0.521, p .022) and were well in agreementwith trends as shown by traditional shape descriptors.Conclusions: The suggested method has the potential to discover previously unknown 3D shape biomarkersfrom medical imaging data. Thus, it could contribute to improving diagnosis and risk stratification in complexcardiac disease.Keywords: Statistical shape model (SSM), 3D Shape analysis, Coarctation of the aorta, Congenital heartdisease, Computational modelling* Correspondence: jan.bruse.12@ucl.ac.uk1Centre for Cardiovascular Imaging, University College London, Institute ofCardiovascular Science & Cardiorespiratory Unit, Great Ormond StreetHospital for Children, London, UKFull list of author information is available at the end of the article 2016 The Author(s). Open Access This article is distributed under the terms of the Creative Commons Attribution 4.0International License (http://creativecommons.org/licenses/by/4.0/), which permits unrestricted use, distribution, andreproduction in any medium, provided you give appropriate credit to the original author(s) and the source, provide a link tothe Creative Commons license, and indicate if changes were made. The Creative Commons Public Domain Dedication o/1.0/) applies to the data made available in this article, unless otherwise stated.
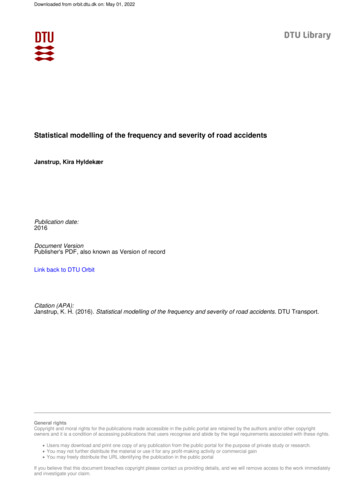
Bruse et al. BMC Medical Imaging (2016) 16:40BackgroundDiagnosis and risk stratification of cardiac disease usingmedical imaging techniques are primarily based on theanalysis of anatomy and structure of the heart and vessels. This is particularly true for complex conditionssuch as congenital heart disease (CHD), where themorphology defines the cardiac defect in the first instance and is subsequently altered by surgical and catheter intervention to improve functionality. In clinicalpractice, however, anatomical analysis of shape andstructure is often carried out via simple morphometry,using parameters measured in 2D (e.g. vessel diameter,area, angulation). This does not fully exploit the abundance of information that current imaging techniquessuch as cardiovascular magnetic resonance (CMR) orcomputed tomography (CT) offer [1, 2]. Furthermore,using simple shape descriptors, the relationship betweencomplex global and regional 3D shape features, such asthe combination of stenoses, dilations or tortuosity andcardiac function has not been fully explored.Conversely, statistical shape models (SSM) allow visualisation and analysis of global and regional shape patternssimultaneously and in 3D [3] as they are constituted by acomputational atlas or template, which integrates all anatomical shape information intuitively as a visual and numerical mean shape and its variations in 3D. The templateis essentially an anatomical model of the average geometryof a shape population. Based on this template, descriptiveor predictive statistical shape models can be built [1, 4], toexplore how changes in shape are associated with functional changes.SSMs have been applied in cardiac research for aroundtwo decades [5] in order to describe 3D morphologicalcharacteristics and, more recently, for diagnostic orprognostic purposes [4, 6, 7]. However, these studies arebased on parametric methods, in which: i) Shapes areparameterised by landmarks, and ii) Point-to-point correspondence between input shapes is a requirement.These pre-requisites prove particularly challenging tofulfil when dealing with complex, amorphous structuresand, therefore, limit the use of such methods in CHD(Fig. 1). In addition, manual landmarking is laborious,limited to expert users [8] and proves to be challengingin the absence of distinct anatomical landmarks.More recently, a novel non-parametric SSM frameworkthat does not rely on any prior landmarking [9, 10], hasbeen introduced to the cardiac field by Mansi et al.[11–13]. The method is based on a complex mathematical framework, which analyses how a representativetemplate shape deforms into each of the shapes present inthe population. In a simplified way, for example, an “ideal”template aorta can be deformed into any possible patientaorta shape by applying the correct transformations. Instead of the shapes themselves, these transformations arePage 2 of 19Point correspondence?Fig. 1 Point-to-point correspondence problem in complex cardiacmorphologies. Widely used parametric methods to build statisticalshape models are based on the so called Point Distribution Model(PDM) [5], in which shapes are parameterised by landmarks. Booksteinet al. [40] define landmarks as points on the structure’s surface for which“objectively meaningful and reproducible [ ] counterparts [ ]” exist inall other structures present in the dataset. In complex cardiac structureshowever, those point correspondences are difficult to establish, asillustrated here for two aortic arch models from the CoA cohortanalysed [14] and subsequent shape analysis is carried outrobustly within this transformation framework. A key advantage, in addition to neither requiring landmarking norpoint-to-point correspondence between input shapes, isthat the method is able to handle large variability betweenshapes, making it an even more attractive tool for investigating 3D cardiovascular anatomical structures in CHD.The aim of this paper is to present this shape analysismethod to the larger clinical and engineering communityby describing a step-by-step approach to set up such aSSM and by demonstrating its validity using conventionalmorphometric parameters. As an example, the study focuses on aortic arch shapes of patients post coarctation repair [15, 16], as they typically present highly variable,complex shapes, which have been extensively described interms of traditional morphometric analyses [17–19]. Todemonstrate the capabilities of the proposed method, wehave derived global and regional shape features potentiallyassociated with ejection fraction (EF) as novel 3D shapebiomarkers. We hypothesised that low EF, which characterises poor ventricular function, could be associated withdistinct shape patterns of the aortic arch that affect cardiacafterload.MethodsStatistical shape modelling framework (SSM)The shape analysis method used here makes use of aframework proposed by Durrleman et al. [12, 14]. To
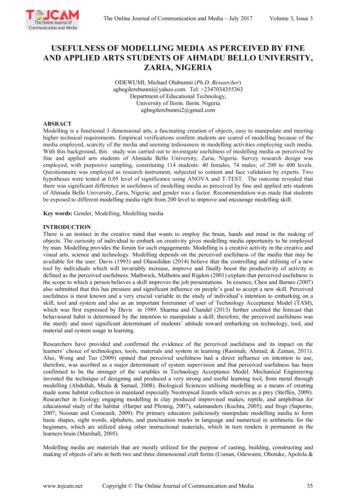
Bruse et al. BMC Medical Imaging (2016) 16:40Page 3 of 19compute a template (i.e. an “anatomical mean shape”)and describe shape variability around this template, theframework is based on a forward approach [14], which essentially describes each subject as a deformation of thetemplate plus some residual information (Fig. 2) [12]. Thetemplate is deformed into each subject shape by applyingan appropriate transformation. Thus, the transformationfunction is the crucial component for shape analysis as it“maps” (i.e. describes how to transform one geometry intothe shape of another geometry) the template towards eachindividual subject shape (Appendix 1).To represent shapes non-parametrically without involving landmarking, the framework relies on mathematical currents introduced to anatomical analysis byGlaunès and Vaillant [9]. Currents act as surrogate representations of shapes by characterising a shape as a distribution of shape features [14]. Shapes can then becompared by computing how distributions of featuresdiffer, rather than by computing differences between individual points. This removes the parameterisation required by other methods. Currents can be seen as anindirect measure of shape as they model geometric objects via their reaction on a probing test vector field [20,21]. An analogy to currents representing shapes couldbe probing an object with a 3D laser scanner (the “testvector field”) with a certain direction from all possibleangles or positions around the object (Fig. 3) [20].Mathematically, currents are linear applications allowingthe computation of the mean, standard deviation, andother descriptive statistics – on 3D shapes.Input shapes are typically given as computational surface meshes (Fig. 4a), which provide point coordinates inspace and describe how those points are connected.Here, surface meshes define the wall of the aorta, for example. As a first step, the meshes need to be transferredinto their currents representation. The resolution of thecurrents, λW, controls to which degree small shape features of the input shapes are included – large λW resultin neglecting small features (Fig. 4b). This becomes particularly useful when it is not desirable to retain smallfeatures extracted from the segmentation, which may becaused by image artefacts or suboptimal registration[21]. Once the resolution λW is set, the template is computed as the average of all currents (Appendix 1).Unique shape features of each subject are captured bycomputing the transformations that deform the templatetowards each subject shape. In order to calculate thesetransformations, a second parameter λV, which controlsthe stiffness of those deformations, is set: large λV resultin “stiffer” (i.e. less elastic) deformations that capturemore global shape features (Fig. 5) [12]. This parametercan be considered as changing the elasticity of the material of the surface models; the more elastic the material, the more the surface models can be manipulated.“forward approach”TemplateFig. 2 Forward approach: Transformations of the template characterise individual subject shapes. The statistical shape analysis method is basedon analysing subject-specific transformations that deform a computed template shape towards each patient shape rather than considering theactual 3D shapes. The transformations are unique for each subject and comprise all relevant shape features that characterise the subject shape
Bruse et al. BMC Medical Imaging (2016) 16:40Page 4 of 19LaserbeamFor example, stretching or deforming a lycra cloth (smallλV) will have a different result compared to stretching aleather cloth (large λV ).After computing the transformations of the template toward each shape present in the population, each subjectshape is uniquely characterised by a multitude of deformation vectors rather than its actual 3D surface. To describethe deformation data with the minimum number of required parameters, a statistical method called partial leastsquare regression (PLS) [12, 22], is employed (Fig. 6a). PLSallows the extraction of shape modes [5], which representthe dominant, most common shape features observed inthe population that are most correlated with a specific parameter of interest (such as a clinical parameter measuredComputationalsurface meshFig. 5 Influence of the stiffness parameter λV. The second parameter tobe set by the user, λV, controls the stiffness or elasticity of thedeformation of the template towards each subject shape. Lowdeformation stiffness values result in too local, unrealistic deformationson the individual patient). Here, shape modes most relatedto body surface area (BSA) and the functional parameterejection fraction (EF) were extracted.Extracted shape patterns described by PLS shape modesare visualised by deforming the computed template shapewith the transformations along the direction of the mode(Fig. 6a). To determine whether the obtained shape patterns are correlated with a response parameter, shapemodes need to be broken down to numbers that allowstatistical analysis. This is achieved by mathematically projecting each subject-specific patient transformation ontoLow resolutioncurrentsrepresentationλW a)LocaldeformationsHigh resolutioncurrentsrepresentationλW Fig. 3 Transferring surface shapes into the space of currents: Analogy to3D laser scanning of objects. Landmarking of the input shapes is avoidedby using mathematical currents as non-parametric shape descriptors thatmodel a specific patient shape as a distribution of shape features.Obtaining a currents representation as a surrogate for the actual3D shape can be compared to probing a surface with a laser beamfrom different angles and positionsb)Fig. 4 Influence of the resolution parameter λW. One parameter to be set by the user is the currents resolution λW, which controls to whichdegree shape features of the input 3D shape given as a computational mesh (a) are included in the shape’s currents representation. High λWvalues neglect small shape features (b)
Bruse et al. BMC Medical Imaging (2016) 16:40Page 5 of 19Subject-specificdeformationvectorsShape Vector 2SDXSSubjectsXSShape Modea) PLSregressionResponse Y-2SDb) Projectionc) Bivariateonto subjectshapescorrelationanalysisFig. 6 Analysing the output using dimensionality reduction techniques and correlation analyses. PLS regression is used to extract shape patternsmost related to a selected response variable as shape modes. Subject-specific deformation vectors, derived from the template computation, constitutethe input. Resulting shape modes can be visualised as 3D shape deformations (a). By projecting shape modes onto each subject shape, subject-specificshape vectors XS can be derived that constitute a numerical representation of the 3D shape features captured by the shape mode (b). XS is correlatedwith the selected response parameter as measured on the subjects in order to determine how strongly shape and response are associated (c). Analysistechniques are marked with dashed linesthe found shape mode [12], which yields the so calledshape vector XS (Fig. 6b). Shape vectors are essentially numerical representations of a specific shape mode. Eachshape vector entry describes in one subject-specific number how much the template has to be deformed along thederived shape mode in order to match the specific subjectshape as well as possible. The shape vector thus represents3D global and regional shape features associated with acertain subject and response parameter. Further standardcorrelation analysis between the shape vector and the response parameter reveals how well subject shape featuresare represented by the derived shape mode (Fig. 6c). Aperfect correlation of shape vector and response wouldimply that the derived shape mode showed exactly thoseshape patterns associated with low or high response values(such as high or low EF) when moving along the shapemode from low to high shape vector values.For mathematical details about the shape modellingprocess as outlined above, we refer to Appendix 1 and thereferenced literature. The entire mathematical frameworkhas been published under the name “exoshape” and is publicly available as a Matlab (The MathWorks, Natick, MA)code [12, 22], /). A similar, open-source code has been recentlypublished in C as “Deformetrica” by Durrleman et al. [23](http://www.deformetrica.org/).The described SSM framework was applied to the CoApatients following the steps as explained in detail in the nextsections (Fig. 7): i) Segmentation of patient CMR images toreconstruct the 3D surface models of the structures of interest; the models and CMR data were also used to computetraditional 2D or 3D morphometric parameters (Fig. 7a); ii)meshing and smoothing of the segmented models to createthe computational input for the template calculation(Fig. 7b); iii) registration of the input shapes; (Fig. 7c) andiv) setting of resolution λW and stiffness λV, which are thecrucial parameters the user needs to provide along with theinput shapes prior to calculating the template.After the template is computed, the following postprocessing analyses are carried out: i) removing confounders such as size differences between subjects prior toextracting shape features related to the functional parameter EF as they can hide potentially important shape features; ii) accounting for outliers and influential subjectsthat are common in clinical data of pathological shapes;iii) validating the template as representing the mean shapeof the population and as being not substantially affected ifany of the shapes that were used to compute it is removedor if a new patient is added iv) analysing associations between extracted shape features (represented by shape vectors as well as by traditional 2D and 3D measuredgeometric parameters) and demographic (BSA) and functionally relevant parameters (EF) via standard bivariatecorrelation analysis (Fig. 6c).Patient population, image data and 2D morphometryCMR imaging data from 20 CoA patients post-repair(16.5 3.1 years, range 11.1 to 20.1 years; CoA repair
Bruse et al. BMC Medical Imaging (2016) 16:40a) SegmentationManual orautomaticPage 6 of 19b) Cutting,Meshing,SmoothingMesh resolutionand smoothingfactorc) AlignmentAutomaticFig. 7 Overview of pre-processing steps prior to shape analysis. Cardiac structures of interest are segmented manually or automatically from 3Dimaging data (a). Segmented models then are cut, appropriately meshed and smoothed in order to remove irrelevant shape variability (b). Beforerunning the shape analysis, the resulting surface models are aligned i.e. rigidly registered in order to reduce bias due to differences in scaling,transformation and rotation (c). User interaction is marked with dashed linesperformed at 4 days to 5 years of age) were included in thestudy. Conventional morphological descriptors for thispopulation were previously reported by our group [24].Three-dimensional volumes of the left ventricle (LV)and the aorta during mid-diastolic rest period were obtained from CMR using a 1.5 T Avanto MR scanner (Siemens Medical Solutions, Erlangen, Germany) with a 3Dbalanced, steady-state free precession (bSSFP), wholeheart, free breathing isotropic data acquisition method(iso-volumetric voxel size 1.5 1.5 1.5 mm) [24]. Ejection fraction (EF) was measured from the CMR data [24].Images were segmented using thresholding and regiongrowing techniques combined with manual editing incommercial software (Mimics, Leuven, Belgium) [24]. Aprevious study comparing physical objects and their respective 3D segmented and reconstructed computermodels found an average operator induced error in theorder of 0.75 mm, which equals about half the voxel sizein our study [25]. In order to reduce irrelevant shape variability, aortas were cut such that only the root, the archand the descending aorta up to the diaphragm were kept.As the focus of this analysis lies on the arch shape, coronary arteries and head and neck vessels were cut as close aspossible to the arch. This is a common pre-processingstep in shape analysis of aortic arches [26–28]. The finalsegmented surface models of the aortas were stored ascomputational surface meshes.Conventional 2D morphometry was carried out manually on CMR imaging data to measure the ratio of aorticarch height (A) and width (T) as well as the ascending anddescending aortic arch diameters (Dasc and Ddesc, respectively) at the level of the pulmonary artery as proposed byOu et al. [17] (Fig. 8a). Diameters at the transverse archlevel (Dtrans) and at the isthmus level (Disth) were measuredmanually as described previously [24].3D shape parameters were computed semi-automaticallyfrom the segmented arch surface models using The Vascular Modeling Toolkit [29] (VMTK, Orobix, Bergamo, Italy;www.vmtk.org) in combination with Matlab. Extracted geometric parameters included volume V and surface areaAsurf, as well as parameters associated with the vessel centreline such as length, curvature and tortuosity [30, 31],and inner vessel diameters along the centreline (minimumDmin, maximum Dmax and median diameters Dmed)(Fig. 8b). Table 1 provides an overview of all geometric parameters that were assessed via correlation analyses. Notethat all measured geometric parameters were indexed topatient body surface area (BSA), where applicable.Pre-processingMeshing and smoothingPreliminary sensitivity analyses were carried out in orderto assess the influence of the meshing, and of the resolution and stiffness parameters (λW, λV) on computationaltime and on the final template shape (Appendix 2). Results showed that template calculation time can be reduced by up to 85 % if an appropriately low meshresolution is chosen - without substantially affecting thefinal template shape. To determine an optimally low, yetsufficient, mesh resolution, we focussed on the smallest
Bruse et al. BMC Medical Imaging (2016) 16:40Page 7 of tuosity andlength of centrelineCentrelineheight ADascDdescwidth TVolume andsurface areaa)b)Fig. 8 Geometric parameters measured in 2D (a) and 3D (b). Geometric parameters such as diameters D and aortic arch height A and width Twere measured manually on 2D CMR image slices according to [17] and [24] (a). 3D parameters were computed semi-automatically using VMTKfor all input shapes (b)subject present in the population of shapes as it defines alower limit for mesh resolution. Starting from the originalsurface model of the smallest subject obtained from segmentation (in this case, subject CoA3), re-meshed surfacemodels were created from low ( 0.3 cells/mm2) to high( 1.5 cells/mm2) mesh resolution in VMTK. To quantifydeviations from the original segmented shape, the surfacearea Asurf of each re-meshed model was measured andcompared to the respective values of the original mesh(Asurf,orig 8825 mm2). Surface area deviations were calculated. A cut-off value for tolerable surface errors waschosen to be 0.5 % compared to the original subject mesh,which was reached for a surface mesh resolution of 0.75cells/mm2. All CoA arch surface models were meshed withthis resolution, using an additional passband smoothing filter to further reduce unnecessary shape variability (Fig. 9a).Alignment of input meshesTo reduce possible bias introduced by misaligned surfacemodels, a two-step approach is proposed. First, each inputshape was aligned (i.e. rigidly registered using translationand rotation only) to an initial reference shape usingTable 1 Morphometric parameters measured on the 3D surfacemodels of the arches2D measured parameters (manually)3D measured parameters (VMTK) Arch height A [mm] Arch width T [mm] Ratio A/T Diameters at ascending, transverse,isthmus and descending level of theaorta: Dasc, Dtrans, Disth, Ddesc [mm] Ratios Dasc/Ddesc, Dtrans/Ddesc andDisth/Ddesc Volume V [mm3] Surface Area Asurf [mm2] Ratio Asurf/V Centreline length LCL [mm] Centreline Tortuosity ToCL Median curvature along centrelineCmed [1/mm] Maximum, minimum and mediandiameter along centreline Dmax,Dmin, Dmed [mm]registration functions based on the iterative closest point(ICP) algorithm available in VMTK [32]. The initial reference shape was determined as the closest shape to thecentre or “mean” of the population (in this case subjectCoA4; Fig. 9a) according to gross geometric parameters(volume V, surface area Asurf, centreline length LCL andmedian diameter along the centreline Dmed). Point-topoint correspondence between the reference meshand respective subject meshes is not necessary as thecorrespondence will be updated at each iteration byfinding the closest point.After computing an initial template shape based on theshapes aligned to the initial reference shape (subjectCoA4), the final alignment of all input meshes was obtained in a second step by adopting a Generalised Procrustes Analysis (GPA) [33] approach in the following manner:1. The input meshes were re-aligned, with the referenceshape this time being the computed template2. A new template based on the newly aligned mesheswas computed3. The model compactness was computed as proposedby Styner et al. [8]4. If the compactness was decreased, the referenceshape was set to the new template and theprocedure continued with step 1, otherwise themeshes were aligned sufficiently.Here, sufficient alignment was obtained after one iteration of the outlined procedure.A priori setting of the resolution and stiffness λ parametersGenerally, it is recommended to set the resolution parameter λW in the order of magnitude of the shape
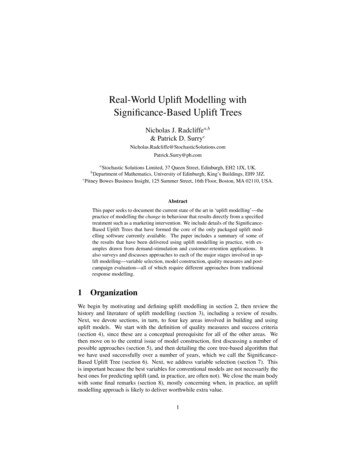
Bruse et al. BMC Medical Imaging (2016) 16:40CoA1CoA8a)CoA15CoA2Page 8 of 12CoA19CoA13CoA20CoA7CoA14b) TemplateFig. 9 Input surface models of the studied patients post-aortic coarctation repair (a) and computed template (b). Computational surface meshes of 20aortic arches constituted the input for the shape analysis (a). Coronary arteries and head and neck vessels were removed prior to analysis (3D rotatablemodels of the arches can be found under -of-3d-anatomies/congenital defects/coarctations). The finaltemplate (mean shape, blue) computed on the entire population (N 20 subjects) shows characteristic shape features associated with CoA such as anarrowing in the transverse and isthmus arch section as well as a slightly dilated aortic root and an overall slightly gothic and tortuous arch shape (b)features to be captured [12]; however, clear indicationfor parameter setting is missing, in particular for thestiffness λV, which cannot be intuitively estimated. Following sensitivity analysis (Appendix 2), λW needs to besmall enough to be able to capture all the features ofinterest, while being large enough to discard noise andto allow efficient template computation.The following approach is proposed to obtain an apriori estimation of a suitable set of λ parameters. Essentially, the shape analysis algorithm deforms a templateshape towards each individual subject shape present inthe population. The quality of the matching of sourceand target shape depends on the setting of the λ parameters. The suggested approach is based on the idea thatthe subject with the most challenging shape features tobe captured defines a lower limit in terms of transformation resolution (λW) and stiffness (λV ) to obtain an appropriate matching. Here we assume this to be thesmallest subject within our shape population. We therefore transformed an initial template towards the smallestsubject shape present in the set of shapes, starting fromcoarse initial values and decreasing both resolution λWand stiffness λV incrementally until a sufficient matchingwas achieved. Note that incorrectly chosen λ parameterswill ultimately result in high matching errors and inunrealistic shape deformations, which can be examinedby the user – visually and numerically. To determinestarting values for λW and λV for computing the initialtemplate, we suggest a “rule of thumb” method, basedon the fact that the λ parameters are inherently associated with probing (λW) or deforming surfaces (λV ). Asboth parameters are given as a length in millimetres,they can be squared to define a plane quadratic surface.With this definition, they are interpreted as a percentageof the surface area to be probed or deformed. Based onthe smallest surface area Asurf,min within the population,λW and λV can be initialised using (Eq. 1) for a given percentage pW or pV, respectively:λW �pW Asurf ;min ;λV ¼ pV Asurf ;minð1ÞFor the resolution λW, our approach can be interpreted as probing pW % of the smallest aorta surfacearea if it was cut open and laid out flat. Note that forlarge aortas the percentage drops below the chosen percentage values as the same parameters are applied to allshape models. Here, we set pW to 2.5 % and pV to 25 %,which yielded an initial λW of 15 mm and a λV of47 mm, with the minimal surface area present in the setof shapes being Asurf,min 8825 mm2. Those values were
Bruse et al. BMC Medical Imaging (2016) 16:40Page 9 of 19used to compute an initial template based on all 20 subjects. The initial template was then transformed towards
mean shape of 20 aortic arches post-aortic coarctation repair (CoA) was computed based on surface models reconstructed from CMR data. By analysing transformations that deform the mean shape towards each of the individual patient's anatomy, shape patterns related to differences in body surface area (BSA) and ejection fraction (EF) were extracted.