Transcription
WHITE PAPERTaqMan Assays Ambient Shipping TaqMan Assays Shipped at Ambient TemperatureReduce Environmental Impact and Retain TheirQuality and StabilityABSTRACTIn order to minimize the adverse environmental impact of packagingand shipping products on dry ice, Life Technologies investigatedthe feasibility of shipping its TaqMan Assay products at ambienttemperature. This report describes stability and performance testingof three classes of assays (TaqMan Gene Expression Assays,TaqMan MicroRNA Assays, and TaqMan SNP Genotyping Assays)after subjecting them to simulated summer ambient shippingconditions. Functional and stability testing demonstrated thatTaqMan Assay products that underwent simulated summer ambientshipping conditions performed as well as assays shipped on dry ice.By shipping at ambient conditions, the need for expanded polystyrene(EPS) coolers and dry ice is eliminated and the fuel consumptionand greenhouse gas emissions from transporting the product aresignificantly reduced.INTRODUCTIONThe adverse environmental impact of shipping refrigerated or frozenproducts is tremendous. The annual carbon footprint to manufacturethe EPS and convert it into coolers for our TaqMan Assay products isapproximately 100 tons (CO2-equivalents). It takes nearly 300 barrelsof crude oil equivalents and 400 MWhr of power annually to make theEPS coolers that are used to ship Life Technologies genomic assayproducts [1]. Additionally, 75,000 liters of water are consumed in themanufacture of the EPS coolers [1]. An average of 7 pounds of dry iceis added to each cooler to ensure the product is delivered frozen toour customers, further increasing the mass and dimensions of eachpackage. Factoring in the number of shipments and average distancetraveled per package and the fact that most packages are shippedvia air, the annual total carbon footprint for transporting frozenoligonucleotides is in excess of 100 tons (CO2-equivalents) [2].Life Technologies has been systematically evaluating novel ways tominimize the impact of shipping products on dry ice, and the CO2footprint left by these products during distribution. One way to achievethis is to ship products at a temperature consistent with its demonstrated stability. By avoiding the cooler and refrigerant, products couldbe shipped in smaller boxes, which improves the carrier’s freightdensity (less fuel and emissions per box) and reduces the amountof packaging materials requiring disposal or recycling. This enablesLife Technologies to eliminate an annual total of nearly 26,000 kg(70,000 ft3) of EPS from landfills and incinerators and replace it withrecyclable corrugated paper packaging. By combining the eliminationof EPS and reduction in impact attributed to transporting the addedweight of the dry ice, we reduce the annual total carbon footprint fromproduct delivery by over 200 tons (CO2-equivalents) [1,2].For many years, TaqMan Assays have been shipped as preformulatedliquid products on dry ice [3]. Extensive accelerated stability studies (4weeks at 37 C) followed by real-time functional testing showed thatTaqMan Assay products are stable for at least 5 years when storedat –20 C. For this reason, the products were shipped under conditions aligned with their long-term stability temperature. Additionalfreeze/thaw stability data have shown that TaqMan Assay productsremain stable for multiple freeze/thaw cycles without compromisingtheir functional performance. This paper describes the results fromfunctional and stability studies carried out after TaqMan Assayproducts were exposed to established summer shipment profiles.These experiments demonstrate that by shipping our TaqMan Assayproducts under ambient conditions, not only can we supply researchers with the same superior quality product they are used to receiving,but we can reduce our environmental footprint in the process. This isa win for our company (eliminating the need for managing cold chaintransport), a win for our customers (minimizing packaging waste),and a win for our planet (reducing resource consumption and totalcarbon footprint).MATERIALS AND METHODSProducts Tested. TaqMan Assays comprise a preformulated set ofunlabeled gene-specific oligonucleotide primers and fluorescent dye–labeled minor groove binding (MGB) probe(s) provided in liquid formin approved Matrix storage tubes. Assays were selected to representthe widest range of performance as well as chemical, sequence, andstructural motifs. In this paper a total of 42 different TaqMan Assayswere subjected to simulated summer ambient shipping conditionsand subsequently measured for physical integrity and functionalperformance. These assays were selected from five product lines thatfell into three representative TaqMan Assay products, based on theirformulations (Table 1).
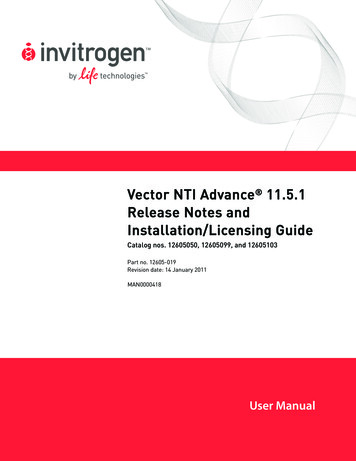
Note: TaqMan Copy Number Assays, CustomTaqMan Copy Number Assays, ncRNA Assays,and pri-miRNA assays were not includedin this testing as the tested assay productswere considered to be similar enough to berepresentative of all product lines. TaqMan CNV Reference Gene and Endogenous Controlkits were not included in this study, but arebeing investigated to “go ambient” in the nearfuture.Creating Replicates. To help eliminatemanufacturing lot variability when creatingthe replicates, individual tubes representingthe various assays were taken from inventorystock, pooled, and aliquoted into Matrixtubes at the same fill volume as specifiedfor the manufactured product. Six replicatetubes and six replicate control tubes wereprepared for each assay, for a total of 252 testsample tubes and 252 control sample tubes(matched replicate sets). The control tubeswere kept at –20 C for the duration of thetesting.Simulated ShippingTemperature Exposure. To simulatetemperatures incurred during shipping,samples were placed in a cycling environmental chamber (temperature andhumidity controlled) programmed toreproduce a “worst-case” 144 hr (6 day)summer temperature profile (sequentiallyran two times for a total of 288 hr) (Figure1), previously established from testingprofiles established at Amgen [4]. This profilemimics temperature extremes encounteredfrom over 2,500 shipments during summermonths between the latitudes of 59.9 northand 37.8 south. Due to a failure in thechamber control system, an additional 3-dayroom temperature ( 25 C) incubation wasadded to the cycle as indicated in the graph(Figure 1) [4]. Samples were exposed to the144 hr temperature cycle twice to accountfor inter-company shipments before beingdelivered to our customers. Testing of winterambient conditions was not considered dueto the extensive, positive historical data onfreeze/thaw and low-temperature stability ofTaqMan Gene Expression and SNP Assays(data not shown).Handling. In addition to the summer ambienttemperature cycle, the products and packaging were subjected to reduced pressuresand drop and vibrational tests as detailedunder International Safe Transit Association(ISTA 3A) simulated performance protocols[5]. To ensure ambient/liquid product willarrive intact, we redesigned the packagingfor orders of 16 tubes or less. To simulate thedamage-producing pressure, motions, andforces typically encountered in the shippingand distribution environment, the packagewas tested according to the ISTA 3A TestProtocol [5].Analytical TestingVolume and Concentration. Volume andconcentration for all test sample tubes weremeasured before and after the ambientshipping simulation. Volume was measuredby gravimetric analysis and concentrationwas measured spectroscopically at OD260.Stability/Integrity. Structural integritychanges in test samples compared to controls was measured by reverse phase HPLC(RP-HPLC). Samples were analyzed using anAgilent HPLC1100 System with a quaternarypump system. HPLC columns used wereTransgenomic OligoSep HC (5.5–6.0 micron,porous, alkylated polymer (DVB), 4.6 x 50mm, P/N NUC-99-3560)). Mobile phasesused were 0.1 M TEAA (triethylamine acetate)in water and 0.1 M TEAA in 75% acetonitrile/25% water.Functional PerformanceTaqMan Gene Expression Assays. Sixtymatched test and control tubes from 10TaqMan Gene Expression Assays (20Xformulation) and 36 matched test and controltubes from 6 TaqMan Gene ExpressionAssays (60X formulation) were functionallytested. Reactions were set up followingthe standard product protocol for a 20 μLreaction volume with 4 replicates for eachtube. Ten nanograms of cDNA synthesizedfrom Universal Human RNA (Stratagene)was used as the template for all reactions.PCR reactions were conducted with TaqMan Universal PCR Master Mix (P/N 4304437)and run on a 7900HT Real-Time PCR Systemusing universal cycling conditions (95 C, 10min; 95 C, 15 sec; 60 C, 1 min for 40 cycles).SDS 2.3 software was used to generatethe amplification plots and determine Ctvalues (autobaseline; threshold set at 0.2). Ctvariability and no-template control (NTC) Ctvalues were calculated using JMP 8 statistical software.TaqMan MicroRNA Assays. Thirty-sixmatched test and control sample tubesfrom 6 TaqMan MicroRNA Assays wereprocessed. The RT step was performed usinga TaqMan MicroRNA Reverse TranscriptionKit (P/N 4366596). TaqMan Universal PCRMaster Mix, No UNG was used for qPCR (P/N4304437). A mixture of 5 ng each HumanBrain and Human Lung Total RNA (Ambion )was used as the template in 15 μL RT reactions. The RT reaction products were used in10 μL PCR reactions at a final dilution of 1:15.qPCR reactions were run, with 4 replicatesfor each assay tube, on a 7900HT Real-TimePCR System using universal cycling conditions (95 C, 10 min; 95 C, 15 sec; 60 C, 1 minfor 40 cycles). SDS 2.3 software was used togenerate the amplification plots and determine Ct values (autobaseline; threshold setat 0.2). Ct and NTC variability was calculatedusing JMP 8 statistical software.Figure 1. 144-Hr Summer Temperature Profile Used to Simulate Shipping Temperatures. The summer temperature profile was used to mimic average high temperature extremes between the latitudes of 59.9 north and37.8 south (profile derived from the Amgen protocol as described). A controller failure induced a 3-day increasein exposure to normal room temperatures, further increasing the stringency of the challenge.
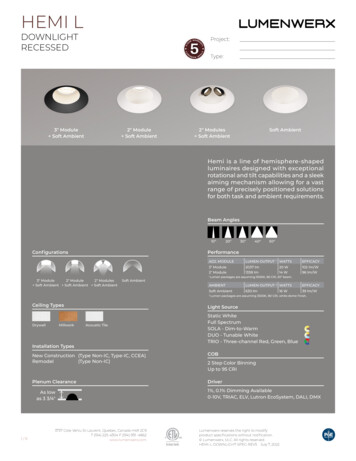
TaqMan DME and SNP Genotyping Assays.Matched test and control samples wereprocessed for 10 TaqMan Drug Metabolism(DME) Genotyping Assays (20X formulation)and 10 TaqMan SNP Genotyping Assays(80X formulation). The SNP assays werediluted to 20X working stock solutions withTE before use. TaqMan DME and SNPGenotyping Assays were performed followingthe manufacturer’s recommended protocol.Templates for these tests consisted of 20distinct genomic DNA samples (Coriell CellRepositories, www.coriell.org/ccr/ccrsumm.html), containing homozygous and heterozygous targets for all assays tested. The DNAswere normalized, dispensed onto 384-wellplates, and dried down. NTC reactions wereincluded. Reaction mixes were prepared for10 μL reactions using TaqMan UniversalPCR Master Mix, No UNG. PCR wasperformed using the GeneAmp PCR System9700. SNP PCR was run using universalcycling conditions while DME PCR was runusing more PCR cycles and longer extensiontime (50 cycles x 90 seconds). Endpoint datawere collected using the Applied Biosystems 7900HT Real-Time PCR System. FAM dye,VIC dye, and FAM :VIC dye Rn ratios andallelic discrimination (cluster) plots weregenerated using SDS 2.3 software. JMP 8software was used to calculate variability forboth Rn-NTC and FAM and VIC Rn ratios.Statistical Analysis. The number of replicatetubes for each assay (test and control) waspredetermined by the sample size calculatorof JMP 8 software using prior functional performance data with α 0.01 and power 0.99.For each of the selected assays, 12 tubeswere combined and split back into 12 tubes(6 control and 6 test samples). Each assaywas run with 6 replicates for control and 6replicates for test (12 tubes for each assay)as predetermined by JMP 8 software. For theqPCR run, each tube was run with 4 technicalreplicates, thus each control assay and testassay had 24 data points. We used the SASJMP statistical package to test for significantdifferences between test and control assays.For TaqMan Gene Expression and MicroRNAAssays, Ct variability and NTC Ct values wereanalyzed. Variability for both Rn-NTC andFAM :VIC Rn ratios were calculated forTaqMan DME and SNP Genotyping Assays.RESULTSAnalytical TestingVolume and Concentration. Negligibledifferences were observed for both volumeTable 1. TaqMan Assays Tested.DescriptionPartNumberConcentrationNumber ofAssaysTaqMan Gene ExpressionAssays, inventoried2 oligonucleotide primers1 MGB probe with FAM dye*433118220X10Custom TaqMan GeneExpression Assays, large scale2 oligonucleotide primers1 MGB probe with FAM dye*433207960X61 oligonucleotide primer†2 oligonucleotide primers1 MGB probe with FAM dye*44279755X20X6Product1. TaqMan Gene Expression Assays 2. TaqMan MicroRNA AssaysTaqMan MicroRNA Assays3. TaqMan SNP Genotyping AssaysTaqMan Drug MetabolismGenotyping Assays2 oligonucleotide primers1 MGB probe with FAM dye‡1 MGB probe with VIC dye‡436269120X10TaqMan SNP GenotypingAssays, large scale2 oligonucleotide primers1 MGB probe with FAM dye‡1 MGB probe with VIC dye‡435137480X10* TaqMan minor groove binding (MGB) probe with FAM dye.† TaqMan MicroRNA Assays consist of a reverse transcription (RT) primer and TaqMan Assay. This is theoligonucleotide primer for priming the RT step.‡ Allele-specific TaqMan MGB probes with distinct dyes for detecting the alleles for the specific polymorphismof interest; VIC dye is linked to the 5 end of the Allele 1 probe, and FAM dye is linked to the 5 end of Allele 2probe.and concentration (data not shown).Stability/Integrity. RP-HPLC was used tocreate peak profiles of the oligonucleotideTaqMan Assay components (FAM and VIC dye-labeled MGB probe oligonucleotides andunlabeled oligonucleotide primers) using UV/VIS absorbance detection. Forty-two matchedtest and control tubes, representing samplesfrom all assays, were analyzed. An exampleof the data is shown in Figure 2. Test andcontrol peak profiles were compared. TestAmbient Shipped SamplePanel A.samples were judged as identical to matchedcontrols (no degradation). For this study, thecomparisons of all 42 test samples analyzedwere shown to be identical to their matchedcontrols, confirming that the simulatedsummer ambient shipping protocol did notaffect product integrity.Functional PerformanceTaqMan Gene Expression Assays.Functional performance for both types ofControl SamplePanel B.Figure 2. Simulated Summer Ambient Shipping Does Not Affect Oligonucleotide Stability—RepresentativeData. The effect of simulated summer ambient shipping on oligonulceotide integrity was measured by comparingRP-HPLC profiles of paired test and control samples. The HPLC chromatogram profiles of the testing samplesare comparable to the profiles of the control samples. There was no indication of probe or primer degradationin the ambient-shipped SNP assay C 1305119 10 (A) compared to its matched control (B).
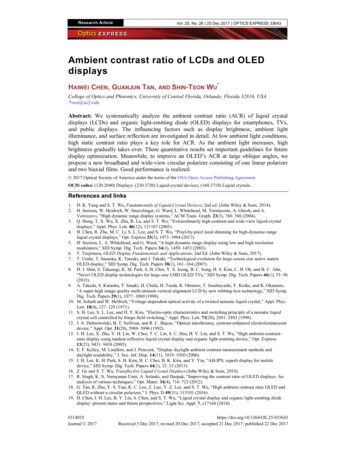
Panel A.Panel B.Assay IDMean Difference(Ct)pValuePass/FailHs01374556 m1–0.010.2357PassFigure 3. TaqMan Gene Expression Assay (60X). The effect of simulated summer ambient shipping on assayfunctional performance was evaluated by performing real-time qPCR of paired test and control samples. AssayID: Hs01374556 m1. (A) Amplification plot for control sample stored at –20 C (blue, n 24). (B) Amplificationplots for ambient test sample (green, n 24) overlaid with control sample (blue, n 24). The table below the plotshows the mean difference between the average Ct of 24 samples (6 control and test tubes, 4 qPCR replicates ofeach tube). The box plot and circle plot show the distribution of the C t values and a visual display of the resultsof the variance analysis (student’s t-test).Panel A.Panel B.Assay IDMean Difference (Ct)p ValuePass/Fail3910.04 .0070PassFigure 4. TaqMan MicroRNA Assay. The effect of simulated summer ambient shipping on assay functional performance was evaluated by performing real-time qPCR followed by RT-PCR of paired test and control samples.Assay ID: 391. (A) Amplification plot for control sample stored at –20 C (blue, n 24). (B) Amplification plots forambient test sample (green, n 24) overlaid with control sample (blue, n 24). The table below the plot showsthe mean difference between the average Ct of 24 samples (6 control and test tubes, 4 qPCR replicates of eachtube). The box plot and circle plot show the distribution of the Ct values and a visual display of the results of thevariance analysis (student’s t-test).TaqMan Gene Expression Assays, at 20Xand 60X concentration, was assessed byfunctional analysis of qPCR amplificationresults. A statistical evaluation of Ct variabilityand Ct value for the NTC test was performedbetween the test and control assays. All60 matched test and control sample tubesfrom the 10 TaqMan Gene ExpressionAssays and all 36 matched test and controlsets from the 6 TaqMan Gene ExpressionAssays were tested. Representative resultsfor matched pairs (test and control) areshown in Figure 3, with results for all assaysprovided in Appendix 1 and 2. The datashowed that the functional performance asmeasured by Ct value is equivalent betweenambient-shipped assays and control assaysfor both TaqMan Gene Expression productstested. All 20X formulated assays showed nostatistical difference (p 0.05) (Figure 3). Inaddition, the mean difference in Ct betweenthe test and control was 0.1 for all assaystested. Two of the 60X formulated assayshad p 0.05; however, the mean differencebetween the test and control tubes was 0.15.The NTC testing showed that all assay tubes,control and test, showed Ct 38.TaqMan MicroRNA Assays. Functional performance for TaqMan MicroRNA Assays wasassessed by qPCR followed by calculation ofCt variability and Ct value for the NTC. Thesetests also included an RT step prior to PCRamplification (to test the RT primer includedin these assay products). Representativeresults (matched test and control pairs) areshown in Figure 4, with results for all assaysprovided in Appendix 3. The data showedthat the functional performance is equivalentbetween ambient-shipped samples andcontrol samples for MicroRNA Assaysas measured by the Ct value. Two assaysshowed statistical differences (p 0.05);however, the mean differences between testand control Ct are less than 0.2. NTC for alltubes tested gave Ct 38.Amplification plots from test and controlassay tubes for TaqMan Gene ExpressionAssays and TaqMan MicroRNA Assaysdisplayed identical profiles, and whenoverlayed were indistinguishable.TaqMan SNP and TaqMan DME GenotypingAssays. Functional performance forTaqMan Genotyping Assays was assessedby measuring the difference in the endpoint ΔRn (Rn-NTC) value between the test
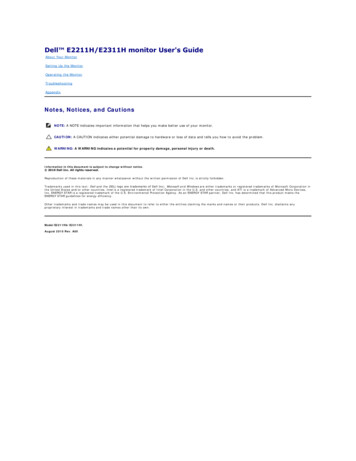
versus control sample tubes for FAM - andVIC -labeled probes averaged across the20 gDNA samples. The FAM :VIC Rn ratiowas also calculated. All 60 matched pairs oftest and control samples for both productswere assayed. Representative results for 4assays from each (matched test and controlpairs) are shown in Figures 5 and 6, withresults for all assays provided in Appendix4 and 5. Comparison of ΔRn and FAM :Vic Rn ratios showed that most assays had nostatistical difference between the test andcontrol for these measurements. Only afew assays showed a difference (p 0.05) forΔRn; however, the mean difference betweencontrol and test for DME assays was lessthan 5% and for SNP Genotyping Assays wasless than 3%.Cluster plots for the test and control assaysfor DME and SNP assays were plottedtogether. The profiles were very similar,showing good clusters, and the test assayswere indistinguishable from the control.FAM , VIC , and FAM :VIC clusters werewell separated and clearly defined forboth test and control samples (Figure 6).In addition, there was no difference in thegenotyping calls.CONCLUSIONSThe data described in this paper demonstratethat ambient shipping of TaqMan GeneExpression Assay, TaqMan MicroRNAAssay, TaqMan DME Genotyping Assay, andTaqMan SNP Genotyping Assay productshas no effect on their quality, integrity, andfunctional performance.After eliminating factors such asmanufacturing lot variability by poolingand re-splitting samples, analytical testing (including measurements of volume,concentration, and purity) showed that thesamples were not impacted when shippedunder simulated summer ambient shippingconditions.functional assays compared test and controlamplification plots, Ct variability, and NTC Ctvalues. All of the test samples were essentially identical to the control samples and fellwithin specifications for these parameters.Likewise, functional data consisting ofcluster plots, Rn variability, and FAM :VIC Rn ratios for the test sample tubes comparedto control sample tubes from TaqMan DMEand SNP Genotyping Assay products also fellwell within performance specifications forthese parameters.We will no longer be shipping in EPS (alsoknown as Styrofoam ) coolers, and dry ice isno longer needed. Thus, external packagingwill be reduced in size by over 92%. Fororders comprising 16 tubes or less we willbe using a recyclable plastic holder; orders17 and larger will continue to be shipped inMatrix racks. The ambient packaging, fromthe corrugate outer box to the plastic andpaper containers, are fully recyclable.The results presented here validate thechange to ambient shipping, and provide theresearcher confidence that when shippedambient, TaqMan Assays will exhibit nostatistically significant difference in functionor stability compared to dry ice–shippedproducts. In addition to ensuring ourcustomers will continue to receive thehighest quality possible, this study enablesus to significantly reduce the environmentalimpact of transport of these products. LifeTechnologies’ consumption of non-renewableraw materials will decrease by over 300 barrel equivalents of oil every year and reduceour water utilization by over 75,000 liters. Ourcustomers will see a reduction of 26,000 kg(76,000 ft3) of EPS waste. Our planet willsee a reduction of CO2 emissions by over200 tons every year. Finally, the packagingused to deliver the products, from thecorrugate outer box to the plastic and papercontainers, are fully recyclable. Please reusethe containers when possible and, when youcannot reuse, please recycle.Figure 5. TaqMan DME Assay (20X). The effect ofsimulated summer ambient shipping on assay functionalperformance was evaluated by performing PCR on pairedtest and control samples. Assay ID: C 7817764 10.The red, dark blue, and green dots in this overlaid clusterplot represent data points from the control samples forAllele X, Allele Y, and heterozygote XY genotypes, respectively. The test samples are shown as the turquoise dotsfor corresponding Allele X, Allele Y, and heterozygote XYgenotype clusters.For the TaqMan Gene Expression Assayand TaqMan MicroRNA Assay products,Figure 6. TaqMan SNP Assay (80X). The effectof simulated summer ambient shipping on assayfunctional performance was evaluated by performingPCR on paired test and control samples. Assay ID:C 3084793 20. The red, dark blue, and green dotsin this overlaid cluster plot represent data points fromthe control samples for Allele X, Allele Y, and heterozygote XY genotypes, respectively. The test samples areshown as the turquoise dots for corresponding AlleleX, Allele Y, and heterozygote XY genotype clusters.
Appendix 1: TaqMan Gene Expression Assays (20X). Statistical comparison of the functional performance.TaqMan Gene ExpressionAssay (20X)Mean Difference (Ct)p ValueHs99999901 m10.050.157Hs99999905 m10.030.040Hs00609297 m10.030.114Hs99999910 m10.030.068Hs99999908 m10.010.480Variance Analysis
Appendix 1: continuedTaqMan Gene ExpressionAssay (20X)Mean Difference (Ct)p ValueHs99999904 m1–0.060.02Hs00157244 m10.010.374Hs00192574 m10.020.135Hs00237047 m10.020.518Hs00156385 m1–0.070.153Variance Analysis
Appendix 2: TaqMan Gene Expression Assays (60X). Statistical comparison of functional performance.TaqMan Gene ExpressionAssay (60X)Mean Difference (Ct)p ValueHs01374556 m1-0.010.236Hs03454268 m1–0.060.229Hs03454539 m1–0.150.147Hs03454556 s10.110.009Hs00940773 s10.080.001Variance Analysis
Appendix 3: TaqMan MicroRNA Assays. Statistical comparison of functional performance.TaqMan Micro RNA AssayMean Difference (Ct)p value3770.14 .00013910.04 .00703970.030.1684030.16 .00014500.000.7584910.040.150Variance Analysis
Appendix 4: TaqMan DME Genotyping Assays. Statistical comparison of Rn values.DME FAM anDifferencep ValueC 287260 10363.970.193.850.18–0.120.007C 1823316 20963.640.193.550.20–0.090.001C 2461184 2063.530.083.420.08–0.110.041C 7817764 10183.350.223.330.20–0.020.745C 7817765 6061.930.061.870.06–0.060.119C 26236594 10124.070.123.990.12–0.080.104C 26823969 10182.090.082.000.07–0.090.001Assay Variance
Appendix 4: continuedDME FAM anDifferencep ValueC 27102414 10424.980.194.790.14–0.190.000C 32449742 20425.240.215.070.23–0.170.001Assay VarianceDME VIC anDifferencep ValueC 287260 10182.030.061.980.06–0.050.038C 1823316 20122.540.062.510.05–0.030.200C 2461184 20302.490.052.440.04–0.050.000C 26236594 10662.560.092.530.08–0.030.101C 27102414 10242.630.052.560.03–0.070.000Assay Variance
Appendix 4: continuedDME VIC anDifferencep ValueC 32449742 20192.620.062.560.09–0.060.027C 26823969 10721.830.061.750.06–0.080.000C 7817764 10721.740.061.710.07–0.030.022C 7817765 60661.180.071.150.06–0.030.013C 27102431 AmbientSDControlMeanControlSDMeanDifferencep ValueC 287260 10661.760.071.740.09–0.020.274C 1823316 20121.300.031.300.050.000.801C 2461184 20841.300.051.290.04–0.010.122Assay VarianceDME FAM/VIC Rn RatioAssay Variance
Appendix 4: continuedDME FAM/VIC Rn DMeanDifferencep ValueC 26236594 10421.340.071.340.050.000.727C 27102414 entSDControlMeanControlSDMeanDifferencep ValueC 32449742 20601.950.071.940.08–0.010.880C 26823969 10301.330.071.330.060.000.929C 7817764 10302.250.072.270.100.020.586C 7817765 60481.850.071.850.050.000.882C 27102431 D0182.630.202.630.220.000.990Assay VarianceDME FAM/VIC Rn RatioAssay Variance
Appendix 5: TaqMan SNP Genotyping Assays. Statistical comparison of Rn values.VA SNP FAM anDifferencep ValueC 1305119 10603.060.113.030.15–0.030.266C 1202883 20302.570.112.540.13–0.030.355C 1305007 10363.320.173.270.19–0.050.194C 27004199 bientSDControlMeanControlSDMeanDifferenceP-ValueC 11738050 1063.430.153.380.16–0.050.583C 8726802 201203.650.233.730.200.080.003C 3084793 20785.780.225.630.22–0.150.000Assay VarianceVA SNP FAM RnAssay Variance
Appendix 5: continuedVA SNP VIC anDifferencep ValueC 2292799 10721.780.171.810.080.030.196C 2292797 20721.700.091.730.090.030.022C 1305119 1061.590.031.560.04–0.030.296C 1305007 10301.490.131.480.12–0.010.772C 27004199 10421.730.061.690.05–0.040.002Assay VarianceVA SNP VIC anDifferencep ValueC 11738050 10602.160.072.130.09-0.030.120C 3084793 2062.370.062.340.07-0.030.429Assay Variance
Appendix 5: continuedVA SNP VIC anDifferencep ValueC 1202883 20721.210.071.210.070.000.458C 29347861 10782.260.062.230.06–0.030.002Assay VarianceVA SNP FAM/VIC Rn DMeanDifferencep ValueC 1305119 10542.010.102.000.08–0.010.488C 1305007 10542.390.092.390.090.000.824C 27004199 10721.660.071.670.060.010.700C 11738050 10541.640.081.660.080.020.262Assay Variance
Appendix 5: continuedVA SNP FAM/VIC Rn DMeanDifferencep ValueC 3084793 20362.730.162.700.14–0.030.399C 1202883 20182.360.092.370.070.010.703C 29347861 10421.550.041.540.04–0.010.097Assay Variance
NOTES
NOTES
AuthorsHsin-Ru Chang, Jay Crespo, Kathy Lee, Kathleen McGall, Susan MacWhorter, Paul Russell, Jeff Schatz, Donna Seid, Criss Walworth, Joe YuREFERENCES1. Data produced using Compass Comparative Packaging Assessment online software tool (v. 1.1) (https://www.design-compass.org/)2. Reference data derived from U.S. EPA, Climate Leaders, Greenhouse Gas Inventory Protocol Core Module Guidance (Optional EmissionsFrom Commuting, Business Travel and Product Transport)3. Product Stability Study: TaqMan Gene Expression Assays. Publication number: 127WP03-01 /index.htm?xDoD 114115)4. Cowland R (2007) Developing ISTA Cold Chain Environmental Standards. Paper presented at the Dimensions.07 Conference, Orlando,Florida (www.ista.org/forms/COWLAND RAY Dimensions07.pdf)5. ISTA ISTA 3A-2008 Test Protocol: http://www.ista.org/forms/3Aoverview.pdfFor Research Use Only. Not for use in diagnostic procedures.The trademarks mentioned herein are the property of Life Technologies Corporation or their respective owners. TaqMan is a registered trademark of Roche Molecular Systems, Inc. Allother trademarks are the sole property of their respective owners. 2010 Life Technologies Corporation. All rights reserved. Printed in the USA. Publication O-090071 0410Headquarters850 Lincoln Centre Drive Foster City, CA 94404 USAPhone 650.638.5800 Toll Free 800.327.3002www.appliedbiosystems.comInternational SalesFor our office locations please call the divisionheadquarter
mimics temperature extremes encountered from over 2,500 shipments during summer months between the latitudes of 59.9 north and 37.8 south. Due to a failure in the chamber control system, an additional 3-day room temperature ( 25 C) incubation was added to the cycle as indicated in the graph (Figure 1) [4]. Samples were exposed to the