Transcription
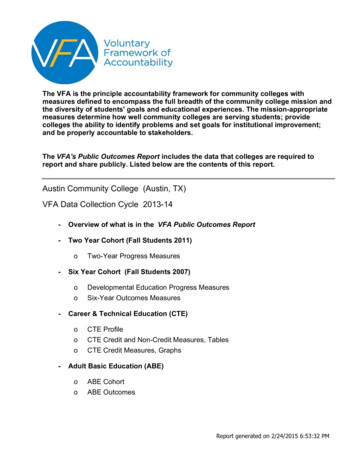
The VFA is the principle accountability framework for community colleges withmeasures defined to encompass the full breadth of the community college mission andthe diversity of students' goals and educational experiences. The mission-appropriatemeasures determine how well community colleges are serving students; providecolleges the ability to identify problems and set goals for institutional improvement;and be properly accountable to stakeholders.The VFA's Public Outcomes Report includes the data that colleges are required toreport and share publicly. Listed below are the contents of this report.Austin Community College (Austin, TX)VFA Data Collection Cycle 2013-14-Overview of what is in the VFA Public Outcomes Report-Two Year Cohort (Fall Students 2011)o-Six Year Cohort (Fall Students 2007)oo-Developmental Education Progress MeasuresSix-Year Outcomes MeasuresCareer & Technical Education (CTE)ooo-Two-Year Progress MeasuresCTE ProfileCTE Credit and Non-Credit Measures, TablesCTE Credit Measures, GraphsAdult Basic Education (ABE)ooABE CohortABE OutcomesReport generated on 2/24/2015 6:53:32 PM
Overview of what is in the VFA Public Outcomes ReportSTUDENT PROGRESS & OUTCOMES (SPO)SPO TimeframesThe SPO measures are reportedfor students from two timeframes: TWO YEARStudents that entered thecollege two years ago (fall 2011)and their progress /attainment bythe end of those two yearsColleges are required to reportthe TWO-YEAR PROGRESSMEASURES for the students thatentered two years agoSPO: DEVELOPMENTAL EDUCATION PROGRESS MEASURESDevelopmental Subjects: math, English, reading Distribution of developmental need (1, 2, or 3 levels below college level in subject)Of the students with developmental need in a subject, the number who: Attempted any developmental education in subject Completed developmental education in subject Completed a college-level course in subjectAny Developmental (non-subject) Enrolled in any developmental Completed all developmental (and are college-ready) SIX YEARStudents that entered thecollege six years ago (fall 2007)and their progress and outcomesby the end of those six yearsColleges are required to reportthe DEVELOPMENTAL EDUCATIONand SIX-YEAR OUTCOMESMEASURES for the students thatentered six years agoSPO: TWO-YEAR PROGRESS MEASURES Retention: fall to next term Successful completion of credits: 1st term; by end of year two# of total credits completed with a C grade (C-, C ) or better by the cohort Reached credit threshold by end of year two# of students in the cohort that earned 24 credits (part-time) or 42 credits (full-time) Persistence/attainment: completed certificate/degree; transferred; still enrolledSPO Student Cohort TypesColleges are also required toreport the SPO measures forthree types of student groups:A. Main CohortFall entering students who arefirst time at the reporting collegeSPO: SIX-YEAR OUTCOMES MEASURES (unduplicated; hierarchical)B. Credential SeekingStudents in the Main Cohort whoearned 12 credits by the end oftheir first two years Completed certificate, associates, or bachelor’s degree (with and without transfer) Transfer (no award) Persistence: still enrolled Left with or to 30 credits; left with 30 creditsC. First Time in CollegeStudents in the Main Cohort whoare first time in collegeCAREER & TECHNICAL EDUCATION (CTE)CTE ProfileCTE Measures & CohortReports on the post-collegiateoutcomes of students thatcompleted credit or non-creditCTE or had a significant CTEexperience at the collegeCTE profile of the college CTE Enrollment (credit and non-credit); change over previous year CTE Completions (credit and non-credit); change over previous yearCTE student outcomes post CTE (credit and non-credit) Completed CTE certificate or degree Employed (with wage bands) Median wage growth of CTE students post CTE Enrolled post-CTE in higher education Passed licensure exam Completed industry credential(s)ADULT BASIC EDUCATION (ABE)Reports on the completion ofABE and post-ABE outcomes ofstudents that took ABE at thecollege in a given year Completed ABEEnrolled in more education post ABEGained employment post ABEReport generated on 2/24/2015 6:53:32 PM
Austin Community College (Austin, TX)Two Year Cohort (Fall Students 2011)These data represent students that first entered the college in Fall Students 2011 (or summer before) and their progress by the end of their first two years.Two-Year Progress MeasuresCohort TypesDifferent types of studentsProgress by End of Year Two by Cohort Type100.0%A. Main Cohort: fall entering, first timeat reporting college; “all %40.0%71.9%60.3%59.3%B. Credential Seeking: earned 12credits by end of year two63.6%36.1%31.0%C. First Time in College: fall entering,first time in college20.0%0.0%Main CohortCredential Seeking*Students could be in more than onecohort type.First Time in CollegeTwo-Year Progress MeasuresPersistence/Attainment Outcomes by End of Year Two by Cohort TypeCohortTypeMain CohortCredential SeekingFirst Time in College0%20%40%60%80%100%Completed edentialSeeking3.3%27.5%69.2%First Timein College0.7%18.7%80.6%These measures report milestonesalong the educational pathway andpersistence/attainment outcomes bythe end of a student’s first two years atthe college.The persistence/attainment outcomesby the end of year two provide an earlyindicator of the cohort’s performance.These outcomes are not exhaustiveand will not sum to 100% of thestudents in the cohort. The outcomesare:-UnduplicatedHierarchicalAchieved by the end of twoyearsCredentials earned at thereporting collegeReport generated on 2/24/2015 6:53:32 PM
Austin Community College (Austin, TX)Six Year Cohort (Fall Students 2007)These data represent students that first entered the college in Fall Students 2007 (or summer before) and their progress and outcomes by the end of six years.Developmental MathCohort TypesDifferent types of studentsDevelopmental Need in Math by Cohort TypeMain CohortCredential SeekingFirst Time in CollegeA. Main Cohort: fall entering, first timeat reporting college; “all students”B. Credential Seeking: earned 12credits by end of year two61.0%74.0%75.4%C. First Time in College: fall entering,first time in college12.1%*Students could be in more than onecohort type.12.5%18.7%0.0%12.1%13.9%20.3%Developmental Math Need*Percent of students in cohort that werereferred/placed into developmentalmathDevelopmental Outcomes for Students Referred to Dev. Math by Cohort TypeAttempted Dev CourseCompleted Highest Dev CourseCompleted College CourseDevelopmental need is broken downfurther into three levels of need, belowcollege level.Developmental Math NeedMain Cohort79.7%CredentialSeeking24.1%84.5%First Time 3%0%20%40%These outcomes answer the question:– What percentage of students in thecohort type that neededdevelopmental math – completeddevelopmental math and progressedto successfully complete a college-levelcourse in math?13.9%60%80%100%0%20%*The method of identifying students with a developmental need is "By Placement/Referral".40%60%80%100%Report generated on 2/24/2015 6:53:32 PM
Austin Community College (Austin, TX)Six Year Cohort (Fall Students 2007)These data represent students that first entered the college in Fall Students 2007 (or summer before) and their progress and outcomes by the end of six years.Developmental EnglishCohort TypesDifferent types of studentsDevelopmental Need in English by Cohort TypeMain CohortCredential SeekingFirst Time in CollegeA. Main Cohort: fall entering, first timeat reporting college; “all students”B. Credential Seeking: earned 12credits by end of year two92.8%88.9%93.2%2.1%4.5%0.7%2.3%3.9%0.6%C. First Time in College: fall entering,first time in college2.9%7.7%*Students could be in more than onecohort type.0.5%Developmental English Need*Percent of students in cohort that werereferred/placed into developmentalEnglishDevelopmental Outcomes for Students Referred to Dev. English by Cohort TypeAttempted Dev CourseCompleted Highest Dev CourseCompleted College CourseDevelopmental need is broken downfurther into three levels of need, belowcollege level.Developmental English Outcomes53.0%Main CohortCredentialSeeking53.6%First Time inCollege20%40%60%80%29.9%22.4%100%0%20%40%These outcomes answer the question:– What percentage of students in thecohort type that neededdevelopmental English – completeddevelopmental English and progressedto successfully complete a college-levelcourse in *The method of identifying students with a developmental need is "By Placement/Referral".40%60%80%100%Report generated on 2/24/2015 6:53:32 PM
Austin Community College (Austin, TX)Six Year Cohort (Fall Students 2007)These data represent students that first entered the college in Fall Students 2007 (or summer before) and their progress and outcomes by the end of six years.Developmental ReadingCohort TypesDifferent types of studentsDevelopmental Need in Reading by Cohort TypeMain CohortCredential SeekingFirst Time in CollegeA. Main Cohort: fall entering, first timeat reporting college; “all students”B. Credential Seeking: earned 12credits by end of year two80.8%88.4%88.9%C. First Time in College: fall entering,first time in college6.0%6.3%10.7%3.8%1.4%3.8%1.5%*Students could be in more than onecohort type.6.4%2.0%Developmental Reading Need*Percent of students in cohort that werereferred/placed into developmentalReadingDevelopmental Outcomes for Students Referred to Dev. Reading by Cohort TypeAttempted Dev CourseCompleted Highest Dev CourseCompleted College CourseDevelopmental need is broken downfurther into three levels of need, belowcollege level.Developmental Reading OutcomesMain Cohort62.4%CredentialSeeking60.0%First Time inCollege20%40%60%80%Measure Not Applicable0.0%49.6%100%0%20%40%60%These outcomes answer the question:– What percentage of students in thecohort type that neededdevelopmental Reading – completeddevelopmental Reading and progressedto successfully complete a college-levelcourse in Reading?Measure Not Applicable0.0%55.8%74.1%0%0.0%Measure Not Applicable41.1%80%100%0%20%*The method of identifying students with a developmental need is "By Placement/Referral".40%60%80%100%Report generated on 2/24/2015 6:53:32 PM
Austin Community College (Austin, TX)Six Year Cohort (Fall Students 2007)These data represent students that first entered the college in Fall Students 2007 (or summer before) and their progress and outcomes by the end of six years.Developmental Outcomes across Subjects by Cohort TypeMain CohortAttempted Dev CourseCompleted Highest Dev 0% 0%20%40%60%B. Credential Seeking: earned 12credits by end of year twoMeasure Not empted Dev CourseMathCompleted Highest Dev Course84.5%20%40%60%80%52.7%Measure Not Applicable0.0%55.8%100% 0%20%40%Developmental Outcomes by Subject25.5%30.2%60.0%0%Completed College %First Time in College CohortAttempted Dev CourseCompleted Highest Dev Course89.4%Math62.8%English20%40%60%80%Completed College Course29.3%13.9%22.4%74.1%Reading0%C. First Time in College: fall entering,first time in college*Students could be in more than onecohort type.Credential Seeking CohortEnglishCohort TypesDifferent types of studentsA. Main Cohort: fall entering, first timeat reporting college; “all students”12.7%17.9%62.4%ReadingCompleted College Course20%40%This view of the data shows howstudents that are classified by a specificcohort type progress through andcomplete developmental education.29.9%0.0%Measure Not Applicable49.6%100% 0%These outcomes answer the question: –What percentage of students in thecohort type that neededdevelopmental education in a subject– completed developmental educationin that subject and progressed tosuccessfully complete a college-levelcourse in the subject?60%80%100%0%20%40%60%80%100%Report generated on 2/24/2015 6:53:32 PM
Austin Community College (Austin, TX)Six Year Cohort (Fall Students 2007)These data represent students that first entered the college in Fall Students 2007 (or summer before) and their progress and outcomes by the end of six years.Any DevelopmentalAny Developmental Need by Cohort TypeCohort TypesDifferent types of students100%A. Main Cohort: fall entering, first timeat reporting college; “all students”80%60%40%47.2%28.7%28.6%Main CohortCredential Seeking20%0%First Time in College80%84.1%85.1%C. First Time in College: fall entering,first time in college*Students could be in more than onecohort type.Attempted at Least One Developmental Course by Cohort Type100%B. Credential Seeking: earned 12credits by end of year two90.0%Any Developmental60%40%20%0%Main CohortCredential SeekingFirst Time in CollegeStudents represented by these dataneeded developmental education inmath, English, reading, or anycombination of these subjects. This isan unduplicated count of the students ineach of the cohorts that were notcollege ready (needed developmentaleducation).Completed All Developmental Education by Cohort Type100%80%60%40%55.0%34.9%33.3%20%0%Main CohortCredential SeekingFirst Time in CollegeReport generated on 2/24/2015 6:53:32 PM
Austin Community College (Austin, TX)Six Year Cohort (Fall Students 2007)These data represent students that first entered the college in Fall Students 2007 (or summer before) and their progress by the end of six years.Six-Year OutcomesOutcomes by the end of Six Years by Cohort TypeCohort TypesDifferent types of studentsA. Main Cohort: fall entering, first timeat reporting college; “all students”Main CohortB. Credential Seeking: earned 12credits by end of year twoC. First Time in College: fall entering,first time in collegeCredential Seeking*Students could be in more than onecohort type.First Time in College0%20%40%60%80%100%Six-Year Outcomes MeasuresOutcomesBachelor'sMain CohortCredential SeekingFirst Time in CollegeN/AN/AN/AAssociate (Transfer)1.6%3.4%1.4%Associate (No Transfer)3.6%7.3%3.8%Certificate (Transfer)0.2%0.4%0.2%Certificate (No Transfer)1.2%2.1%1.0%No Award (Transfer)45.3%46.0%33.2%Still Enrolled9.8%12.0%13.2%Left ( 30 Credits)0.0%0.0%0.0%38.3%28.6%47.1%Left ( 30 Credits)These measures report nine potentialoutcomes for the students in the cohortranging from receipt of a credential (withand without transfer) to left the college.Each student in the cohort is counted inonly one of the Six-Year Outcomes andthe sum of all of the outcomes will total100% of the cohort.-UnduplicatedHierarchicalAchieved by the end of sixyearsCredentials earned at thereporting collegeReport generated on 2/24/2015 6:53:32 PM
Austin Community College (Austin, TX)Career & Technical Education ProfileThese data represent the college’s CREDIT and NON-CREDIT CTE enrollment and completions for the: 2011-12 and 2012-13. CREDIT CTE completions, , are sourced from IPEDs.Career & Technical Education (CTE) MeasuresCTE ProfileAbout the CTE ProfileCreditEnrollment (Headcount; sociate1,035871Certs. 1 Year6596068.7%Certs. 1Year3464-46.9%1,7281,54112.1%TotalCREDIT at count; 2011-122012-132010-11NON-CREDIT CTEEnrollmentSource: IPEDS completions dataNon-CreditCREDIT -12NON-CREDIT CTECompletions62011-12The CTE Profile provides the college’smost recently available CTEenrollment and completions data (forboth credit and non-credit CTEofferings). This information providescontext about the college’s CTE. It isnot based on a cohort of students.2011-122012-13Report generated on 2/24/2015 6:53:32 PM
Austin Community College (Austin, TX)Career & Technical Education Cohort Outcomes (CTE Students Completed/Left in 2010-11)These data represent students that took CTE at the college, exited the college in the 2010-11 academic year, and their outcomes upon exiting the college with a CTE credential or asignificant CTE experience (earned 7 CTE credit hours or received 180 contact hours of CTE instruction).Career & Technical Education (CTE) MeasuresCTE Completer/Leaver Cohort & OutcomesCTE Completer/Leaver CohortCTE Completer/Leaver Cohort1,6670000Total Credit Completers/LeaversAwarded Associate DegreeCompleted CertificateLeft with No AwardNon-Credit Completers/LeaversThe CTE Cohort is made up ofstudents that took CTE at the college(credit or non-credit CTE) and eitherearned a formal award in CTE[completers] or left the college with asignificant CTE experience – havingearned 7 CTE credits or havingreceived 180 contact hours of CTEinstruction [leavers].Completers/Leavers with Prior AwardsPrior Bachelor's or HigherTotal Credit CohortAwarded AssociatesCompleted CertificateLeft with No AwardNon-Credit Cohort2900000Prior Associate(17.4%)N/AN/AN/AN/A1200000Total Prior AN/AN/AIndustry Recognized Credentials of Completers/LeaversTotal Credit Completers/LeaversAwarded Associate DegreeCompleted CertificateLeft with No AwardNon-Credit Completers/Leavers00000(00.0%)N/AN/AN/AN/AAbout CTE OutcomesFor the CTE Completer/LeaverCohort, the VFA then reportsthese students’ outcomes after theCTE experience (post-collegiate).Licensure Exam Pass Rate of Completers/LeaversPassedTotal Credit CohortAwarded AssociateCompleted CertificateLeft with No AwardNon-Credit CohortAttemptedPass Rate00000N/AN/AN/AN/AN/A00000Median Wage Growth of Completers/LeaversWage PriorTotal Credit CohortAwarded AssociateCompleted CertificateLeft with No AwardNon-Credit CohortWage Post 0 0 0 0 0Change 0 0 0 0 0 0 0 0 0 0N/AN/AN/AN/AN/AEducation and Earnings of Completers/LeaversEnrolled inEducationTotal Credit CohortAssociateCertificateLeft No AwardNon-Credit CohortEmployed with Not Applicable Not ApplicableLivable Wage( 47,100)0 (00.0%)00 N/A0 /AN/AN/A0000N/AN/AN/AN/ANot Applicable Not Applicable Not 00000(00.0%)N/AN/AN/AN/AUnemployed/Unknown0 (00.0%)0 N/A0 N/A0 N/A0 (N/A)Report generated on 2/24/2015 6:53:32 PM
Austin Community College (Austin, TX)Career & Technical Education Cohort (CTE Students Completed/Left in 2010-11)These data represent students that took CREDIT CTE at the college, exited the college in the 2010-11 academic year, and their outcomes upon exiting the college with a CTE credential ora significant CTE experience (earned 7 CTE credit hours or received 180 contact hours of CTE instruction).At present, the VFA provides graphical data for the CREDIT CTE measures but not for the NON-CREDIT CTE measures. The variances in how colleges track NON-CREDIT CTE and the lack ofdata available on NON-CREDIT CTE are challenges for many colleges. Therefore there is not enough NON-CREDIT CTE data to display appropriately using graphics.Credit Career & Technical Education (CTE) MeasuresCTE Completer/Leaver Cohort ProfileCredit Completer/Leaver CohortCredit Completers/Leavers With Prior AwardsPrior Bachelor's Prior Associate Total Prior AwardsTotal Credit Completers/Leavers1,667Total Credit Cohort290 (17.4%)Awarded Associates Degree0Awarded Associates0 (N/A)0 (N/A)Completed Certificate0Completed Certificate0 (N/A)0 (N/A)N/A (N/A)Left with No Award0Left with No Award0 (N/A)0 (N/A)N/A (N/A)120 (7.2%)410 (24.6%)N/A (N/A)Outcomes of CTE Completers/Leavers: CreditEducation and EarningsMedian Wage GrowthLicensure Exam Pass RateIndustry Recognized CredentialTotal CreditCohort0.0%CertificateAssociatesLeft/No Award0%20%40%60%80%100%Enrolled in EducationNot ApplicableNot ApplicableNot ApplicableNot ApplicableNot ApplicableEmployed with LivableWage ( 47,100)Unemployed/ %60%80%100%Note: Colleges did not report Credit CTE data by awardtype (Certificate, Associates, Left/No Award) for the2013-14 collection cycle.Report generated on 2/24/2015 6:53:32 PM
Austin Community College (Austin, TX)Adult Basic Education Cohort (Students from 2010-11 )These data represent students that came to the college for ABE in the 2010-11 academic year.Adult Basic Education (ABE) Measures (Optional)ABE CohortABE Cohort YearNumber of Students inCohortNumber of StudentsCompleted2010-114,4150The ABE Cohort is students that tookABE at the college during theacademic (or calendar year) indicated.100%ABE Measures80%60%These ABE measures determine firstwhich students reached a standardlevel of high school equivalency (orcompleted adult basic education) atthe college. Of those students thatachieved an adult basic education, themeasures determine what percentageof these students continued with theireducation or gained employment witha wage above the minimum wage,within one year of exiting the college.40%20%0%0.0%Completed ABEEnrolled in MoreEducationGained EmploymentReport generated on 2/24/2015 6:53:32 PM
Austin Community College (Austin, TX) VFA Data Collection Cycle 2013-14 - Overview of what is in the - Two Year Cohort (Fall Students 2011) o Developmental Education Progress Measures - Six Year Cohort (Fall Students 2007) o Six-Year Outcomes Measures - Career & Technical Education (CTE) .