Transcription
Purdue University Fort Wayne:Great Jobs and Great Lives2020 UNDERGRADUATE ALUMNI SCORECARD
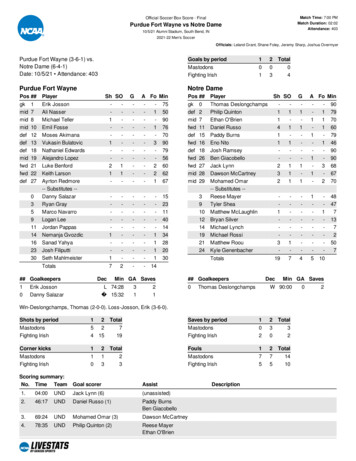
Purdue University Fort Wayne Value Index2020 PURDUE UNIVERSITY FORT WAYNE RESULTS SUMMARYVALUE AND PREPARATIONAgree (%4)PFW prepared me well forlife outside of college.Strongly agree (%5)38%My education from PFW was worth the cost.(Among 39% of PFW’s alumni with loans*)19%My education from PFW wasworth the cost. (Overall)21%%4 %570%32%79%60%86%65%17%86%PFW alumni who say someone atPFW helped them find a job aftergraduationPFW alumni who are satisfied orextremely satisfied with the educationthey receivedWORK FULFILLMENT**Agree (%4)Strongly agree (%5)%4 %5I am deeply interested in the work that I do.25%50%75%My job gives me the opportunity todo work that interests me.25%50%75%I have the ideal job for me.33%30%35%PFW alumni who strongly agree to allthree work fulfillment questions*Among alumni who took out undergraduate loans to attend PFW**Work fulfillment questions were only asked of alumni who indicated they are employed full time by an employer3Copyright 2020 Gallup, Inc. All rights reserved.65%
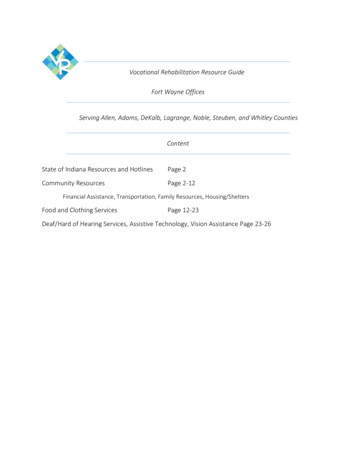
Methodology Summary391Gallup Alumni Survey(GAS) Core SurveyPFW UndergraduateAlumni SurveyCompletesIncludes custom items developedby Gallup and the IndianaCommission for Higher EducationPFW alumni who received theirbachelor’s degree between 1964and 2019 and had a valid emailaddress on file were invited toparticipate.Survey Fielded:Jan. 6-Feb. 17, 2020Nonresponders received up to fiveemail reminders.Comparison Groups Are Derived From the GallupAlumni Survey National Database (1964-2019)College graduates nationally: n 65,955 GAS IN college graduates: n 1,8924Copyright 2020 Gallup, Inc. All rights reserved.
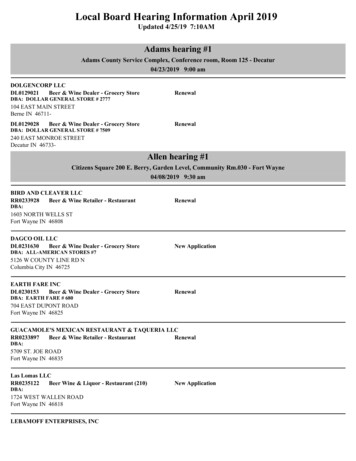
Profile of RespondentsUndergraduate alumni who graduated from 1964-2019n 391 Mean age aleFemaleFirst-Generation Student68%Retired32%YesPrefer not to answer33%No65%YesNoDon't knowTotal Annual Personal Income4%12%21%38%13%9%Total Annual Household Income6%14% 12,000 120,000- 239,99936% 12,000- 35,999 240,000 28% 36,000- 59,999Don't know6% 60,000- 119,999Note: Due to rounding, percentages may sum to 100% /-1%. Numerical values shown when 4% or higher5Copyright 2020 Gallup, Inc. All rights reserved.9%
Great Jobs: Workplace Engagement76Employment Outcomes11Gallup’s Employee Engagement Measures12Engagement Index13Workplace Fulfillment14Career Services and InternshipsCopyright 2020 Gallup, Inc. All rights reserved.
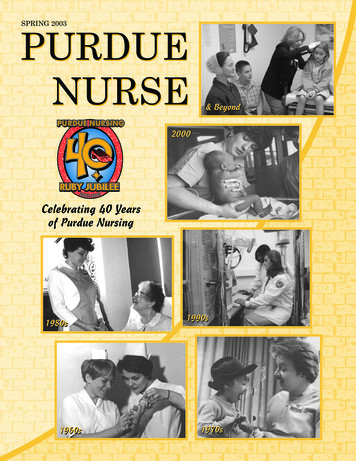
Employment OutcomesEmployment Status4%PFW alumni52%10%28%4%College graduates nationally60%*10% 5% 18%*4%GAS IN college graduates61%*11% 5% 17%*Employed full time (employer)Employed full time (self)Employed part time, do not want full timeUnemployedEmployed part time, want full timeNot in workforceHow closely related is your current workto your undergraduate major(s)?Among employed alumniPFW alumni41%37%College graduatesnationally36%GAS IN collegegraduates37%36%Somewhat relatedNot at all relatedCompletely related36%*A comparison group's outcome is statistically different from PFW’s outcome at the 95% confidence level.Note: Due to rounding, percentages may sum to 100% /-1%. Numerical values shown when 4% or higher7Copyright 2020 Gallup, Inc. All rights reserved.21%28%26%Don't know
Employment Outcomes17%52%64%PFW alumni who saidsomeone at PFW helpedthem find a job aftergraduation PFW alumni who had a jobwith a company they workedfor or interned for while incollege PFW alumni who currentlywork in Indiana About how long did it take for you to obtain agood job after you completed your undergraduateeducation at PFW?42%I had a job waiting for mewhen I graduated30%*33%*11%15%15%Two months or less9%Three to six monthsSeven months to a year14%*13%5%7%6%11%14%13%More than a yearNot applicable because I was notseeking employment upongraduationDon't knowPFW alumni19%19%19%1%2%1%College graduates nationallyGAS IN college graduates*A comparison group's outcome is statistically different from PFW’s outcome at the 95% confidence level. A custom item developed for the Indiana Commission for Higher Education; national comparisons not available Among alumni who said they obtained a good job after graduation8Copyright 2020 Gallup, Inc. All rights reserved.
Sources of EmploymentSources of Assistance in Finding a Job AfterGraduation From PFW Professor23%Career services office staffmember8%Other staff memberat PFW7%Classmates or friendsat PFWParentsOther family members9%5%3%A current or previousemployerDid not receive any helpfinding a job after college Among alumni who said they obtained a good job after graduation.9Copyright 2020 Gallup, Inc. All rights reserved.17%49%
Location of EmploymentTop 10 Current Locations of Employment12345Indiana (66%)Ohio (4%)Florida (4%)Texas (3%)California (3%)Which of the following describes why youare working in [STATE OFEMPLOYMENT]?36%9%678910Illinois (2%)Tennessee (2%)Michigan (2%)North Carolina (2%)Wisconsin (2%)17%PFW alumni who saidsomeone at PFW helpedthem find a job aftergraduation 52%PFW alumni who had a jobwith a company they workedfor or interned for while incollege 64%PFW alumni who currentlywork in Indiana Specific job offerMore career opportunitiesin my field75%Personal reasons (family, friends,relationship, medical, etc.)28%Financial reasons (cost of living,taxes, etc.)20%Lifestyle (weather, recreationalactivities, cultural activities, etc.)3%Pursuing further education in[STATE OF EMPLOYMENT]3%None of these reasons A custom item developed for the Indiana Commission for Higher Education; national comparisons not available Among alumni who said they obtained a good job after graduation10Copyright 2020 Gallup, Inc. All rights reserved.
Gallup’s Employee Engagement MeasuresMAXIMIZING EMPLOYEES’ PERFORMANCEGallup has measured the engagement of morethan 6.4 million employees globally from hundredsof organizations and companies.Workplace engagement is an important driver ofoverall wellbeing and is the leading indicator oforganizational performance such as higherprofitability and better financial outcomes.Gallup’s Q12 instrument measures an individual’semotional connection to and investment in theirjob. The 12 engagement elements function likeMaslow's hierarchy of needs, with basic needs thatmust be fulfilled before employees can progress.To reduce response burden for PFW’ssurvey, the 12 elements were reducedto three elements that correlate highlywith the full Q12 index:Q03. Do what I do bestevery dayQ06. Someone at workencourages mydevelopmentQ07. At work, my opinionsseem to count11Copyright 1993-1998, 2020 Gallup, Inc. All rights reserved.The Gallup Q12 items are Gallup proprietary information and are protected by law.You may not administer a survey with the Q12 items or reproduce them without written consent from Gallup.
Engagement IndexGallup categorizes workers as engaged, not engaged or actively disengaged based on responses to athree-question index that measures elements that best predict employee and workgroup performance.This index correlates highly with the full Q12 index.ENGAGEDNOTENGAGEDACTIVELYDISENGAGEDHighly involved in andenthusiastic about their workand workplace. They arepsychological “owners,”drive performance andinnovation, and move theorganization forward.Psychologically unattachedto their work and company.Because their engagementneeds are not being fullymet, they are putting time —but not energy or passion —into their work.Resentful that their needsare not being met and areacting out their unhappiness.Every day, these workerspotentially undermine whattheir engaged coworkersaccomplish.Engagement IndexAmong graduates employed full time by an employer35%36%51%50%12%14%14%PFW alumniCollege graduates nationallyGAS IN college graduates40%48%Actively disengagedNot engagedEngaged*A comparison group's outcome is statistically different from PFW’s outcome at the 95% confidence level.Note: Due to rounding, percentages may sum to 100% /-1%.12Copyright 2020 Gallup, Inc. All rights reserved.
Workplace FulfillmentWorkplace Fulfillment% Strongly agree, among employed graduates50%I am deeply interestedin the work that I do.42%*44%50%My job gives me theopportunity to do work thatinterests me.42%*42%*35%I have the ideal job for me.29%26%*33%All three work fulfillmentquestions25%*23%*PFW alumniCollege graduates nationallyGAS IN college graduates*A comparison group's outcome is statistically different from PFW’s outcome at the 95% confidence level.13Copyright 2020 Gallup, Inc. All rights reserved.
Career Services and InternshipsWhile attending PFW, how often did you visit, or access resourcesprovided by, the career services office?% Very often, often or rarely64%73%*74%PFW alumniCollege graduates nationallyGAS IN college graduatesHow helpful was the career services office to you?Among graduates who visited career services at least oncePFW alumni11%College graduates nationally9%GAS IN college graduates7%Very helpfulHelpful24%30%21%17%Somewhat helpful7%35%29%13%*11%Not at all helpfulCopyright 2020 Gallup, Inc. All rights reserved.22%35%*Don't know/cannot recall*A comparison group's outcome is statistically different from PFW’s outcome at the 95% confidence level.1428%
Career Services and InternshipsHow often did you receive career advice from other faculty or staffmembers at PFW who were not career services employees?% Very often, often or rarely among graduates who graduated after 201077%77%75%PFW alumniCollege graduates nationallyGAS IN college graduatesHow helpful was the career-related information youreceived from faculty or staff members?Among graduates who received advice at least oncePFW alumni18%College graduates nationally17%GAS IN college graduatesVery helpfulHelpful8%35%31%36%Somewhat helpfulNot at all helpful27%32%34%Copyright 2020 Gallup, Inc. All rights reserved.6% 13%19%Don't know/cannot recall*A comparison group's outcome is statistically different from PFW’s outcome at the 95% confidence level.Numerical values shown when 4% or higher157% 12%
Skills Training ProgramsDoes your employer offer tuition assistance foradditional education or training programs?*56%31%YesNo13%Don't knowHow likely are you to enroll in an additionaleducation or training program in the next five years?10%16%33%Very likely41%LikelyUnlikelyVery unlikelyHow likely are you to enroll in each of the followingtypes of additional education or training programs inthe next five years?OnlineInPerson14%8%22%30%18%Very likely35%36%Likely39%UnlikelyVery unlikelyHow likely are you to enroll in each of the followingtypes of additional education or training programs inthe next five years?Through a private company8%Through a nonprofit5%institutionThrough a current employer17%20%14%Very likelyLikelyCopyright 2020 Gallup, Inc. All rights reserved.43%37%28%*Among respondents who are employed full time by an employer1632%Unlikely38%26%Very unlikely32%
Great Lives: Wellbeing1718Defining a “Good Life”19Wellbeing Elements20Number of Thriving ElementsCopyright 2020 Gallup, Inc. All rights reserved.
Defining a “Good Life”GALLUP’S GLOBAL W ELLBEING RESEARCHGallup has conducted decades of global research surveying arepresentative sample of 98% of the world’s population from 150 countries.Wellbeing is associated with numerous positive health and employment outcomes: lowermedical and health expenditures, fewer ER visits, lower absenteeism, etc.Factor analysis identified five interrelated and interdependent elements of wellbeing:PURPOSELiking what you do each day and beingmotivated to achieve goalsPHYSICALHaving good health and enoughenergy to get things done dailyCOMMUNITYLiking where you live, feeling safeand having pride in your community18SOCIALHaving supportive relationshipsand love in your lifeFINANCIALManaging your economic life toreduce stress and increase securityCopyright 2008, 2020 Gallup, Inc. All rights reserved.The Gallup National Health and Well-Being Index items are Gallup proprietary information and are protected by law.You may not administer a survey with the Gallup National Health and Well-Being Index items or reproduce them
Wellbeing ElementsWellbeing, by Element% Thriving59%Purpose wellbeing52%*51%*53%Social wellbeing49%49%61%Financial wellbeing42%*45%*53%Community wellbeing45%*45%*39%Physical wellbeing34%34%PFW alumniCollege graduates nationallyGAS IN college graduates*A comparison group's outcome is statistically different from PFW’s outcome at the 95% confidence level.19Copyright 2008, 2020 Gallup, Inc. All rights reserved.The Gallup National Health and Well-Being Index items are Gallup proprietary information and are protected by law.You may not administer a survey with the Gallup National Health and Well-Being Index items or reproduce them
Number of Thriving ElementsGallup examines not only the individual levels of wellbeing, but also the difficult-to-reach pinnacleof thriving in all five wellbeing elements: purpose, social, financial, community and physical.Wellbeing, by Number of Thriving 16%Two18%20%*14%One19%*19%*16%Zero21%*20%PFW alumniCollege graduates nationallyGAS IN college graduates*A comparison group's outcome is statistically different from PFW’s outcome at the 95% confidence level.20Copyright 2008, 2020 Gallup, Inc. All rights reserved.The Gallup National Health and Well-Being Index items are Gallup proprietary information and are protected by law.You may not administer a survey with the Gallup National Health and Well-Being Index items or reproduce them
Great Experiences: Support andExperiential Learning2122The Gallup Alumni Survey23Six Critical College Experiences24Three Support Experiences25Three Experiential Learning Experiences26Sources of ExperiencesCopyright 2020 Gallup, Inc. All rights reserved.
The Gallup Alumni SurveyEXAMINING THE OUTCOMES OF COLLEGE GRADUATESThe Gallup Alumni Survey is a nationallyrepresentative annual survey of U.S. collegegraduates (n 70,000 ), measuring the degreeto which graduates have "great jobs" throughsuccessful and engaging careers and lead"great lives" by thriving in their overallwellbeing. Survey measures include: overall wellbeing (five elements) workplace engagement (Q12) college experiences affinity and attachment to alma materWhere you go to collegematters far less than howyou go to college.How can college promote lifelong wellbeingand engagement? By providing supportiveand experiential learning opportunities for itsstudents. Gallup research shows that sixcritical college experiences are stronglyassociated with wellbeing and engagement atwork. Three of the six relate to graduatesfeeling supported in college, and the otherthree tie to experiential learning.Graduates who strongly agree to the following statements had higher odds of workplaceengagement and lifelong wellbeing (compared with graduates who did not strongly agree):WorkplaceEngagementWellbeingHad a professor who cared about you asa person1.7x1.4xHad at least one professor who made youexcited about learning1.7x1.4xHad a mentor who encouraged you topursue your goals and dreams1.9x1.4xEXPERIENTIAL LEARNINGEXPERIENCESWorkplaceEngagementWellbeingHad an internship or job that allowed you toapply what you were learning in the classroom1.8x1.3xWorked on a project that took a semesteror more to complete1.7x1.2xWas extremely active in extracurricularactivities and organizations1.6x1.2xEMOTIONAL SUPPORT EXPERIENCES22Copyright 2020 Gallup, Inc. All rights reserved.
Six Critical College ExperiencesPREPARING STUDENTS FOR LIFE AFTER COLLEGEAlmost half (45%) ofgraduates nationally had noneor only one of the siximportant college experiencesduring their time in college.Only 3% of graduatesnationally have experiencedall six of these experienceswhile in college.Graduates nationally were also asked to rate theextent to which they agree or disagree that theirinstitution prepared them well for life outside ofcollege. While only 5% of those who had zero ofthe six experiences strongly agreed theirinstitution prepared them well for life outside ofcollege, 80% of those who had all six experiencesdid so.A similar pattern is also in PFW’s data. Alumniwith more positive experiences are more likely tostrongly agree they were prepared well for lifeoutside of college.Positive Experiences and Preparedness% Strongly agree, among PFW oOneTwoNumber of positive experiencesThreeFourFivePrepared me well for life outside of college**Respondents who strongly agree that their university prepared them well for life outside of college23Copyright 2020 Gallup, Inc. All rights reserved.Six
Three Support ExperiencesGallup research shows that the odds that a given college graduate is engaged at work are higherif they strongly agree to having had each of six critical college experiences. The three “supportexperience” items below comprise half of the six critical college experiences that prepare studentsfor life outside of college.Support Experiences% Strongly agree36%My professors at PFW caredabout me as a person.28%*31%70%I had at least one professor at PFW whomade me excited about learning.64%64%28%While attending PFW, I had amentor who encouraged me to pursuemy goals and dreams.23%23%20%All three support experiences14%*15%*PFW alumniCollege graduates nationallyGAS IN college graduates*A comparison group's outcome is statistically different from PFW’s outcome at the 95% confidence level.24Copyright 2020 Gallup, Inc. All rights reserved.
Three Experiential Learning ExperiencesThe three “experiential learning” items below comprise the other half of the six critical collegeexperiences that prepare students for life outside of college.Experiential Learning61%While attending PFW, did you have a jobor internship that allowed you to applywhat you were learning in the classroom?(% Yes)36%*36%*45%While attending PFW, I worked on aproject that took a semester or more tocomplete. (% Strongly agree)33%*31%*12%I was extremely active in extracurricularactivities and organizations whileattending PFW. (% Strongly agree)20%*22%*5%All three experiential learningexperiences (% Strongly agree/% Yes)6%5%PFW alumniCollege graduates nationallyGAS IN college graduates*A comparison group's outcome is statistically different from PFW’s outcome at the 95% confidence level.25Copyright 2020 Gallup, Inc. All rights reserved.
Sources of Experiences28%61%PFW alumni who had an encouragingmentorPFW alumni who had an applied job orinternshipSources of Mentors and Job/Internship atPFW 59%ProfessorFriend35%0%10%College or universitystaff member14%35%14%10%Family memberExtracurricular activity adviserSports coachOtherDon't know/cannot recallSource of mentor0%5%0%0%9%10%5%10%Source of help to obtain job or internship A custom item developed for the Indiana Commission for Higher Education; national comparisons not available Among alumni who said they had an applied job or internship26Copyright 2020 Gallup, Inc. All rights reserved.
Great Advocates: AlumniAttachment2728Alumni Attachment29Reflections on Educational Decisions30Reflections on Academic ExperienceCopyright 2020 Gallup, Inc. All rights reserved.
Alumni AttachmentGallup explores the connection between graduates and their alma mater by looking at their levelof agreement with two questions: “My university was the perfect school for people like me” and “Ican’t imagine a world without my university.” Graduates who strongly agree with both items areconsidered “emotionally attached” to their alma mater.Alumni Attachment% Strongly agree38%PFW was the perfect schoolfor people like me.33%38%30%I can't imagine a worldwithout PFW.25%29%21%Both statements19%24%PFW alumniCollege graduates nationallyGAS IN college graduates38%40%37%PFW alumni who areextremely likely torecommend their universityto family, friends orcolleaguesCollege graduates nationallywho are extremely likely torecommend their universityto family, friends orcolleaguesIndiana graduates who areextremely likely torecommend their universityto family, friends orcolleagues*A comparison group's outcome is statistically different from PFW’s outcome at the 95% confidence level.28Copyright 2020 Gallup, Inc. All rights reserved.
Reflections on Educational DecisionsIf you had to do it all over again, would you still ? % Yes, you would98%75%86%Obtain a bachelor’s degreeStudy the same major thatyou studied in yourbachelor’s degree programAttend PFW to obtain yourbachelor’s degreeHow many times did you change your major whileattending PFW to complete yourundergraduate degree? 66%29%NoneOne time4%2%Two timesThree or more timesHow satisfied are you with the education youreceived from PFW? 49%Extremely satisfied37%432Extremely dissatisfied A custom item developed for the Indiana Commission for Higher Education; national comparisons not available Excludes times they switched from undecided or undeclared to declared in a major field of studyNumerical values shown when 4% or higher29Copyright 2020 Gallup, Inc. All rights reserved.12%Don't know
Reflections on Academic ExperiencePerceptions of Academic Experience% Strongly agree45%I was challenged academicallyat PFW.42%48%32%PFW prepared me wellfor life outside of college.29%31%65%My education from PFWwas worth the cost.49%*51%*PFW alumniCollege graduates nationallyGAS IN college graduates*A comparison group's outcome is statistically different from PFW’s outcome at the 95% confidence level.30Copyright 2020 Gallup, Inc. All rights reserved.
Methodology31Copyright 2020 Gallup, Inc. All rights reserved.
MethodologyNATIONAL COM PARISONMETHODOLOGYFor the purposes of this report, data from PFWare compared with data collected from thenational Gallup Alumni Survey study of collegegraduates. Some differences may existbetween the national comparison pointsincluded in this report and national estimatesthat Gallup has previously released becausethis report focuses on graduates who receivedtheir undergraduate degrees from 1964–2019.Comparison groups included in this scorecardare:Results for the PFW alumni study are basedon web surveys conducted Jan. 6-Feb. 17,2020, with a sample of 391 PFWundergraduate alumni. Alumni were includedin the study if PFW had an email address onfile and they graduated between 1964 and2019. PFW provided a total of 5,172 emailaddresses.College graduates nationally: Bachelor’sdegree holders surveyed via the nationalGallup Alumni Survey which includes thosewho participated in the national study andreported they have a bachelor’s degree onlyfrom a Title IV degree-granting four-yearpublic, private, for-profit or nonprofit institutionin the U.S. as defined by the U.S. Departmentof Education.GAS IN graduates: Bachelor’s degree holderssurveyed via the national Gallup AlumniSurvey who indicated that they obtained abachelor’s degree from a university located inIndiana.32Copyright 2020 Gallup, Inc. All rights reserved.Results for the Gallup Alumni Survey, thestudy used for comparison purposes, arebased on web surveys conducted Feb. 4-Mar.7, 2014, Dec. 16, 2014-Jun. 29, 2015, Aug.22-Oct. 11, 2016, and Apr. 25-Jun. 3, 2018with a random sample of 29,560 respondents,30,151 respondents, 11,483 respondents, and5,107 respondents respectively, with abachelor's degree or higher, aged 18 andolder, with internet access, living in all 50 U.S.states and the District of Columbia.
MethodologyThe 2014 Gallup Alumni Survey sample was compiled from two sources: the Gallup PanelTM andthe Gallup Daily tracking survey. The 2015 and 2016 Gallup Alumni Survey samples wererecruited via the Gallup Daily tracking survey. The 2018 Gallup Alumni Survey sample wasrecruited via the Strada-Gallup Education Consumer Survey. The Gallup Panel is a proprietary,probability-based longitudinal panel of U.S. adults who are selected using random-digit-dial (RDD)and address-based sampling methods. The Gallup Panel is not an opt-in panel. The Gallup Panelincludes 60,000 individuals, and Panel members can be surveyed by phone, mail or web. GallupPanel members with a college degree and access to the internet were invited to take the GallupAlumni Survey online.The Gallup Daily tracking survey sample includes national adults with a minimum quota of 70%cellphone respondents and 30% landline respondents, with additional minimum quotas by timezone within region. Landline and cellular telephone numbers are selected using RDD methods.Landline respondents are chosen at random within each household on the basis of which memberhad the most recent birthday. Gallup Daily tracking respondents with a college degree, whoagreed to future contact, were invited to take the Gallup Alumni Survey online.Gallup Alumni Survey interviews are conducted via the web, in English only. Samples areweighted to correct for unequal selection probability and nonresponse. The data are weighted tomatch national demographics of gender, age, race, Hispanic ethnicity, education and region.Demographic weighting targets are based on the most recent Current Population Survey figuresfor the aged 18 and older U.S. bachelor's degree or higher population.All reported margins of sampling error for the Gallup Alumni Survey of all college graduatesinclude the computed design effects for weighting.For results based on the total sample of those with a bachelor’s degree, the margin ofsampling error is 0.5 percentage points at the 95% confidence level.For results based on employee engagement of those with a bachelor’s degree, the marginof sampling error is 0.8 percentage points at the 95% confidence level.For results based on those with a bachelor’s degree from an Indiana institution, the marginof sampling error is 3.1 percentage points at the 95% confidence level.For results based on employee engagement of those with a bachelor’s degree from anIndiana institution, the margin of sampling error is 4.5 percentage points at the 95%confidence level.In addition to sampling error, question wording and practical difficulties in conducting surveys canintroduce error or bias into the findings of public opinion polls.33Copyright 2020 Gallup, Inc. All rights reserved.
Appendix34Copyright 2020 Gallup, Inc. All rights reserved.
AppendixWhat is your highest completed level of education?Bachelor’s degree54%Postgraduate work or degree46%What type of postgraduate work or degree did you complete? Postgraduate work only, no degree15%Master of Arts (M.A.)15%Master of Science (M.S.)29%Master of Business Administration (MBA)26%Juris Doctor (J.D.)4%Other master’s degree6%Doctor of Medicine (M.D.)1%Ph.D.10%Other professional degree (e.g., LLB, DDS, DVM)3%Other5%Don't know0%While attending PFW (% Yes)Did you participate in NCAA intercollegiate athletics?4%Did you participate in intramural sports?12%Did you participate in a student club or organization?40%Did you have a paid job or internship?76%Did you hold a leadership position in a club or organization such as your studentgovernment, a fraternity or sorority, or an athletic team?19%Did you participate in a research project with a professor or faculty member?**32% Among PFW alumni who indicated their highest level of education is postgraduate work or degree**This may include a project you participated in as part of a class you took, a thesis project ore paper, a research project submittedto a professional conference, or a paper submitted to a journal for publication35Copyright 2020 Gallup, Inc. All rights reserved.
AppendixThroughout your college experience at PFW, did you receive anymerit-based scholarships?Yes31%No65%Don’t know4%Throughout your college experience at PFW, did you receive any need-based federalfinancial aid?Yes40%No56%Don’t know4%Approximately how much money did you borrow in student loans to obtain yourundergraduate degree at PFW? Mean 29,117Median 22,020Approximately how much money did you borrow in student loans to obtain yourpostgraduate work or degree? Mean 51,549Median 44,250Have you delayed any of the following because of your student loans?Getting married14%Having children20%Going back to school for more training or another degree28%Starting your own business17%Buying a car27%Buying a home26%Moving out of your parent’s/parents’ home12% Of alumni who indicated they took out a loan; adjusted to reflect inflated amounts for 201936Copyright 2020 Gallup, Inc. All rights reserved.
AppendixWas PFW a good place or not a good place for students who are members of racial andethnic minorities? Good place51%Not a good place2%Don’t know47%Was PFW a good place or not a good place for lesbian, gay, bisexual or transgenderstudents? Good place25%Not a good place2%Don’t know73%While attending PFW, I interacted with people from different backgrounds on a regularbasis. %5 — Strongly agree55%%424%%317%%25%%1 — Strongly disagree0%Don’t know0%In what state was the high school where you obtained your high school diploma?Indiana72%Outside of Indiana28% Asked of alumni who graduated between 1990 and 2019 Asked of alumni who graduated between 2011 and 201937Copyright 2020 Gallup, Inc. All rights reserved.
About UsGALLUPGallup delivers analytics and advice to help leaders and organizations solve their most pressingproblems. Combining more than 80 years of experience with its global reach, Gallup knows moreabout the attitudes and behaviors of employees, customers, students and citizens than any otherorganization in the world. For more information, visit www.gallup.com or education.gallup.com.PURDUE UNIVERSITY FORT WAYNEPurdue University Fort Wayne is located in Indiana’s second-largest city and offers a traditionalcampus experience within a thriving metropolitan setting. As part of the venerable PurdueUniversity system, students earn undergraduate and graduate degrees from one of the mosttrusted and prestigious
Purdue University Fort Wayne Value Index 3 2020 PURDUE UNIVERSITY FORT WAYNE RESULTS SUMMARY 38% 19% 21% 32% 60% 65% 33% PFW alumni who strongly agree to all three work fulfillment questions Agree (%4) Strongly agree (%5) WORK FULFILLMENT** %4 %5 I am deeply interested in the work that I do. 75% My job gives me the opportunity to do work that .