Transcription
Performance VisualizationUsability and ReusabilityDiane T. RoverDepartment of Electrical & Computer Engineeringwww.egr.msu.edu/ roverUS/Venezuela Workshop on HPC 2000emstySrfoPeceanrm
Acknowledgements NSF ACI-9624149 DARPA DABT63-95-C-0072 Co-PIs– Matt Mutka, Kurt Stirewalt Students– Aleks Bakic, Kuk-jin Lee, Abdul WaheedemstySrfoPeceanrmD. Rover - MSU - 4/20002
Outline What is performance visualization?zation?Instrumentation systemsVisualization systemsPGRT infrastructure– Visual objects & VOML Uniform resource visualizationemstySrfoPe– Components– CompositionceanrmD. Rover - MSU - 4/20003
Outline What is performance visualization?Instrumentation systemsVisualization systemsPGRT infrastructure– Visual objects & VOML Uniform resource visualizationemstySrfoPe– Components– CompositionceanrmD. Rover - MSU - 4/20004
What is performance visualization? Visualization: the process of forming amental picture or vision of something notpresent to the sight Software visualization: use of typography,graphic design, and animation, withmodern human-computer interaction andcomputer graphics technology, to facilitateboth the human understanding andeffective use of computer softwareemstySrfoPeceanrmD. Rover - MSU - 4/20005
What is performance visualization? Performance visualization: a type ofsoftware visualization that includesaspects such as hardware performance(also computation/system visualization)– Visualization of concurrency is a specificconcern for parallel and distributed systems– Used to evaluate performance, verifycorrectness, diagnose problems, and gaininsight into structure and execution behavioremstySrfoPeceanrmD. Rover - MSU - 4/20006
What is performance visualization? Static representation of system state– structure/content of a large database Dynamic execution behavioremstySrfoPe– runtime control flow– memory usage– interprocessor communication– graphs of metrics, e.g., utilization, traffic– application-specific views of datacomputations– etc.andceanrmD. Rover - MSU - 4/20007
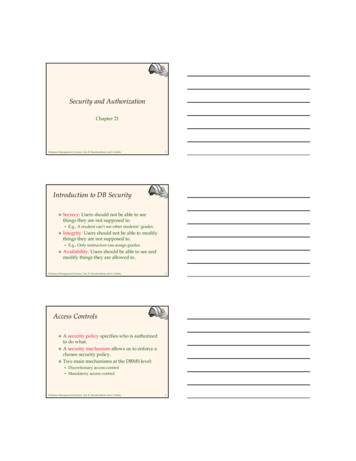
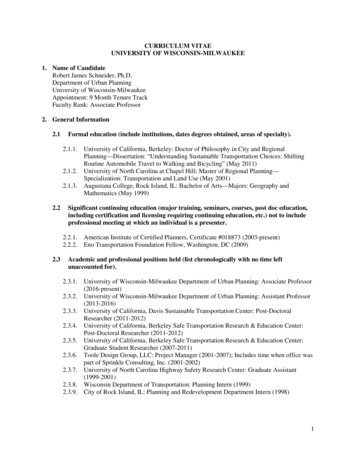
ExamplesIBM’s PV system configuration, showing activity onthe system as a whole, including a process tree view,histogram of process runtimes, and strip charts ofprocess and system activities.Chapter 20 by Kimelman, Rosenburg, and Roth in Stasko,Domingue, Brown, and Price, Software Visualization Programmingas a Multimedia Experience, MIT Press, 1998.encemstySrrfoePamD. Rover - MSU - 4/20008
IBM’s PV system configurationemstySrfoPeceanrmD. Rover - MSU - 4/20009
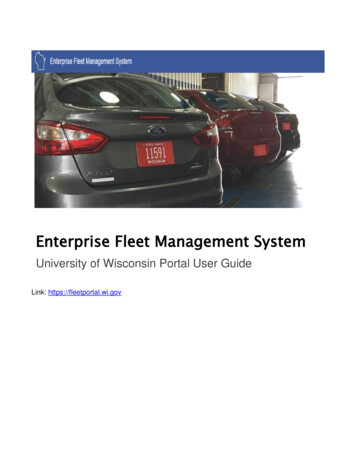
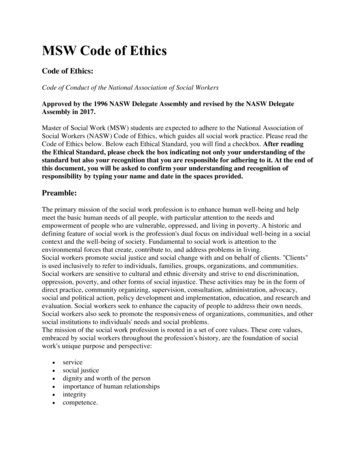
ExamplesLucent Technologies’ SeeSoft code display, showingan overview of many files and their statistics at once,here code age. The newest code is in red and the oldestin blue. Blue and green files represent more stable code.SeeSoft visualizes text files by mapping each line into athin row, colored according to a statistic of interestderived from version control systems, static analysis, andprofiling.Chapter 21 by Eick in Stasko, Domingue, Brown, and Price,Software Visualization - Programming as a Multimedia Experience,eMITancPress,1998.emstySrfoPermD. Rover - MSU - 4/200010
Lucent Technologies’ SeeSoft code displayemstySrfoPeceanrmD. Rover - MSU - 4/200011
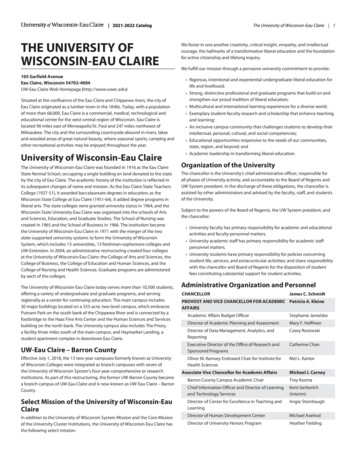
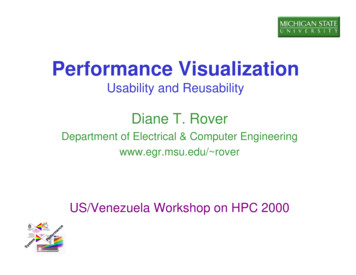
ExamplesGeorgia Institute of Technology’s POLKA animationof a parallel minimum spanning tree program. The leftview shows the graph and the spanning tree growinginside it. The right view shows the “closest” datastructure maintained by the program.Chapter 17 by Kraemer in Stasko, Domingue, Brown, and Price,Software Visualization - Programming as a Multimedia Experience,MIT Press, 1998.emstySrfoPeceanrmD. Rover - MSU - 4/200012
Georgia Tech’s POLKAOLKA animationemstySrfoPeceanrmD. Rover - MSU - 4/200013
ExamplesStanford University’s Rivet visualization of threadscheduling algorithms in the Argus parallel renderinglibrary. This visualization combines Gantt charts of perCPU and per-thread scheduling data, milestones in therendering process, and a dynamic view of the framebufferbeing generated by Argus. The dynamic display of theframebuffer synchronized to the data being displayed inthe data windows provides a familiar application-basedcontext for the user. The use of brushing between thevarious views allows otherwise disparate views to beused as a coherent whole.Hanrahan, Rivet Project, Stanford University, /.rmfoemstySrPeD. Rover - MSU - 4/200014
Stanford University’s Rivet visualizationemstySrfoPeceanrmD. Rover - MSU - 4/200015
Think about How are these visualizations created? How are these visualizations used?emstySrfoPeceanrmD. Rover - MSU - 4/200016
Steps in Visualization1. Derive information from sources in the softwaredevelopment environment, static analysis of aprogram, and data collected during program execution– Instrumentation system collects data2. Preprocess or analyze information– Format conversion, profiling, event-ordering, detection ofabstract events and global states, etc.3. Represent or display the program/system graphically– Visualization system supports creating and using views– Display issues: effectiveness, concurrency, nrmD. Rover - MSU - 4/200017
Outline What is performance visualization?Instrumentation systemsVisualization systemsPGRT infrastructure– Visual objects & VOML Uniform resource visualizationemstySrfoPe– Components– CompositionceanrmD. Rover - MSU - 4/200018
Instrumentation SystemsBaseline Reduced Instrumentation System Kernel(BRISK)Execution EnvironmentemstyS Lightweight, distributed IS Portable, flexible LIS-ISMmodelLIS Low-intrusion techniques LIS on a node: internalTPsensors in user processes,shared memory, externalsensorISM ISM on same node as TIE,Tool Integrationtools, CORBA extensionEnvironmentrfoPeceanrmD. Rover - MSU - 4/200019
Outline What is performance visualization?Instrumentation systemsVisualization systemsPGRT infrastructure– Visual objects & VOML Uniform resource visualizationemstySrfoPe– Components– CompositionceanrmD. Rover - MSU - 4/200020
Visualization Systems History– Earliest visualization systems:performance visualization tools such asParaGraph (late 1980’s)– Application-specific visualizations ofconcurrent programs (early 1990’s)– Integrated frameworks for diagnosingperformance problems, such as TAU,Paradyn, and Pablo (mid 1990’s)emstySrfoPeceanrmD. Rover - MSU - 4/200021
Visualization Systems Taxonomy– Scope. What range of programs/machines can thesystem take as input for visualization? For example,can the system visualize the concurrent features?– Content, or Abstraction. What subset ofinformation about the program/machine isvisualized by the system? For example, code versuscontrol flow diagram.– Method of Specification. How is the visualizationspecified? Some systems provide fixed visualizations,while others let the user customize visualizations.emstySrfoPeceanrmChapter 1 by Price in Stasko, Domingue, Brown, and Price, SoftwareVisualization - Programming as a Multimedia Experience, MIT Press, 1998.D. Rover - MSU - 4/200022
Visualization Systems Taxonomy (continued)– Interface, or Interaction. How does the user ofthe system interact with and control it?Navigation through a visualization is especiallyimportant for very large programs or data sets.– Presentation, or Form. How is the systemused to convey information? For example, whatmedium and graphical elements are used in thevisualization? Does the system provide facilitiesfor eliding information? for synchronizing multipleviews?emstySrfoPeceanrmD. Rover - MSU - 4/200023
Visual Displays Design Practices / Characteristics– Context. Meaning of information to the user,relationships among information: perspective,semantic context, subview mapping.– Scaling. Size/dimensionality of graphical views asdata sets become very large (e.g., as the number ofprocessors or duration of execution becomes verylarge): multi-dim. and multivariate representation,macroscopic and microscopic views, macro/microcomposition and reading, adaptive graphical display,display manipulation, composite view.emstySrfoPeChapter 23 by Heath, Malony, and Rover in Stasko, Domingue, Brown, andPrice, Software Visualization - Programming as a Multimedia Experience,MIT Press, 1998.24D. Rover - MSU - 4/2000ceanrm
Visual Displays Design Practices (continued)– Perception and Interaction. Interpretation ofdisplays by user and support by tool forexploring execution behavior through viewsand options : perception and cognition,observing patterns, user interaction.– Comparison. Relationships between views orrepresentations to gain insight into behavioralcharacteristics and their causes: multipleviews, small multiples, cross-execution views.emstySrfoPeceanrmD. Rover - MSU - 4/200025
Visual Displays Design Practices (continued)– Extraction of Information. Selection andpresentation of useful information from largedata sets: reduction and filtering, clustering,encoding and abstracting, separating information. PV, Seesoft, POLKA, Rivet examplesVisualizations and design practices canbe classified.emstySrfoPeceanrmD. Rover - MSU - 4/200026
Usability Is a visualization system or graphicaldisplay effective? DefinitionemstySrfoPe– ISO definition: the effectiveness, efficiency,and satisfaction with which specified userscan achieve specified goals in particularenvironments (ISO DIS 92419241-11)– Software usability: using particularcomputing systemsceanrmD. Rover - MSU - 4/200027
Usability Developer push? usability engineering,user-centric design Parallel Tools Consortium: researchers developers users User pull? Task Force on Requirementsquirementsfor HPC Software and ToolsemstySrfoPe– Guidelines for including software and toolsin HPC procurements(www.nacse.org/projects/HPCreqts/)– Performance tuning and debugging support28ceanrmD. Rover - MSU - 4/2000
Reusability Definition– the extent to which a software componentcan be used (with or without adaptation) inmultiple problem solutions– Reuse: synthesizing a solution to a problem based on predefinedsolutions to subproblems implementing new software systems from pre-existingsoftware, e.g., an archive of software artifacts– Why?emstySrfoPeceanrm Reduce code development effort (increase productivity) Improve quality of the softwareD. Rover - MSU - 4/200029
Reusability Issues– Design for reuse is expensive.– Tools that originate in university research labs are less likely tohave reuse as a goal. Object-oriented and component-based approaches, such as Java orDCOM, may impact reusability favorably.– Some tools, such as Pablo, have re-usable modules. This type of reuse may conflict with usability for the typical user (i.e.,a tool that is highly configurable may appear complex to a user). Other types of reuse, such as look/feel of a GUI, tend to affectusability positively.– Development of tools using a design-for/with-reuse strategy is along-term outlook.emstySrfoPeceanrm Interoperable tools Extensible environmentsD. Rover - MSU - 4/200030
Outline What is performance visualization?Instrumentation systemsVisualization systemsPGRT infrastructure– Visual objects & VOML Uniform resource visualizationemstySrfoPe– Components– CompositionceanrmD. Rover - MSU - 4/200031
PGRTT InfrastructureInterpreted le LibrariesLibrariesemstySrfoPeHLLLceanrmD. Rover - MSU - 4/200032
TIE: Tool Integration Environment Integrates software components using alanguage-based glue-and-library model Based on Guile software environment– Scheme-based system– Extensive library, interfaces and features– Multilevel integration options Interfaces to instrumentation systems,visualization tools, XDR specificationsemstySrfoPeceanrmD. Rover - MSU - 4/200033
Visual ObjectsemstySrfoPeceanrmD. Rover - MSU - 4/200034
EPIRAAEvent Processing & Information Rendering Architecturefor High-Level Visual Objects (HLVOs)emstySrfoPeceanrmD. Rover - MSU - 4/200035
VOMLVisual Object Markup Language Prototyping of HLVOs SGML Document TypeDefinition Higher level elements Relations between elements Reusable softwarecomponents Component semantics viaembedded Scheme onir-componentD. Rover - MSU - 4/200036
PGRT DisplaysemstySrfoPeceanrmD. Rover - MSU - 4/200037
Outline What is performance visualization?Instrumentation systemsVisualization systemsPGRT infrastructure– Visual objects & VOML Uniform resource visualizationemstySrfoPe– Components– CompositionceanrmD. Rover - MSU - 4/200038
Uniformrm Resource Visualization URV is a component-based strategy– Constructing performance visualizations Composing system-level views Sharing visualization design knowledge Describing visualizations and their interfacesuniformly– Monitoring and analyzing parallel &distributed systemsemstySrfoPeceanrm Viewing different resources, levels in acoordinated frameworkD. Rover - MSU - 4/200039
Visualization Construction Two independently executingcomponents– Resource-monitoring component Physical entity, e.g., processor Logical entity, e.g., array– Visualization component– Connected by a collaboration– Mapped onto EPIRA– Written within VOMLemstySrfoPeceanrmD. Rover - MSU - 4/200040
System Visualization cesemstySrfoPeceanrmLEVELRESOURCENODED. Rover - MSU - 4/200041
ENODED. Rover - MSU - 4/200042
ENODED. Rover - MSU - 4/200043
ENODED. Rover - MSU - 4/200044
ENODED. Rover - MSU - 4/200045
Visualization Standards Resource Mon component– Monitoring and controlservices for a resourceemstySrfoPeceanrmD. Rover - MSU - 4/200046
Visualization Standards Resource Mon component– Monitoring and controlservices for a resource Visualization component– Implementation of VOMLhigh-level visual objectemstySrfoPeceanrmD. Rover - MSU - 4/200047
Visualization Standards Resource Mon component– Monitoring and controlservices for a resource Visualization component– Implementation of VOMLhigh-level visual object Component interfaceemstySrfoPe– Set of services provided toand required of otherD. Rover - MSU - 4/2000componentsceanrm48
Plug-in Metaphorphor Collaboration– Description of connectionbetween services– More complex thanbinding the names ofservicesemstySrfoPeceanrm Buffer types Synchronization between asingle resource andmultiple visualizationsD. Rover - MSU - 4/200049
Plug-in Metaphor Standardization– Specialize a genericvisualization to an interfacevia a collaboration Services {v1, v2, , vn}provide generic data flows– Reuse visualization withany resource in family thatshares same interfaceemstySrfoPeceanrm Resource interface definesservices {r1, r2, , rn}D. Rover - MSU - 4/200050
EPIRA Mapping Visualization components -- IR Resource-mon components -- EP Collaborations -- Info & Control StructuresIREPemstySrfoPeceanrmD. Rover - MSU - 4/2000Info &Control51
Visualization Design Knowledgewledge Description of a component– Concept: what the component does– Content: how the concept is implementedand can be specialized– Context: the domain in which thecomponent may be applied Searchable component specifications Reusable design features, visualizationprinciplesemstySrfoPeceanrmD. Rover - MSU - 4/200052
Visualization Composition Composition creates system-level viewsrepresenting multiple resources.– Two resources, Res1 and Res2– Visualization issues Synchronization AbstractionURVsResourcesemstySrfoPeceanrmD. Rover - MSU - 4/200053
Visualization Composition Synchronization– Separate views may cause incorrectcorrelations Interprocess communication Network traffic– Composition: synchronize/join (spatiallyand temporally) into a single graph basedon a common independent variableemstySrfoPeceanrmD. Rover - MSU - 4/200054
Visualization Composition Abstraction– Separate views may hide multidimensionalinformation and relationships Interprocess communication Network traffic– Composition: synthesize information Process matrix of network trafficemstySrfoPeceanrmD. Rover - MSU - 4/200055
Visualization Composition Two types– Union : set of concrete transformationrules Transformational approach: binary functiontakes two URVs and constructs a third URV Composition transform: matches multiple URVview descriptions and replaces them with asynchronized, but functionally equivalent, view– Synthesis : design activity supported bya frameworkemstySrfoPeceanrmD. Rover - MSU - 4/200056
Union – Aggregate of Res1 and Res2 unchanged– Collaboration replaced via transformation– Visualization replaced via transformation Aggregate of separate visualizationcomponents Vis1 and Vis2 Replaced by new visualization Vis3emstySrfoPeceanrmD. Rover - MSU - 4/200057
Union emstyS– Services {r1, r2, , rn}define the interface to theaggregate resource– Aggregrate resource iscoupled with acollaboration that namesservices {v1, v2, , vn}– Interface to newvisualization component isplug-compatible with {v1,v2, , vn}rfoPeceanrmD. Rover - MSU - 4/200058
Synthesis Conscious activity by a human designerthat cannot be automated fully Indexing of URVs and visualizationcomponents according to aclassification scheme Designer specifies a set of searchattributes to guide the search for acomponentemstySrfoPeceanrmD. Rover - MSU - 4/200059
Synthesis emstySrfoPeceanrmD. Rover - MSU - 4/200060
Synthesis emstySrfoPeceanrmD. Rover - MSU - 4/200061
Instrumentation System Support Challenge:integration ofperformance datafrom unrelatedresourcesemstyS– ISM: proxy forresources– Resource monitorsregister themselveswith the ISMrfoPeceanrmD. Rover - MSU - 4/200062
Features of URVRV Usability JReusability r r Multi-level, composable, reusable, distributablecomponents (URV software architecture) r J Uniform descriptions of views forhardware/software resources r J Framework for developers to supply andcatalog URVs emstyS r J Rule-based visualization compositionJ Access to performance viewsr J Capture D.ofRovervisualization design practices- MSU - 4/2000rfoPeceanrm63
Georgia Institute of Technology’s POLKA animation of a parallel minimum spanning tree program. The left view shows the graph and the spanning tree growing inside it. The right view shows the “closest” data structure maintained by the program. Cha