Transcription
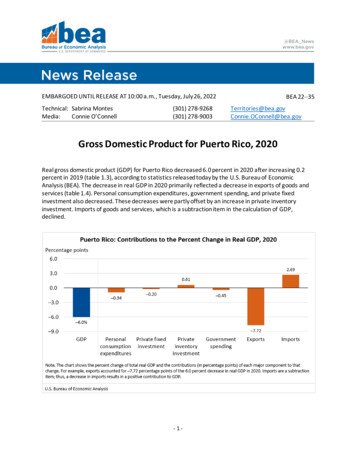
BEA 22– 35EMBARGOED UNTIL RELEASE AT 10:00 a.m., Tuesday, July 26, 2022Technical: Sabrina MontesMedia:Connie O’Connell(301) 278-9268(301) Gross Domestic Product for Puerto Rico, 2020Real gross domestic product (GDP) for Puerto Rico decreased 6.0 percent in 2020 after increasing 0.2percent in 2019 (table 1.3), according to statistics released today by the U.S. Bureau of EconomicAnalysis (BEA). The decrease in real GDP in 2020 primarily reflected a decrease in exports of goods andservices (table 1.4). Personal consumption expenditures, government spending, and private fixedinvestment also decreased. These decreases were partly offset by an increase in private inventoryinvestment. Imports of goods and services, which is a subtraction item in the calculation of GDP,declined.-1-
Coronavirus (COVID–19) Impact on the 2020 Puerto Rico GDP EstimateThe Puerto Rico economy was affected by the COVID–19 pandemic due to its effects on spending byconsumers, visitors, businesses, and governments. The Puerto Rico government implementedvarious measures to prevent the spread of the virus, including curfew orders and lockdowns of nonessential activities. The U.S. government passed several laws to support and sustain businesses andindividuals through the pandemic. Expenditures funded by the various federal grants and transferpayments are reflected in the GDP estimates. However, the full effects of the pandemic cannot bequantified in the GDP statistics for Puerto Rico, because the impacts are generally embedded insource data and cannot be separately identified.Exports decreased 10.9 percent (table 3.3). Exports of goods decreased 8.3 percent while exports ofservices decreased 22.7 percent. The leading contributor to the decrease in exports of goods was pharmaceuticals and organicchemicals (table 3.4). Medical and scientific equipment and appliances—which is embeddedwithin consumer goods and within capital goods including parts—was also a leading contributorto the decrease in exports of goods. The leading contributor to the decrease in exports of services was travel services, which includesgoods and services purchased by visitors. Exports of travel services decreased 51.3 percent,largely reflecting decreases in cruise and air visitors due to the COVID–19 pandemic. Datapublished by the Puerto Rico Institute of Statistics show the total number of inbound airpassengers decreased 51.9 percent; cruise ship passengers reported by the Puerto Rico PortsAuthority decreased 72.5 percent.Personal consumption expenditures decreased 1.8 percent (table 2.3), primarily reflecting a decline inservices (table 2.4). Food services and accommodations, “other” services (which includes services suchas transportation, recreation, and education), and health care decreased, as nonessential businessesthroughout the territory were subject to mandatory reductions in operations due to the COVID–19pandemic.Government spending decreased 3.2 percent (table 1.3). Spending decreased among all levels ofgovernment, reflecting pandemic-related reductions in operations and declines in disaster recoveryactivities associated with the 2017 hurricanes. Although central and municipal government spending in2020 was supported by Coronavirus Relief Fund payments, prior-year spending was elevated due toexpenditures funded by federal disaster grants.Private fixed investment decreased 1.6 percent (table 4.2.3), primarily reflecting a decline in structuresinvestment (table 4.2.4). Within structures, residential structures investment decreased 14.4 percent,reaching the lowest level of any year shown in BEA’s estimates (table 4.2.2). Nonresidential structuresinvestment decreased 5.2 percent but remained at elevated levels, reflecting ongoing projects to rebuildand improve telecommunications infrastructure and hotel and lodging establishments.The estimates of GDP and its components include production owned by nonresidents, such asnonresident multinational enterprises. In Puerto Rico, subsidiaries of large nonresident multinational-2-
enterprises operate within the pharmaceutical manufacturing industry as well as within the medicaldevice manufacturing and computer services industries. The box “Exported Intellectual PropertyIntensive Products Are Key Drivers of Puerto Rico GDP” in the “Technical Note” provides an update ofresearch provided in earlier releases that shows GDP excluding exports, imports, and private inventoryinvestment associated with these intellectual property-intensive industries.Updates to Puerto Rico GDPEstimates of GDP and its components for 2017–2019 that were released on September 27, 2021,have been revised to incorporate updates to source data.Due to lags in the availability of key data sources used in the estimation of Puerto Rico GDP, thestatistics presented today for 2020 are preliminary estimates. In addition to expected lags in theavailability of data for private inventory investment and central government spending, otherinformation typically published by the Puerto Rico government was not available in time forincorporation into this year’s estimates of GDP. As additional source data become available, BEA willincorporate the information and will release updated estimates once a year.For more information on updates to previously published estimates and data availability, see the“Technical Note.”AcknowledgmentsBecause Puerto Rico is not included in most of the major surveys used by BEA to estimate U.S. GDP,the support and assistance provided by the government of Puerto Rico has been critical to thesuccessful production of these estimates. BEA appreciates the information provided by numerousorganizations and individuals in Puerto Rico, including (in alphabetical order) the following: Economic Development Bank for Puerto Rico, Office of Economic StudiesOffice of the Commissioner of Insurance of Puerto RicoPuerto Rico Department of Economic Development and CommercePuerto Rico Department of Labor and Human ResourcesPuerto Rico Department of the TreasuryPuerto Rico Electric Power AuthorityPuerto Rico Industrial Development CompanyPuerto Rico Institute of StatisticsPuerto Rico Planning BoardPuerto Rico Ports AuthorityNext release: Summer 2023Gross Domestic Product for Puerto Rico, 2021-3-
Additional InformationResources Net exports of goods and services is the differencebetween exports of goods and services and imports ofgoods and services. Exports measures the portion of totalPuerto Rico production of goods and services that isprovided to the rest of the world. Imports measures theportion of total Puerto Rico expenditures that is accountedfor by goods and services provided by the rest of the world.Stay informed about BEA developments byreading The BEA Wire, signing up for BEA’s emailsubscription service, or following BEA on Twitter@BEA News.Historical time series for gross domestic productfor the U.S. territories can be accessed at BEA’swebsite.For more on BEA’s statistics, see our onlinejournal, the Survey of Current Business.For upcoming economic indicators, see BEA’snews release schedule.Government consumption expenditures and grossinvestment, or “government spending,” measures theportion of GDP that is accounted for by the governmentsector. Government consumption expenditures consists ofspending by government to produce and provide servicesto the public. Gross investment consists of spending bygovernment for fixed assets that directly benefit the publicor that assist government agencies in their productionactivities.DefinitionsGross domestic product (GDP) is the value of the goods andservices produced by the Puerto Rico economy less thevalue of the goods and services used up in production. GDPis also equal to the sum of personal consumptionexpenditures, private fixed investment, change in privateinventories, net exports of goods and services, andgovernment consumption expenditures and grossinvestment.Current-dollar estimates are valued in the prices of theperiod when the transactions occurred—that is, at “marketvalue” (also referred to as “nominal estimates” or as“current-price estimates”).Real values are inflation-adjusted estimates—that is,estimates that exclude the effects of price changes.Preliminary estimates are based on source data that areincomplete and subject to revision.Personal consumption expenditures measures the goodsand services purchased by “persons”—that is, byhouseholds and by nonprofit institutions servinghouseholds—who are resident in Puerto Rico.Statistical conventionsQuantities (or “real” volume measures) and prices areexpressed as index numbers with a specified reference yearequal to 100 (currently 2012). Quantity and price indexesare calculated using a Fisher chain-weighted formula thatincorporates weights from two adjacent years. “Real” dollarseries are calculated by multiplying the quantity index bythe current-dollar value in the reference year and thendividing by 100.Private fixed investment measures spending by privatebusinesses, nonprofit institutions, and households on fixedassets in the Puerto Rico economy. Fixed assets consist ofstructures, equipment, and intellectual property productsthat are used in the production of goods and services.Change in private inventories, or “private inventoryinvestment,” is a measure of the value of the change in thephysical volume of the inventories—additions lesswithdrawals—that businesses maintain to support theirproduction and distribution activities.Chained-dollar values are not additive, because the relativeweights for a given period differ from those of the referenceyear.-4-
News Release TablesTable 1.1.Table 1.2.Table 1.3.Table 1.4.Table 2.1.Table 2.2.Table 2.3.Table 2.4.Table 3.1.Table 3.2.Table 3.3.Table 3.4.Table 4.1.1.Table 4.1.2.Table 4.1.3.Table 4.2.1.Table 4.2.2.Table 4.2.3.Table 4.2.4.Gross Domestic ProductReal Gross Domestic ProductPercent Change from Preceding Year in Real Gross Domestic ProductContributions to Percent Change in Real Gross Domestic ProductPersonal Consumption Expenditures by TypeReal Personal Consumption Expenditures by TypePercent Change from Preceding Year in Real Personal Consumption Expenditures byTypeContributions to Percent Change in Real Personal Consumption Expenditures by TypeExports and Imports of Goods and Services by Type of ProductReal Exports and Imports of Goods and Services by Type of ProductPercent Change from Preceding Year in Real Exports and in Real Imports of Goods andServices by Type of ProductContributions to Percent Change in Real Exports and Real Imports of Goods and Servicesby Type of ProductGross Domestic Investment by TypeReal Gross Domestic Investment by TypePercent Change from Preceding Year in Real Gross Domestic Investment by TypePrivate Fixed Investment by TypeReal Private Fixed Investment by TypePercent Change from Preceding Year in Real Private Fixed Investment by TypeContributions to Percent Change in Real Private Fixed Investment by Type-5-
Puerto RicoTuesday, July 26, 2022 / Martes, 26 de julio de 2022Table 1.1. Gross Domestic Product / Tabla 1.1. Producto interior bruto[Millions of dollars] / [Millones de dólares]Line1 Gross domestic product.2Personal consumption expenditures.3Goods.4Durable goods.5Nondurable goods.6Services.7Net foreign travel.8Gross private domestic investment.9Fixed tial.13Equipment.14Intellectual property products.15Change in private inventories.16Net exports of goods and Goods.22Services.23Government consumption expendituresand gross 817,4724,00110,8342,63715,3993,4369,4122,550r Revised / r Revisadasp Preliminary / p PreliminaresNote. Detail may not add to total because of rounding. / Nota: Las partidas detalladas pudieran no sumar a los totales debido al redondeo.Source. U.S. Bureau of Economic Analysis / Fuente: Negociado de Análisis Económico de EE. UU.2020p105,428 Producto interior bruto56,238 Gastos de consumo personal24,760Bienes7,310Bienes duraderos17,450Bienes no duraderos32,909Servicios–1,431Viajes al exterior, neto14,112 Inversión privada interna bruta13,522Inversión fija2,470Estructuras611Residencial1,859No residencial5,780Equipo5,272Productos de propiedad intelectual590Cambios en inventarios privados19,896 Exportaciones netas de bienes y Gastos de consumo e inversión 479Municipal
Puerto RicoTuesday, July 26, 2022 / Martes, 26 de julio de 2022Table 1.2. Real Gross Domestic Product / Tabla 1.2. Producto interior bruto real[Millions of chained (2012) dollars] / [Millones de dólares encadenados (2012)]Line1 Gross domestic product.2Personal consumption expenditures.3Goods.4Durable goods.5Nondurable goods.6Services.7Net foreign travel.8Gross private domestic investment.9Fixed tial.13Equipment.14Intellectual property products.15Change in private inventories.16Net exports of goods and Goods.22Services.23Government consumption expendituresand gross ,3923,54110,2962,48414,2632,9628,8662,381r Revised / r Revisadasp Preliminary / p PreliminaresSource. U.S. Bureau of Economic Analysis / Fuente: Negociado de Análisis Económico de EE. UU.2020p93,365 Producto interior bruto53,318 Gastos de consumo personal24,189Bienes7,728Bienes duraderos16,535Bienes no duraderos30,422Servicios–1,265Viajes al exterior, neto13,458 Inversión privada interna bruta12,805Inversión fija2,328Estructuras455Residencial1,962No residencial5,772Equipo4,676Productos de propiedad intelectual468Cambios en inventarios privados14,896 Exportaciones netas de bienes y Gastos de consumo e inversión 241Municipal
Puerto RicoTuesday, July 26, 2022 / Martes, 26 de julio de 2022Table 1.3. Percent Change from Preceding Year in Real Gross Domestic Product / Tabla 1.3. Cambio porcentual del producto interior bruto real respecto al año previo[Percent] / [Por ciento]Line1 Gross domestic product.2Personal consumption expenditures.3Goods.4Durable goods.5Nondurable goods.6Services.7Net foreign travel.8Gross private domestic investment.9Fixed tial.13Equipment.14Intellectual property products.15Change in private inventories.16Net exports of goods and Goods.22Services.23Government consumption expendituresand gross investment.24Federal.25Central.26Municipal.2012* . . . . . . . . . . . . . . . . . . . . . .20132.5–0.10.50.30.5–0.2 .–6.4–0.7–7.5–15.8–2.6–2.26.4 . –2.1–0.7 .4.60.0–2.9–9.40.7–2.14.9 . 1.9–1.0 .–1.8–0.7–0.9–0.1–1.3–2.31.6 . .3.93.84.51.31.40.92016–3.5–0.11.52.81.0–1.2 .5.60.6–6.0–11.0–3.2–1.06.1 . .1–4.8 .–9.26.6–5.0–10.3–2.211.06.6 . .56.724.80.30.7 .62.818.143.626.851.917.87.9 . 4.3–2.33.1 .–19.20.34.6–10.310.9–8.09.2 . .0.60.80.1–9.1–10.51.8 . . . –4.2r Revised / r Revisadasp Preliminary / p Preliminares* Not available / * No disponibleNote. Percent changes are not shown for net series. / Nota: Los cambios porcentuales no se muestran para las series netas.Source. U.S. Bureau of Economic Analysis / Fuente: Negociado de Análisis Económico de EE. UU.2020p–6.0 Producto interior bruto–1.8 Gastos de consumo personal–0.3Bienes–1.8Bienes duraderos0.3Bienes no duraderos–6.5Servicios .Viajes al exterior, neto3.3 Inversión privada interna bruta–1.6Inversión fija–7.6Estructuras–14.4Residencial–5.2No residencial–0.3Equipo0.0Productos de propiedad intelectual .Cambios en inventarios privados . Exportaciones netas de bienes y iosGastos de consumo e inversión –5.9Municipal
Puerto RicoTuesday, July 26, 2022 / Martes, 26 de julio de 2022Table 1.4. Contributions to Percent Change in Real Gross Domestic Product / Tabla 1.4. Contribuciones al cambio porcentual en el producto interior bruto real[Percentage points] / [Puntos porcentuales]Line12012*Percent change:Gross domestic product.Percentage points:Personal consumption expenditures.Goods.Durable goods.Nondurable goods.Services.Net foreign travel.Gross private domestic investment.Fixed quipment.Intellectual property products.Change in private inventories.Net exports of goods and ices.Government consumption expendituresand gross 2018r2019r2020pCambio porcentual:–6.0 Producto interior bruto .2.53.51.1–3.5–4.6–2.80.2 . . . . . . . . . . . . . . . . . . . . –4.83–2.892.692.190.50 . . . 0.14r Revised / r Revisadasp Preliminary / p Preliminares* Not available / * No disponibleSource. U.S. Bureau of Economic Analysis / Fuente: Negociado de Análisis Económico de EE. UU.Puntos porcentuales:Gastos de consumo personalBienesBienes duraderosBienes no duraderosServiciosViajes al exterior, netoInversión privada interna brutaInversión fijaEstructurasResidencialNo residencialEquipoProductos de propiedad intelectualCambios en inventarios privadosExportaciones netas de bienes y BienesServiciosGastos de consumo e inversión brutagubernamentalFederalCentralMunicipal
Puerto RicoTuesday, July 26, 2022 / Martes, 26 de julio de 2022Table 2.1. Personal Consumption Expenditures by Type / Tabla 2.1. Gastos de consumo personal por tipo[Millions of dollars] / [Millones de dólares]Line1 Personal consumption expenditures.2Goods.3Durable goods.4Motor vehicles and parts.5Other durable goods.6Nondurable goods.7Food and beverages.8Gasoline and other energy goods.9Other nondurable goods.10Services.11Housing and utilities.12Health care.13Food services and accommodations.14Other services.15Net foreign 33,79611,2686,6464,19011,692–2,344r Revised / r Revisadasp Preliminary / p PreliminaresNote. Detail may not add to total because of rounding. / Nota: Las partidas detalladas pudieran no sumar a los totales debido al redondeo.Source. U.S. Bureau of Economic Analysis / Fuente: Negociado de Análisis Económico de EE. 211,0417,3644,43012,478–2,7432020p56,238 Gastos de consumo personal24,760 Bienes7,310Bienes duraderos2,999Vehículos de motor y piezas4,311Otros bienes duraderos17,450Bienes no duraderos6,958Alimentos y bebidas1,195Gasolina y otros bienes energéticos9,297Otros bienes no duraderos32,909 Servicios11,176Vivienda y utilidades7,088Cuidado médico3,151Servicios de alimentos y alojamiento11,495Otros servicios–1,431 Viajes al exterior, neto
Puerto RicoTuesday, July 26, 2022 / Martes, 26 de julio de 2022Table 2.2. Real Personal Consumption Expenditures by Type / Tabla 2.2. Gastos reales de consumo personal por tipo[Millions of chained (2012) dollars] / [Millones de dólares encadenados (2012)]Line1 Personal consumption expenditures (PCE).2Goods.
largely reflecting decreases in cruise and air visitors due to the COVID-19 pandemic. Data published by the Puerto Rico Institute of Statistics show the total number of inbound air passengers decreased 51.9 percent; cruise ship passengers reported by the Puerto Rico Ports Authority decreased 72.5 percent.