Transcription
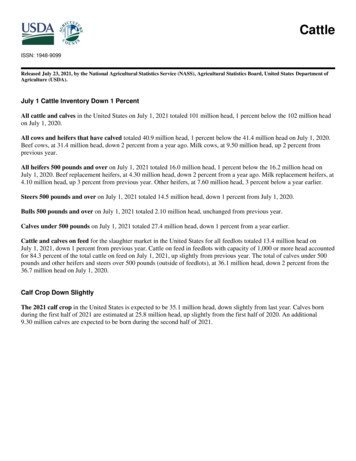
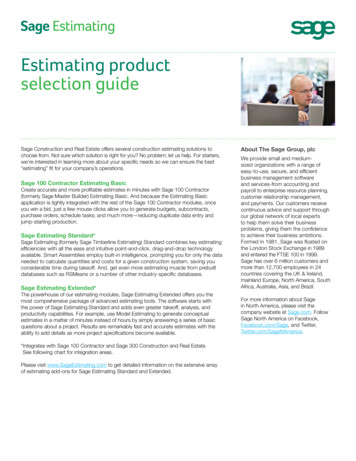
EMBARGOED UNTIL RELEASE AT 8:30 A.M. EST, WEDNESDAY, NOVEMBER 24, 2021Technical:Media:Karl Rohrer (GDP)Kate Pinard (Corporate Profits)Jeannine Aversa(301) 278-9083(301) 278-9417(301) 278-9003BEA bea.govGross Domestic Product (Second Estimate)Corporate Profits (Preliminary Estimate)Third Quarter 2021Real gross domestic product (GDP) increased at an annual rate of 2.1 percent in the third quarter of2021 (table 1), according to the "second" estimate released by the Bureau of Economic Analysis. In thesecond quarter, real GDP increased 6.7 percent.The GDP estimate released today is based on more complete source data than were available for the"advance" estimate issued last month. In the advance estimate, the increase in real GDP was 2.0percent. The update primarily reflects upward revisions to personal consumption expenditures (PCE)and private inventory investment (refer to "Updates to GDP").Real GDP: Percent change from preceding quarter3525155-5-15-25-35Q42017Q1Q2Q32018U.S. Bureau of Economic ally adjusted at annual rates
COVID-19 Impact on the Third-Quarter 2021 GDP EstimateThe increase in third quarter GDP reflected the continued economic impact of the COVID-19pandemic. A resurgence of COVID-19 cases resulted in new restrictions and delays in thereopening of establishments in some parts of the country. Government assistance paymentsin the form of forgivable loans to businesses, grants to state and local governments, andsocial benefits to households all decreased. The full economic effects of the COVID-19pandemic cannot be quantified in the GDP estimate for the third quarter because theimpacts are generally embedded in source data and cannot be separately identified. Formore information, refer to the Technical Note and Federal Recovery Programs and BEAStatistics.The increase in real GDP in the third quarter reflected increases in private inventory investment, PCE,state and local government spending, and nonresidential fixed investment that were partly offset bydecreases in residential fixed investment, federal government spending, and exports. Imports , which area subtraction in the calculation of GDP, increased (table 2).The increase in private inventory investment reflected increases in wholesale trade (led by nondurablegoods industries) and in retail trade (led by motor vehicles and parts dealers). The increase in PCEreflected an increase in services that was partly offset by a decrease in goods. Within services, increaseswere widespread with the largest contributions coming from “other” services (mainly internationaltravel), transportation services, and health care. The decrease in goods primarily reflected a decrease inspending on motor vehicles and parts. The increase in state and local government spending was led byemployee compensation (notably, education). The increase in nonresidential fixed investment reflectedan increase in intellectual property products (led by software and research and development) that waspartly offset by decreases in structures and equipment.The decrease in residential fixed investment primarily reflected decreases in improvements and in newsingle-family structures. The decrease in federal government spending primarily reflected a decrease innondefense spending on intermediate goods and services after the processing and administration ofPaycheck Protection Program loan applications by banks on behalf of the federal government ended inthe second quarter. The decrease in exports reflected a decrease in goods that was partly offset by anincrease in services. The increase in imports primarily reflected an increase in services (led by travel andtransport).The deceleration in real GDP in the third quarter was more than accounted for by a slowdown in PCE.From the second quarter to the third quarter, spending for goods turned down (led by motor vehiclesand parts) and services decelerated (led by food services and accommodations).Current-dollar GDP increased 8.1 percent at an annual rate, or 446.0 billion, in the third quarter to alevel of 23.19 trillion. In the second quarter, GDP increased 13.4 percent, or 702.8 billion (table 1 andtable 3). More information on the source data that underlie the estimates is available in the "Key SourceData and Assumptions" file (available at 10 A.M.) on BEA’s website.The price index for gross domestic purchases increased 5.5 percent in the third quarter, compared withan increase of 5.8 percent in the second quarter (table 4). The PCE price index increased 5.3 percent,compared with an increase of 6.5 percent. Excluding food and energy prices, the PCE price indexincreased 4.5 percent, compared with an increase of 6.1 percent.-2-
Gross Domestic income and Corporate ProfitsReal gross domestic income (GDI) increased 6.7 percent in the third quarter, compared with an increaseof 4.3 percent (revised) in the second quarter. The average of real GDP and real GDI, a supplementalmeasure of U.S. economic activity that equally weights GDP and GDI, increased 4.4 percent in the thirdquarter, compared with an increase of 5.5 percent in the second quarter (table 1).Profits from current production (corporate profits with inventory valuation and capital consumptionadjustments) increased 121.4 billion in the third quarter, compared with an increase of 267.8 billion inthe second quarter (table 10).Profits of domestic financial corporations increased 13.7 billion in the third quarter, compared with anincrease of 52.8 billion in the second quarter. Profits of domestic nonfinancial corporations increased 67.5 billion, compared with an increase of 221.3 billion. Rest-of-the-world profits increased 40.1billion, in contrast to a decrease of 6.2 billion. In the third quarter, receipts increased 43.1 billion, andpayments increased 3.0 billion.Updates to GDPIn the second estimate for the third quarter, real GDP increased 2.1 percent, 0.1 percentage point higherthan in the advance estimate. Upward revisions to PCE, private inventory investment, and state andlocal government spending were partly offset by downward revisions to exports, nonresidential fixedinvestment, residential fixed investment, and federal government spending. Imports, which are asubtraction in the calculation of GDP, were revised down. For more information, refer to the TechnicalNote and the "Additional Information" section that follows.Real GDPCurrent-dollar GDPReal GDIAverage of Real GDP and Real GDIGross domestic purchases price indexPCE price indexPCE price index excluding food and energyAdvance EstimateSecond Estimate(Percent change from preceding quarter)2.02.17.88.1 6.7 4.45.45.55.35.34.54.5-3-
Updates to Second-Quarter Wages and SalariesIn addition to presenting updated estimates for the third quarter, today's release presents revisedestimates of second-quarter wages and salaries, personal taxes, and contributions for government socialinsurance, based on updated data from the Bureau of Labor Statistics Quarterly Census of Employmentand Wages program. Wages and salaries are now estimated to have increased 301.1 billion in thesecond quarter, an upward revision of 101.3 billion. Personal current taxes are now estimated to haveincreased 120.4 billion, an upward revision of 17.7 billion. Contributions for government socialinsurance are now estimated to have increased 38.4 billion, an upward revision of 13.5 billion. Withthe incorporation of these new data, real gross domestic income is now estimated to have increased 4.3percent in the second quarter, an upward revision of 2.0 percentage points from the previouslypublished estimate.***Next release, December 22, 2021 at 8:30 A.M. ESTGross Domestic Product (Third Estimate)Gross Domestic Product by IndustryCorporate Profits (Revised Estimate)Third Quarter 2021***Release Dates in 2022Estimate2021 Q4 andYear 20212022 Q1Gross Domestic ProductAdvance EstimateSecond EstimateThird EstimateJanuary 27, 2022February 24, 2022March 30, 2022April 28, 2022May 26, 2022June 29, 2022July 28, 2022October 27, 2022August 25, 2022November 30, 2022September 29, 2022 December 22, 2022Gross Domestic Productby IndustryMarch 30, 2022June 29, 2022September 29, 2022 December 22, 2022Corporate ProfitsPreliminary EstimateRevised Estimate--March 30, 2022May 26, 2022June 29, 2022August 25, 2022November 30, 2022September 29, 2022 December 22, 2022-4-2022 Q22022 Q3
Additional InformationResourcesReal values are inflation-adjusted estimates—that is,estimates that exclude the effects of price changes.Additional resources available at www.bea.gov: The gross domestic purchases price index measures theprices of final goods and services purchased by U.S.residents.Information on COVID-19 and recovery impactsis available on our website.Stay informed about BEA developments byreading the BEA blog, signing up for BEA’s emailsubscription service, or following BEA on Twitter@BEA News.Historical time series for these estimates can beaccessed in BEA’s interactive data application.Access BEA data by registering for BEA’s dataapplication programming interface (API).For more on BEA’s statistics, refer to ourmonthly online journal, the Survey of CurrentBusiness.BEA's news release scheduleNIPA Handbook: Concepts and Methods of theU.S. National Income and Product AccountsThe personal consumption expenditure price indexmeasures the prices paid for the goods and servicespurchased by, or on the behalf of, "persons."Personal income is the income received by, or on behalf of,all persons from all sources: from participation as laborersin production, from owning a home or business, from theownership of financial assets, and from government andbusiness in the form of transfers. It includes income fromdomestic sources as well as the rest of world. It does notinclude realized or unrealized capital gains or losses.Disposable personal income is the income available topersons for spending or saving. It is equal to personalincome less personal current taxes.DefinitionsPersonal outlays is the sum of personal consumptionexpenditures, personal interest payments, and personalcurrent transfer payments.Gross domestic product (GDP), or value added, is the valueof the goods and services produced by the nation’seconomy less the value of the goods and services used upin production. GDP is also equal to the sum of personalconsumption expenditures, gross private domesticinvestment, net exports of goods and services, andgovernment consumption expenditures and grossinvestment.Personal saving is personal income less personal outlaysand personal current taxes.The personal saving rate is personal saving as a percentageof disposable personal income.Profits from current production, referred to as corporateprofits with inventory valuation adjustment (IVA) andcapital consumption (CCAdj) adjustment in the NationalIncome and Product Accounts (NIPAs), is a measure of thenet income of corporations before deducting income taxesthat is consistent with the value of goods and servicesmeasured in GDP. The IVA and CCAdj are adjustments thatconvert inventory withdrawals and depreciation of fixedassets reported on a tax-return, historical-cost basis to thecurrent-cost economic measures used in the nationalincome and product accounts. Profits for domesticindustries reflect profits for all corporations located withinthe geographic borders of the United States. The rest-ofthe-world (ROW) component of profits is measured as thedifference between profits received from ROW and profitspaid to ROW.Gross domestic income (GDI) is the sum of incomes earnedand costs incurred in the production of GDP. In nationaleconomic accounting, GDP and GDI are conceptually equal.In practice, GDP and GDI differ because they areconstructed using largely independent source data.Gross output is the value of the goods and servicesproduced by the nation’s economy. It is principallymeasured using industry sales or receipts, including sales tofinal users (GDP) and sales to other industries (intermediateinputs).Current-dollar estimates are valued in the prices of theperiod when the transactions occurred—that is, at "marketvalue." Also referred to as "nominal estimates" or as"current-price estimates."For more definitions, refer to the Glossary: National Incomeand Product Accounts.-5-
Updates to GDPStatistical conventionsBEA releases three vintages of the current quarterlyestimate for GDP. "Advance" estimates are released nearthe end of the first month following the end of the quarterand are based on source data that are incomplete or subjectto further revision by the source agency. "Second" and"third" estimates are released near the end of the secondand third months, respectively, and are based on moredetailed and more comprehensive data as they becomeavailable.Annual-vs-quarterly rates. Quarterly seasonally adjustedvalues are expressed at annual rates, unless otherwisespecified. This convention is used for BEA’s featured,seasonally adjusted measures to facilitate comparisonswith related and historical data. For details, refer to the FAQ“Why does BEA publish estimates at annual rates?”Quarterly not seasonally adjusted values are expressed onlyat quarterly rates.The table below shows the average revisions to thequarterly percent changes in real GDP between differentestimate vintages, without regard to sign.Percent changes. Percent changes in quarterly seasonallyadjusted series are displayed at annual rates, unlessotherwise specified. For details, refer to the FAQ “How isaverage annual growth calculated?” and “Why does BEApublish percent changes in quarterly series at annualrates?“ Percent changes in quarterly not seasonallyadjusted values are calculated from the same quarter oneyear ago. All published percent changes are calculated fromunrounded data.VintageAverage RevisionWithout Regard to Sign(percentage points, annual rates)Advance to second0.5Advance to third0.6Second to third0.3Note - Based on estimates from 1996 through 2020. Formore information on GDP updates, refer to RevisionInformation on the BEA website.Calendar years and quarters. Unless noted otherwise,annual and quarterly data are presented on a calendarbasis.Quantities and prices. Quantities, or "real" volumemeasures, and prices are expressed as index numbers witha specified reference year equal to 100 (currently 2012).Quantity and price indexes are calculated using a Fisherchained weighted formula that incorporates weights fromtwo adjacent periods (quarters for quarterly data andannuals for annual data). For details on the calculation ofquantity and price indexes, refer to Chapter 4: EstimatingMethods in the NIPA Handbook.Annual and comprehensive updates are typically releasedin late July. Annual updates generally cover at least the 5most recent calendar years (and their associated quarters)and incorporate newly available major annual source dataas well as some changes in methods and definitions toimprove the accounts. Comprehensive (or benchmark)updates are carried out at about 5-year intervals andincorporate major periodic source data, as well as majorconceptual improvements.Chained-dollar values are calculated by multiplying thequantity index by the current dollar value in the referenceyear (2012) and then dividing by 100. Percent changescalculated from real quantity indexes and chained-dollarlevels are conceptually the same; any differences are due torounding. Chained-dollar values are not additive becausethe relative weights for a given period differ from those ofthe reference year. In tables that display chained-dollarvalues, a "residual" line shows the difference between thesum of detailed chained-dollar series and its correspondingaggregate.Unlike GDP, advance current quarterly estimates of GDI andcorporate profits are not released because data ondomestic profits and on net interest of domestic industriesare not available. For fourth quarter estimates, these dataare not available until the third estimate.GDP by industry and gross output estimates are releasedwith the third estimate of GDP.-6-
List of GDP News Release TablesTable 1. Real Gross Domestic Product and Related Measures: Percent Change from Preceding PeriodTable 2. Contributions to Percent Change in Real Gross Domestic ProductTable 3. Gross Domestic Product: Level and Change from Preceding PeriodTable 4. Price Indexes for Gross Domestic Product and Related Measures: Percent Change from Preceding PeriodTable 5. Real Gross Domestic Product: Annual Percent ChangeTable 6. Real Gross Domestic Product: Percent Change from Quarter One Year AgoTable 7. Relation of Gross Domestic Product, Gross National Product, and National IncomeTable 8. Personal Income and Its DispositionTable 9. Corporate Profits: Level and Percent ChangeTable 10. Corporate Profits by Industry: Level and Change from Preceding PeriodTable 11. Gross Value Added of Nonfinancial Domestic Corporate BusinessAppendix Table A. Real Gross Domestic Product and Related Aggregates: Percent Change from Preceding Period andContributions to Percent ChangeAppendix Table B. Not Seasonally Adjusted Real Gross Domestic Product: Level and Percent Change from Quarter One Year Ago-7-
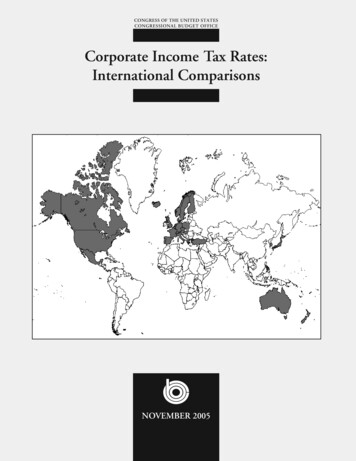
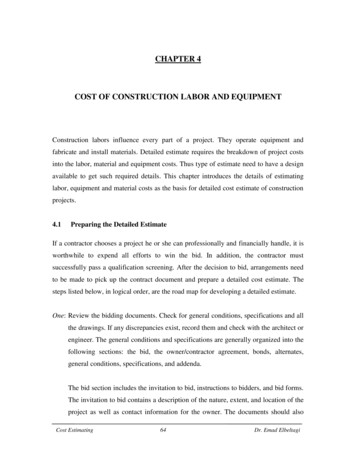
November 24, 2021Table 1. Real Gross Domestic Product and Related Measures: Percent Change from Preceding PeriodSeasonally adjusted at annual 2627282930313233343536373839404142432018 2019 2020 2017Gross domestic product (GDP)Personal consumption expendituresGoodsDurable goodsNondurable goodsServicesGross private domestic investmentFixed ctual property productsResidentialChange in private inventoriesNet exports of goods and vernment consumptionexpenditures and gross investmentFederalNational defenseNondefenseState and localAddenda:Gross domestic income (GDI) 1Average of GDP and GDIFinal sales of domestic productGross domestic purchasesFinal sales to domestic purchasersFinal sales to private domesticpurchasersGross national product (GNP)Disposable personal incomeCurrent-dollar measures:GDPGDIAverage of GDP and GDIFinal sales of domestic productGross domestic purchasesFinal sales to domestic purchasersFinal sales to private domesticpurchasersGNPDisposable personal 6.09.310.62.22021Q2 7.7.66.410.47.14.323.6LineQ3 .55.02.98.10.92.8 0.94.9 1.85.4 -1.24.1 6.31.7 0.32.8 1.0 -0.8 2.7 5.05.1 3.4 1.9 1.4 8.97.9 3.5 6.8 5.2 4.21.1 3.4 -5.0 -3.9 16.21.5 -0.5 -2.4 3.5 2.72.13.64.52.21.13.0 3.7 3.9 -2.1 -0.5 4.2 -2.0 0.9 223.5 2.4 20.6 -5.4 -3.1 11.3 -5.3 -4.9 236.0 -0.7 3.2 1.7 5.3 -5.8 -1.1 -1.6 240.0 7.4 50.1 -14.3 -14.1 40.8 -10.7 -9.3 252.7 4.4 -5.5 0.1 1.2 -0.1 0.2 4.7 83.64.20.91.93.12.63.03.02.42.90.51.53.32.83.42.4 -3.62.1 -3.62.3 2 4.11.7 3.63.6 -1.43.22.72.31.1 -6.0 -32.8 38.4 6.2 11.8 10.1 1.1 321.6 -5.4 -31.9 34.8 4.9 5.9 6.5 2.3 332.4 3.1 48.5 -16.6 -8.3 54.7 -29.1 -4.0 3.74.13.64.74.14.52.02.85.45.35.63.9 -2.43.9 -2.43.8 02.94.16.76.01.34.34.13.42.5 -4.8 -33.5 43.1 7.9 16.0 16.83.3 -4.2 -33.0 39.8 7.0 10.4 13.14.1 4.3 46.1 -13.6 -6.9 60.6 -24.5r Revised. Revisions include changes to series affected by the incorporation of revised wage and salary estimates for the second quarter of 2021.1. Gross domestic income deflated by the implicit price deflator for gross domestic product.Source: U.S. Bureau of Economic 31.8-28.024.4 19.6 6.329.0 11.9 6.325.9 3.4 9.137.8 6.1 7.729.9 5.0 31415161718192021272829303138.7 6.6 10.9 13.4 8.1 3529.0 22.0 10.9 10.8 12.9 3633.8 14.0 10.9 12.1 10.5 3730.4 5.7 14.0 14.9 6.0 3842.4 7.7 11.9 13.0 8.8 3934.0 6.9 14.9 14.5 6.8 406.8 418.3 421.0 43
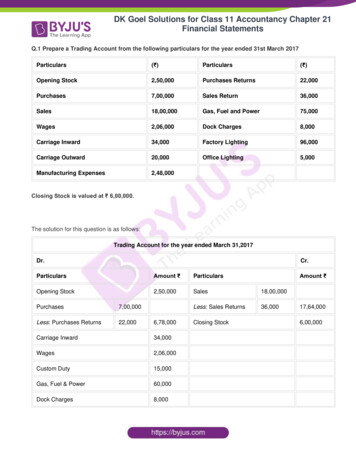
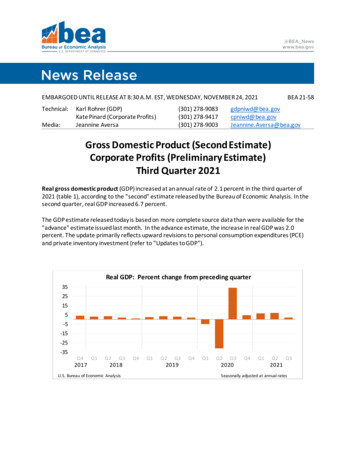
November 24, 2021Table 2. Contributions to Percent Change in Real Gross Domestic Product2018 2019 2020 051525354555657585960Percent change at annual rate:Gross domestic productPercentage points at annual rates:Personal consumption expendituresGoodsDurable goodsMotor vehicles and partsFurnishings and durablehousehold equipmentRecreational goods and vehiclesOther durable goodsNondurable goodsFood and beverages purchasedfor off-premises consumptionClothing and footwearGasoline and other energy goodsOther nondurable goodsServicesHousehold consumptionexpenditures (for services)Housing and utilitiesHealth careTransportation servicesRecreation servicesFood services andaccommodationsFinancial services and insuranceOther servicesFinal consumption expenditures ofnonprofit institutions servinghouseholdsGross output of nonprofit institutionsLess: Receipts from sales ofgoods and services by nonprofitinstitutionsGross private domestic investmentFixed tion processing equipmentIndustrial equipmentTransportation equipmentOther equipmentIntellectual property productsSoftwareResearch and developmentEntertainment, literary, andartistic originalsResidentialChange in private inventoriesFarmNonfarmNet exports of goods and vernment consumptionexpenditures and gross investmentFederalNational defenseConsumption expendituresGross investmentNondefenseConsumption expendituresGross investmentState and localConsumption expendituresGross investment2.92.3-3.43.8Q12018Q2Q33.13.41.96 1.48 -2.550.84 0.71 0.960.49 0.30 0.540.10 -0.03 0.082.88 1.641.70 0.301.03 0.260.43 -0.120.130.200.050.350.06 0.130.23 0.350.05 -0.010.40 0.420.260.300.040.670.110.05-0.010.191.130.10 0.37 0.26 0.040.06 -0.07 0.11 -0.010.00 -0.20 -0.05 -0.040.25 0.33 0.35 0.060.78 -3.52 1.18 1.341.040.180.300.100.060.870.110.370.080.04-3.85 1.140.13 0.36-0.97 0.25-0.59 0.20-0.82 -0.050.110.230.040.051.9Q40.9Seasonally adjusted at annual 091.79 1.16 0.430.61 0.44 0.290.27 0.08 -0.050.01 -0.03 -0.372.371.420.730.190.110.200.090.400.10 -0.060.15 0.090.00 0.070.34 0.370.170.370.000.690.010.250.060.340.08 0.04 0.08 -0.040.06 0.16 -0.02 0.000.05 -0.04 0.02 0.000.20 0.17 0.28 0.381.45 1.18 0.72 0.141.9-5.1 -31.2Q14.56.32.120.990.580.121.13 -4.79 -24.10 25.51 2.260.35 0.04 -1.89 9.92 -0.070.34 -0.89 0.01 5.49 0.100.16 -0.80 0.12 1.89 0.060.090.280.080.410.07 -0.02 -0.080.10 0.10 0.730.02 -0.17 -0.760.01 0.93 -1.900.29 0.25 -0.06 1.400.14 0.01 0.16 -0.670.03 -0.04 -0.07 -0.400.24 0.19 -0.01 0.590.95 1.13 0.77 -4.831.15 1.29 1.11 0.37 0.73 1.06 1.120.10 0.20 0.04 0.33 -0.01 -0.01 0.240.30 0.25 0.61 -0.18 0.64 0.57 0.180.21 -0.06 -0.09 0.04 0.12 0.17 0.180.24 0.00 0.09 0.02 -0.01 0.11 33.8Q42021Q2Line2.117.445.693.501.367.92 1.182.99 -2.111.01 -2.500.48 -2.1723451.11 -0.121.07 0.011.42 0.144.43 -0.170.820.840.482.190.00 -0.230.29 -0.160.24 0.061.98 0.396789-0.18 0.25 -0.18-0.91 2.08 0.06-0.81 0.74 -0.150.00 1.36 0.11-22.21 15.59 000.180.193.2910111213142.50 2.060.04 0.241.50 -0.500.09 0.090.10 1819-23.46 17.380.59 0.06-7.68 7.42-2.98 1.12-4.27 2.180.13 0.10 -1.040.08 -0.06 0.020.20 0.24 -0.570.12 0.190.11 0.120.16 -0.010.110.080.710.33 -0.07 0.04 0.180.00 -0.03 -0.16 -0.150.14 0.27 0.11 0.200.15 -0.01 -1.68 -5.590.00 0.11 -0.10 -0.020.39 0.18 -0.63 -3.500.09 -0.09 0.330.21 0.08 -0.200.030.140.160.540.06 0.35 -0.60 -0.110.39 -0.06 0.03 -0.010.01 -0.08 1.42 1.25 -1.78 -0.16 -0.31 -0.42 -0.12 230.00 0.02 -0.07 -1.58 0.84 0.66 -0.56 0.32 0.23 -0.020.140.150.020.10 -0.07 0.38 0.33 -0.41 0.62 0.100.81 1.45 0.14 1.64 0.39 1.13 0.481.36 1.14 1.03 0.15 0.31 0.64 1.061.09 1.31 0.90 0.38 0.65 0.63 0.900.13 0.57 0.22 -0.13 -0.42 0.13 0.420.67 0.32 0.18 0.31 0.57 0.25 0.150.28 0.20 0.02 0.12 0.02 0.16 0.090.10 0.08 0.03 0.05 0.11 -0.04 0.080.17 -0.01 -0.06 0.13 0.33 0.13 -0.130.12 0.06 0.18 0.01 0.11 0.00 0.120.29 0.42 0.51 0.21 0.49 0.25 0.340.17 0.24 0.26 0.12 0.19 0.05 0.110.11 0.16 0.23 0.07 0.28 0.21 060.49 0.15 0.49 0.17 -0.14 0.47 0.86 0.36 0.52 0.63 0.97 -0.190.31 0.12 0.32 0.22 0.12 0.09 0.57 0.23 0.23 0.16 1.42 -0.320.20 -0.05 0.29 0.13 0.26 0.20 0.16 0.18 0.23 -0.03 0.16 0.110.10 -0.04 0.29 0.07 0.13 0.21 0.19 0.06 0.09 0.01 0.04 0.110.11 -0.01 0.01 0.07 0.13 -0.01 -0.03 0.11 0.14 -0.04 0.12 0.000.11 0.16 0.03 0.09 -0.14 -0.11 0.40 0.06 0.00 0.20 1.26 -0.430.06 0.14 -0.01 0.05 -0.14 -0.10 0.36 0.05 -0.02 0.15 1.27 -0.600.05 0.02 0.04 0.03 0.00 0.00 0.04 0.01 0.03 0.05 -0.01 0.170.18 0.03 0.17 -0.05 -0.26 0.38 0.29 0.12 0.28 0.47 -0.45 0.130.04 0.03 0.08 0.07 0.03 0.07 0.12 0.21 0.26 0.18 -0.38 0.200.15 0.00 0.09 -0.12 -0.29 0.31 0.17 -0.09 0.02 0.29 -0.06 41.50-0.051.55-1.66-0.78-0.75-0.03-0.88-0.87-0.01r RevisedSource: U.S. Bureau of Economic 02-1.30-0.19-0.11-0.90-0.100.180.23-0.010.03 0.00 0.00 0.01 0.01 -0.04-0.34 0.00 0.15 0.14 0.04 0.730.08 0.49 -0.57 -0.32 -0.99 -0.51-0.05 -0.14 0.04 0.03 0.08 0.030.13 0.63 -0.62 -0.35 -1.07 -0.54-0.51 0.39 -0.50 0.07 1.43 -0.050.05 0.36 -0.26 -0.08 0.17 -1.950.13 0.31 -0.41 0.10 -0.04 -0.32-0.08 0.05 0.15 -0.18 0.21 -1.63-0.57 0.02 -0.24 0.15 1.26 1.90-0.29 0.01 0.01 0.19 1.16 0.85-0.27 0.01 -0.25 -0.03 0.10 1.054.40 -0.190.43 0.331.77 0.626.7Q3 r1.13 2.250.27 -0.170.34 0.670.54 200.25 210.99 22-2.83 2.62 0.82 -0.25 0.74 0.35 25-9.64 11.71 4.01 -0.37 -0.65 1.93 26-5.63 4.88 2.92 2.25 0.61 -0.20 27-4.28 2.72 1.57 1.65 1.21 0.21 28-1.77 -0.46 -0.22 0.14 -0.08 -0.13 29-1.99 2.73 1.29 0.75 0.66 -0.13 300.38 0.75 0.31 0.49 -0.17 -0.02 31-0.24 0.26 0.21 0.08 0.35 0.08 32-1.77 1.03 0.61 0.08 0.43 -0.19 33-0.37 0.69 0.17 0.10 0.04 -0.01 34-0.51 0.45 0.50 0.76 0.62 0.47 35-0.07 0.22 0.21 0.52 0.29 0.23 36-0.34 0.28 0.27 0.25 0.28 0.18 .272.59
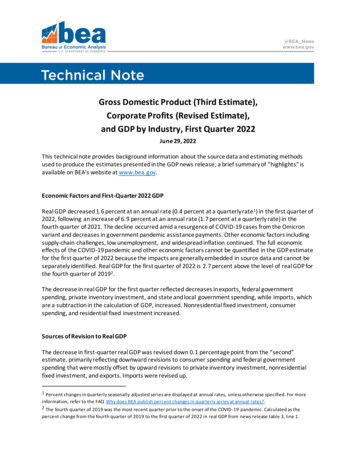
November 24, 2021Table 3. Gross Domestic Product: Level and Change from Preceding Period--ContinuesBillions of dollarsLineGross domestic product (GDP)12 Personal consumption expendituresGoods3Durable goods4Motor vehicles and parts56Furnishings and durablehousehold equipmentRecreational goods and7vehiclesOther durable goods8Nondurable goods9Food and beverages purchased10for off-premises consumptionClothing and footwear1112Gasoline and other energy goodsOther nondurable goods1314 ServicesHousehold consumption15expenditures (for services)Housing and utilities16Health care17Transportation services18Recreation services19Food services and20accommodati
Gross Domestic income and Corporate Profits Real gross domestic income (GDI) increased 6.7 percent in the third quarter, compared with an increase of 4.3 percent (revised) in the second quarter. The average of real GDP and real GDI, a supplemental measure of U.S. economic activity that equally weights GDP and GDI, increased 4.4 percent in the third