Transcription
For Immediate Release: May 26, 2016HTA Release (16-25)Total Visitor Arrivals Increased 3.4 Percent in April 2016;Visitor Expenditures Declined 1.1 PercentHONOLULU – In April 2016, total visitor arrivals to the Hawaiian Islands increased 3.4 percent froma year ago to 700,573 visitors, according to preliminary statistics released today by the Hawai‘iTourism Authority (HTA). Total visitor days1 rose 1.8 percent compared to April 2015.The growth in visitor arrivals in April was boosted by international visitors arriving by air ( 6% to218,487) and from visitors who came on cruise ships ( 85.3% to 22,902). Partially contributing to thegrowth in cruise visitors was a shift in ship schedules, as several ships that came in March and Mayof 2015 switched to an April itinerary in 2016.Visitor arrivals by air increased ( 1.8% to 677,671), driven by growth in Japanese visitors ( 4.5% to100,512) many of whom came during the last week of April 2016 for Golden Week. Arrivals fromother international markets ( 14.3% to 108,106) also increased compared to April 2015. However,there was no growth in arrivals from U.S. West (-0.5% to 294,264) and U.S. East (-0.2% to 133,262),and arrivals from Canada declined (-8.6% to 41,527).Lower average daily spending (-2.8% to 191 per person) in April 2016 resulted in a drop in totalvisitor expenditures (-1.1% to 1.1 billion). Visitor expenditures declined from Canada (-15.5% to 74.4 million) and from other international markets (-7.1% to 241.2 million). For the Japan market,although daily spending was down (-5.3%) in April 2016, growth in arrivals boosted visitorexpenditures ( 3.6% to 138.2 million).Higher daily spending among U.S. East visitors ( 8.7%) contributed to a gain in visitor expenditures( 6.8% to 265.5 million) in April 2016. Daily spending by U.S. West visitors in April was comparable( 0.5%) to last year, but visitor expenditures declined (-1.5% to 417.7 million).Among the four larger Hawaiian Islands, visitor arrivals increased for O‘ahu ( 2%) and Maui ( 4.5%)but visitor expenditures declined for O‘ahu (-5.8%) and Maui (-2.8%) in April 2016 compared to lastyear. Hawai‘i Island had a small growth in arrivals ( 0.8%) but a notable gain in visitor expenditures( 13.1%). Arrivals to Kaua‘i were unchanged while visitor expenditures increased ( 6.2%) in Aprilyear-over-year.Growth in total air seats to the Hawaiian Islands in April 2016 was flat (-0.5% to 975,737) comparedto last year. Declines in scheduled seats from Japan (-6.8%), Canada (-2%) and U.S. West (-1.2%)offset increases from Other Asia markets ( 26.9%) and Oceania ( 9.1%).1Aggregate number of days stayed by all visitors.
May 26, 2016 (16-25)Page 2Year-to-Date 2016In the first four months of 2016, total visitor arrivals ( 3.5% to 2,896,625) and visitor expenditures( 1.8% to 5.1 billion) surpassed the same period last year. There were more visitors from U.S.West ( 4.2%), U.S. East ( 6%), Japan ( 2.6%) and all other international markets ( 10.4%), whichoffset the decline in arrivals from Canada (-11.5%).Gains in visitor expenditures from U.S. West ( 5.1% to 1.7 billion), U.S. East ( 5.7% to 1.3 billion)and other international markets ( 6.9% to 977.2 million) offset losses from Canada (-18.7% to 481.4 million) and Japan (-3.2% to 615.2 million).Visitor arrivals in the first four months of 2016 increased on O‘ahu ( 3.1%), Maui ( 2.6%) andHawai‘i Island ( 1%) but declined on Kaua‘i (-1.2%) compared to the same period in 2015.Visitor expenditures for the first four months of 2016 increased on Maui ( 3.4% to 1.6 billion) andHawai‘i Island ( 10.9% to 712.3 million). Kaua‘i’s visitor expenditures ( 0.2% to 538.2 million)were comparable to last year while visitor expenditures on O‘ahu (-1.1% to 2.2 billion) declined.Other Highlights: U.S. West: Growth in arrivals from U.S. West was flat in April 2016, following 21 consecutivemonths of increases. From the Pacific region, there were more visitors from Alaska ( 6.6%) andOregon ( 1.1%), but no growth in arrivals from California (-0.4%). From the Mountain region,more visitors came from Arizona ( 4.7%) and Colorado ( 6.5%) but fewer came from Nevada(-3%) and Utah (-9.1%). Through the first four months of 2016, arrivals increased from both thePacific region ( 4.6%) and Mountain region ( 1.9%) compared to the same period last year. U.S. East: After six straight months of increases, arrivals from U.S. East were flat in April 2016.For the first four months of 2016, all U.S. East regions showed year-over-year increases inarrivals, highlighted by growth from the two largest regions, South Atlantic ( 7.8%) and EastNorth Central ( 2.9%). Japan: Golden Week is a string of four holidays that occurs from April 29 through May 5 eachyear. In April 2016, the combination of holidays and weekend days created a longer than normalvacation period that was favorable to long-haul destinations like Hawai‘i. Japanese visitorsstarted to arrive from April 25. There were significantly more Japanese visitors who stayed intimeshare properties ( 49.7%) compared to a year ago. Fewer Japanese visitors purchasedgroup tours (-9.6% to 21,383) and packaged trips (-2.9% to 66,707) in April while more madetheir own travel arrangements ( 18.5% to 29,209) compared to last year. This was the twelfthstraight month of double-digit growth for free and independent travelers from Japan. MCI: Visitors who came to Hawai‘i for meetings, conventions and incentives (MCI) in April 2016increased ( 7.4% to 47,686) versus last year. More visitors came for corporate meetings ( 5.4%to 10,201) and incentive trips ( 13.7% to 23,371), but fewer came for conventions (-3.2% to16,065). Incentive visitors from Japan ( 41.4%) were up considerably from last April and haveshown continuous growth for the last 15 months. MCI visitors also increased from U.S. West( 8.7% to 15,695) and Canada ( 44.3% to 1,831), offsetting a decline from U.S. East (-15.4% to13,910). For the first four months of 2016, total MCI visitors increased ( 5.1% to 199,595)compared to the previous year.
May 26, 2016 (16-25)Page 3April 2016 Arrivals at a GlanceYTD 2016PYTD 2015PTOTAL EXPENDITURES ( mil.)CATEGORY AND MMA1,145.41,157.8-1.15,128.35,038.21.8Total by air1,137.01,153.9-1.55,111.25,024.61.72016P2015P% CHANGE% CHANGEU.S. West417.7424.2-1.51,738.01,653.15.1U.S. All OthersVisitor arrivals by cruise shipsTOTAL VISITOR tal by . .S. 58212,236-3.0All OthersVisitor arrivals by cruise shipsVISITOR l by air677,671665,3931.82,851,0172,750,3993.74.2U.S. West294,264295,683-0.51,128,2541,083,016U.S. 296,1774.5462,035450,4502.6CanadaAll OthersVisitor arrivals by cruise 028-5.0AVERAGE LENGTH OF STAY8.568.69-1.59.229.34-1.4Total by air8.698.77-1.09.299.43-1.5U.S. West8.718.84-1.59.229.41-2.1U.S. 9.231.34.874.469.24.524.422.2CanadaAll OthersVisitor arrivals by cruise shipsPER PERSON PER DAY SPENDING ( )191.0196.5-2.8192.1192.7-0.3Total by air193.1197.7-2.3192.9193.7-0.4U.S. West163.0162.30.5167.1162.13.0U.S. 30.9244.0-5.4Canada147.7159.5-7.4155.7170.6-8.8All 64.328.7Visitor arrivals by cruise shipsPER PERSON PER TRIP SPENDING ( )1,635.01,708.3-4.31,770.41,800.4-1.7Total by air1,677.81,734.2-3.31,792.81,826.8-1.9U.S. West1,419.51,434.8-1.11,540.51,526.30.9U.S. -7.62,091.12,275.8-8.1All 1.118.3374.0284.331.5Visitor arrivals by cruise shipsP Preliminary data.Source:Haw ai'i Tourism Authority
May 26, 2016 (16-25)Page 4 Honeymoon: More visitors came to the Hawaiian Islands to honeymoon in April 2016 ( 7% to46,454) than a year ago, the first increase in honeymoon visitors in the past 12 months. TheJapanese market, which comprised nearly 40 percent of the honeymoon segment, increased( 2.9% to 18,361), as did honeymoon visitors from U.S. East ( 11.6% to 6,141). However, in thefirst four months of 2016, the total number of honeymoon visitors was down compared to lastyear (-8.9% to 157,758).Highlights from All Other Markets: Australia: Supported by growth in air seats, visitor arrivals grew in April 2016 ( 13% to 27,230)and in the first four months ( 3.6% to 94,949). New Zealand: Visitor arrivals increased in April 2016 ( 2.1% to 5,318), but declined year-to-dateversus 2015 (-1.8% to 14,353). China: Visitor arrivals dropped in April 2016 (-4.1% to 12,248) and through the first four monthscompared to last year (-2.9% to 54,256). Korea: Visitor arrivals increased in April 2016 ( 7.1% to 16,102) and year-to-date ( 16.6% to69,701) boosted by air service added in December 2015 Taiwan: Visitor arrivals grew in April 2016 ( 2.2% to 1,044), but were down slightly year-to-datecompared to 2015 (-0.8% to 5,130). Europe: Visitor arrivals from the United Kingdom, France, Germany, Italy and Switzerlanddeclined slightly in April 2016 (-0.8% to 10,501) and through the first four months (-0.9% to38,153). Latin America: Visitor arrivals from Mexico, Brazil and Argentina decreased in April 2016(-9.7% to 1,911) and in the first four months compared to last year (-3.4% to 9,077).Island Highlights – April 2016: O‘ahu: Visitor arrivals ( 2%) and visitor days ( 1.5%) increased in April 2016 compared to lastyear. However, lower daily visitor spending (-7.2% to 191 per person) resulted in a loss in visitorexpenditures for the month (-5.8% to 524.2 million). There were more visitors from Japan( 4.3%), but fewer visitors from U.S. West (-3.2%) and Canada (-12.3%) than a year ago. Maui: Despite growth in arrivals ( 4.5%) and visitor days ( 1.1%), decreased daily spending(-3.8% to 205 per person) led to a drop in visitor expenditures (-2.8% to 333.5 million).Increases in arrivals from U.S. West ( 3.6%), U.S. East ( 3.1%) and Japan ( 5.1%) offset fewervisitors from Canada (-10.5%). Hawai‘i Island: There was a slight increase in visitor arrivals ( 0.8%) in April 2016, but a shorterlength of stay (-2.3%) caused a drop in visitor days (-1.6%). The average daily spending by thesevisitors was much higher than last year ( 14.9% to 183 per person) and contributed to a growthin visitor expenditures ( 13.1% to 147.6 million). There were more visitors from U.S. East ( 3%)and Japan ( 6.3%), but fewer visitors from U.S. West (-2.6%) and Canada (-11.6%). A largernumber of Japanese visitors stayed exclusively on Hawai‘i Island ( 32.9% to 1,589) compared tolast April. Kaua‘i: While there was no change in visitor arrivals and little growth in visitor days ( 0.5%),higher daily spending ( 5.6% to 183 per person) led to a gain in visitor expenditures ( 6.2% to 123.8 million) in April 2016. There were more Japanese visitors ( 48.8%), but fewer visitorsfrom Canada (-2.7%) compared to April 2015.
May 26, 2016 (16-25)Page 5April 2016 Island HighlightsCATEGORY AND ISLANDTOTAL EXPENDITURES ( mil.)Total by airO‘ahuMauiMoloka‘iLāna'iKaua‘iHaw ai‘i IslandVisitor arrivals by cruise 8% CHANGE YTD 8.910.54.018.26.2538.213.1712.3119.217.1YTD 613.7% CHANGE1.81.7-1.13.4-21.7-34.30.210.924.9TOTAL VISITOR DAYSTotal by airO‘ahuMauiMoloka‘iLāna'iKaua‘iHaw ai‘i IslandVisitor arrivals by cruise .0-3.0VISITOR ARRIVALSTotal by airO‘ahuMauiMoloka‘iLāna'iKaua‘iHaw ai‘i IslandVisitor arrivals by cruise .1-1.21.0-5.0AVERAGE LENGTH OF STAYTotal by airO‘ahuMauiMoloka‘iLāna'iKaua‘iHaw ai‘i IslandVisitor arrivals by cruise .323.82.50.02.2PER PERSON PER DAY SPENDING ( )Total by airO‘ahuMauiMoloka‘iLāna'iKaua‘iHaw ai‘i IslandVisitor arrivals by cruise PER PERSON PER TRIP SPENDING ( )Total by airO‘ahuMauiMoloka‘iLāna'iKaua‘iHaw ai‘i IslandVisitor arrivals by cruise shipsP Preliminary data.Source:Haw ai'i Tourism .51.49.731.5
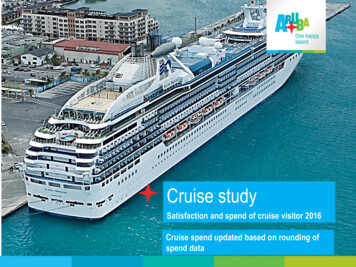
May 26, 2016 (16-25)Page 6Air Seats to Hawai‘i (Table 9, page 23):There was no growth in total seat capacity (-0.5% to 975,737 seats) to the Hawaiian Islands in April2016. Scheduled seats dropped slightly (-0.6% to 968,487) while charter seats increased ( 3.3% to7,250) compared to April 2015. The number of seats to Kahului ( 1%) rose slightly and seat capacityto Kona ( 0.3%) in April was similar to last year, but seats to Hilo (-10.4%), Līhu‘e (-1.8%) andHonolulu (-0.9%) declined. Scheduled seats from U.S. West declined (-1.2%) in April 2016. Growth in seats from Denver( 12.9%), Oakland ( 4.9%), San Diego ( 2.9%) and San Francisco ( 6.9%) was offset by fewerseats from Las Vegas (-4.5%), Los Angeles (-4%), Phoenix (-8.5%), Portland (-7.1%), San Jose(-4.3%) and Seattle (-1.4%). Seat capacity from U.S. East (-0.5%) saw little change from April 2015. There were more seatsfrom Chicago ( 2.9%) and New York City’s JFK Airport ( 33.3%), but fewer seats from Dallas(-8.5%) and Washington D.C. (-37.5%). Scheduled seats from Canada declined (-2%). Growth in seats from Calgary ( 15.5%) andEdmonton ( 26.6%) was offset by fewer seats from Vancouver (-5.2%). Scheduled seats from Oceania increased from April 2015 ( 9.1%). There were more seats fromBrisbane ( 12.3%), Melbourne ( 36.1%) and Sydney ( 5.3%), along with an increase in seatsfrom Auckland ( 3%). Air capacity from Other Asia markets rose compared to a year ago ( 26.9%). Seats from Seoul,South Korea increased ( 35.4%), boosted by a low-cost airline that began service in lateDecember 2015. Seats from China grew ( 18.7%) due to increases from Beijing and Shanghai.Seats out of Taipei were down (-11.1%). For the first four months of 2016, total air capacity into Hawai‘i grew ( 2.3% to 4,016,935 seats).All major airports saw growth in air seats: Honolulu ( 1.2%), Kahului ( 2.9%), Kona ( 9.3%), Hilo( 5.4%) and Līhu‘e ( 4.4%) compared to the first four months of 2015.Cruise Ship Visitors (Table 8, page 22): Ten out-of-state cruise ships came in April 2016 carrying 22,902 visitors to the islands, comparedto the six ships that came last April with 12,361 visitors. Shifts in itineraries from two cruise shipspartially contributed to this increase. In the first four months of 2016, 45,608 visitors entered Hawai‘i on 23 out-of-state cruise ships.This was fewer (-5%) than the 48,028 visitors who came on 27 cruise ships in the first fourmonths of 2015. In April 2016, total cruise visitors (arrivals by cruise ships and by air to board the Hawai‘i homeported cruise ship) increased ( 42.5% to 34,141). However, for year-to-date 2016, the number oftotal cruise visitors continued to be down from last year (-12.6% to 77,268). The Hawai‘i homeported cruise ship was in dry dock for four weeks in March and February 2016, which alsocontributed to the decline.
May 26, 2016 (16-25)Page 7About the Hawai‘i Tourism AuthorityThe Hawai‘i Tourism Authority is responsible for strategically managing the State of Hawai‘i’smarketing initiatives to support tourism. HTA’s goal is to optimize tourism’s benefits for Hawai‘i,while being attentive to the interests of travelers, the community and visitor industry. Established in1998 to support Hawai‘i’s leading industry and largest employer, HTA continually strives to helpensure the sustainability of tourism’s success.For more information about HTA, please visit www.hawaiitourismauthority.org. Follow updatesabout HTA on Facebook, Twitter (@HawaiiHTA) and its YouTube Channel.###Current monthly visitor statistics and other tables referenced in this release can be viewed For more information, contact:Charlene ChanDirector of CommunicationsHawai‘i Tourism Authority(808) 973-2272Charlene@gohta.netDaniel Nāho‘opi‘iDirector of Tourism ResearchHawai‘i Tourism Authority(808) 973-2264Daniel@gohta.netPatrick DuganAnthology Marketing ogyGroup.comAshley NagaokaAnthology Marketing logyGroup.com
May 26, 2016 (16-25)Page 8TABLE 1. TOTAL VISITORS BY ,24682.53.73.24.62.11.32.30.7ISLANDS VISITEDO'ahuO'ahu onlyO'ahu one day or 783.14.7-6.0Kaua'iKaua'i onlyKaua'i one day or 1.9Maui CountyMauiMaui onlyMaui one day or 6,039841,054542,42153,2672.72.65.3-15.5Moloka'i *Moloka'i only *Moloka'i one day or ,1489,14024,2542,99913,170-12.05.0-30.6Lāna‘i *Lāna‘i only *Lāna‘i one day or ,805404,179242,167183,4623.13.80.51.01.44.1TOTAL VISITORSDomesticInternationalVISITOR DAYSAVERAGE DAILY CENSUSTOTAL AIR SEATSTOTAL LOAD FACTOR (%)Hawai'i IslandKona sideHilo sideHawai'i Island onlyHawai'i Island one day or lessAny Neighbor IslandNI onlyO'ahu & NIAny one island onlyMultiple IslandsAvg. Islands VisitedAverage Length ofStay in Hawai'iACCOMMODATIONSPlan to stay in HotelHotel onlyPlan to stay in CondoCondo onlyPlan to stay in TimeshareTimeshare only% CHANGE* Sample sizes for Moloka'i and Lāna'i are relatively small.** Change represents absolute change in rates rather than percentage change in rate.2016P2015P% CHANGE
May 26, 2016 (16-25)Page 9TABLE 1. TOTAL VISITORS BY AIR (CONT.)APRIL2015P2016PACCOMMODATIONS (continued)Cruise ShipFriends/RelativesBed & BreakfastRental HouseHostelCamp Site, BeachOther% CHANGEYEAR-TO-DATE2015P% te 361189,99192,48536,75769,4095.13.6-3.07.1Other BusinessVisit Friends/Rel.Gov't/MilitaryAttend SchoolSport .40.3Group 4402,633,577228,0292,522,370-4.64.4Package TripNo ,020,001848,8201,901,580-2.16.2Net True 6460.546460.32.132.20-3.32.162.16-0.3PURPOSE OF TRIPPleasure (Net)Honeymoon/Get MarriedHoneymoonGet MarriedPleasure/VacationTRAVEL STATUSFirst Timers (%)**Repeaters (%)**Average # of TripsAve. AgeAve. Party Size** Change represents absolute change in rates rather than percentage change in rate.Source: Hawai'i Tourism ******************************Collaboration of the following agencies are gratefully acknowledged: Airlines, State Departmentof Agriculture - Plant Quarantine Branch, State Department of Transportation - Airport Division,and U.S. Department of Homeland Security, Bureau of Customs & Border Protection - *************************************
May 26, 2016 (16-25)Page 10TABLE 2. DOMESTIC VISITORS BY LANDS VISITEDO'ahuO'ahu onlyO'ahu one day or 0-9.2Kaua'iKaua'i onlyKaua'i one day or 8Maui CountyMauiMaui onlyMaui one day or 808660,212456,48624,8642.82.95.1-8.2Moloka'i *Moloka'i only *Moloka'i one day or ,8045,75420,0852,68910,388-23.94.3-44.6Lāna‘i *Lāna‘i only *Lāna‘i one day or .81.8DOMESTIC VISITORSDOMESTIC VISITOR DAYSDOMESTIC AVERAGE DAILY CENSUSDOMESTIC AIR SEATSDOMESTIC LOAD FACTOR (%)Hawai'i IslandKona sideHilo sideHawai'i Island onlyHawai'i Island one day or lessAny Neighbor IslandNI onlyO'ahu & NIAny one island onlyMultiple IslandsAvg. Islands VisitedAverage Length ofStay in Hawai'i% CHANGEACCOMMODATIONSPlan to stay in Hotel255,782256,483Hotel only216,151217,367Plan to stay in Condo85,22888,371Condo only68,78970,953Plan to stay in Timeshare52,12652,769Timeshare only41,80441,523* Sample sizes for Moloka'i and Lāna'i are relatively small.** Change represents absolute change in rates rather than percentage change in rate.2016PYEAR-TO-DATE2015P% CHANGE
May 26, 2016 (16-25)Page 11TABLE 2. DOMESTIC VISITORS BY AIR (CONT.)APRIL2015P2016PACCOMMODATIONS (continued)Cruise ShipFriends/RelativesBed & BreakfastRental HouseHostelCamp Site, BeachOther% CHANGEYEAR-TO-DATE2015P% tgs/Conventions/IncentiveConventionsCorporate 737136,33675,14733,01035,605-1.42.2-1.6-13.7Other BusinessVisit Friends/Rel.Gov't/MilitaryAttend SchoolSport 0.5-0.3Group 931,816,75572,0351,756,651-2.43.4Package TripNo 533,275353,9411,474,7460.04.0Net True 7470.04747-0.22.002.06-3.21.992.00-0.7PURPOSE OF TRIPPleasure (Net)Honeymoon/Get MarriedHoneymoonGet MarriedPleasure/VacationTRAVEL STATUSFirst Timers (%)**Repeaters (%)**Average # of TripsAve. Age of Party HeadAve. Party Size** Change represents absolute change in rates rather than percentage change in rate.Source: Hawai'i Tourism Authority
May 26, 2016 (16-25)Page 12TABLE 3. INTERNATIONAL VISITORS BY 62,6821,293,61477.04.65.34.41.83.5ISLANDS VISITEDO'ahuO'ahu onlyO'ahu one day or 3Kaua'iKaua'i onlyKaua'i one day or i CountyMauiMaui onlyMaui one day or .111.114.2INTERNATIONAL VISITORSINTERNATIONAL VISITOR DAYSINTERNATIONAL AVERAGE DAILY CENSUSINTERNATIONAL AIR SEATSINTERNATIONAL LOAD FACTOR (%)Moloka'i *Moloka'i only *Moloka'i one day or less*Lāna‘i *Lāna‘i only *Lāna‘i one day or less*Hawai'i IslandKona sideHilo sideHawai'i Island onlyHawai'i Island one day or lessAny Neighbor IslandNI onlyO'ahu & NIAny one island onlyMultiple IslandsAvg. Islands VisitedAverage Length ofStay in Hawai'i% CHANGEACCOMMODATIONSPlan to stay in Hotel169,289160,562Hotel only154,347144,650Plan to stay in Condo32,34729,753Condo only24,38824,127Plan to stay in Timeshare10,78810,843Timeshare only7,9628,085* Sample sizes for Moloka'i and Lāna'i are relatively small.** Change represents absolute change in rates rather than percentage change in rate.2016PYEAR-TO-DATE2015P% CHANGE
May 26, 2016 (16-25)Page 13TABLE 3. INTERNATIONAL VISITORS BY AIR (CONT.)2016PACCOMMODATIONS (continued)Cruise ShipFriends/RelativesBed & BreakfastRental HouseHostelCamp Site, BeachOtherAPRIL2015P% CHANGEYEAR-TO-DATE2015P% 45.754.33.545.854.23.40.00.03.1Group 147816,822155,994765,719-5.76.7Package TripNo 86,727494,879426,834-3.614.0Net True 4.2432.5432.51.50.4PURPOSE OF TRIPPleasure (Net)Honeymoon/Get MarriedHoneymoonGet MarriedPleasure/VacationMtgs/Conventions/Incent
growth in cruise visitors was a shift in ship schedules, as several ships that came in March and May of 2015 switched to an April itinerary in 2016. 100,512) many of whom came during the last week of April 2016 for Golden Week. Arrivals from Lower average daily spending (-2.8% to 191 per person) in April 2016 resulted in a drop in total
