Transcription
Cruise studySatisfaction and spend of cruise visitor 2016Cruise spend updated based on rounding ofspend data1
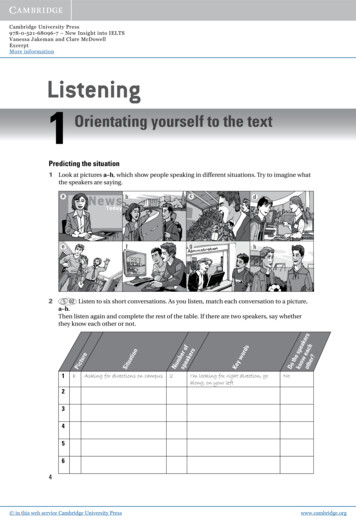
Cruise visitor YTD August 2016PAXCALLSAVG PAX PER SHIP20162015% ight: YTD August 2016 the cruise visitor grew by 16% incomparison to YTD August 20152
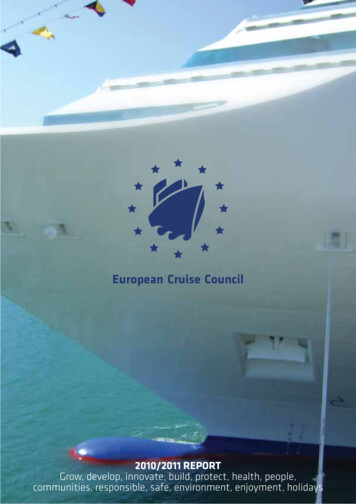
"In my opinion Aruba is the place on earth".a “Good/Nice”Best 23.4%3.6%Most Beautiful 21.5%Hottest3.3%Friendliest18.2%Most Special3%Happiest12.9%Sunniest1.4%most Relaxing1.4%An ordinary1.1%Best beach destination 5.2%Tropical paradise 5%Q: Please finish the sentenceN 363most Fun 0.8%Insight: The results indicated that the word “best” is number one andscored the highest. Interestingly happy did not score as high. The“best” scored should be seen as “Aruba is the best amongst the3visited islands/ports in the Caribbean”
Table of contents1.Introduction2.Demographics3.Key decision factors4.Aruba-spend5.Aruba: rating6.Cruise visitor recommendation7.Likelihood to return to Aruba8.Conclusion9.Travel habits4
Introduction5
Introduction & methodologyOne of the objectives of A.T.A. is to increase thetourism receipt by 6%, it is therefore crucial forA.T.A to understand the spending and on-islandbehavior of all its visitors, both stay-over andcruise visitors.Therefore, the Strategy, Planning and Research(SPR) conducted a study amongst the cruisevisitors to research mainly the spending and onisland behavior of these visitors. Besides theaforementioned the purpose of this study was alsoto investigate the travel habits of cruise visitors,conversion possibility cruise to stay-over visitors,rating and description of Aruba as a destinationand finally, key product recommendations that willfacilitate the cruise visitors during their visit toAruba.The study ran from March 2016 to April 2016,during which 460 face to face interviews wereconducted. SPR conducted this study using arandom selection method.This means all cruise visitor had access toparticipation in this study. This method was chosento ensure that the results of the study is generalizedto the entire population (total cruise visitors) and isstatistically representative.A sample of 384 surveys were needed to ensure astatistically representative sample. The SPRdepartment collected a total of 460 responses.Cruise visitors were invited by a trained datacollector to participate in the study. As an incentiveto complete the survey, participants received a smalltoken of appreciation in the form of a A.T.A fan orpen.The results of this study will provide insights into thespending behavior of the cruise visitor in Aruba, theirlevel of satisfaction with Aruba, the cruise visitorsrecommendation to maximize their time spend inAruba, the cruise visitor's likelihood to return andfinally, the cruise visitor’s travel habits, Happyreading!6
Demographics7
Demographics51.3% of the respondents were female, while theremaining participants were male (48.7%).40% of the respondents are from the UnitedStates, followed by Canada (13%), UK (12%) andGermany (5%).When zooming into the United States, 17% of therespondents are from Florida followed by DC(7%), New York (7%), Texas (7%), Virginia (7%),and North and South Carolina (5%).40%United StatesMichigan:4%13%CanadaNew emaining Europe5%Colombia4%Brazil4%Remaining of the South America4%Remaining Caribbean6%Rest of the world5%0%DC:7%Virginia:7%Texas:7%Florida:17%North &SouthCarolina:5%5% 10% 15% 20% 25% 30% 35% 40% 45%Q: 21 Please indicate your gender, country of origin and household incomeN:4608
Demographics47% of the respondents are Baby Boomers (age 50 -69), followed by theGen X (age 34 – 49) and lastly the Millennial generation.The Millennial generation was split in two groups to reflect if the cruisetrips are mostly used by the young Millennial (age 18-24) or the olderMillennial (age 25- 34).The results indicate this is mostly used by the older Millennial (25-34)(13%) vs. 5% of younger (18-24).14%5%13%Millennial: 18 - 24Millennial: 25-3421%47%Q: 21 Please indicate your ageN:460Gen X: 35-49Baby Boomer: 50-69Silent generation: 70 9
Demographics25% of the respondents have a (self reported) house hold income of US 100k and plus.75% the respondents have (self reported) house hold income of less than US 100K of which39% indicated to have a house hold income lower than US 50K. The remaining 36% indicated tohave an income between US 50 – 99.9K.11%25%6%Under US 25,000US 25,000 - US 29,99911%US 30,000 - US 39,999US 40,000 - US 49,999US 50,000 - US 74,99915%11%US 75,000 - US 99,999US 100,000 & and over21%Q: 21 Please indicate your annual household income in USDN:46010
DemographicsThe majority of the respondents were from Princess Cruises(22%), Pullmantur (16.5%), and Royal Caribbean (14.6%)Princess CruisesPullmanturRoyal CaribbeanCarnivalCelebrityAzuraThomson ZuiderdamAida DivaCelebrity EclipseMSC OperaJewel of the SeaSunshineSeabreeze Serenade of Coral princess022% 10117% 7615% 6712% 569%426%305%23164%4%163%122% 82% 70% 20% 20% 10% 120Insight: data indicates that cruisetrips seemed be an one timeexperience (Repeat percentage is at27% for taking a cruise trip).With regards to how many times the respondents have taken aprevious cruise trip, the result indicate that 73% of therespondents specified that this trip was their very first cruise tripwhile 27% indicated to already been on a cruise trip.While when asked about previous visits to the island, 68% of therespondents indicated that this visit by cruise was the very first timeto the destination while 32% have visited Aruba before by either aplane or cruise.406080Q2 - Please select the name of the ship on which you have arrived in Aruba. Q3 & Q4 – How many times have visited Aruba (this tripincluded) & Is this your first visit to Aruba by Cruise shipN:46010012011
Demographics45% of the cruise visitors from Carnival Cruise line have aHousehold income of US 100K and over, this is followed by RoyalCaribbean (40%).HH income by top 4 shipsUnder US 25,000US 25,000 - US 29,999US 30,000 - US 39,999US 40,000 - US 49,999US 50,000 - US 74,999US 75,000 - US 99,999US 100,000 & overPrincess Cruises Royal nsight: About 40 – 45% of cruise visitors from Carnival and RoyalCaribbean have household income of USD 100K . About 60 – 55%have a household income of less than USD 100KHH by top cruise linesN:460Whereas about 20% and 9% of visitors from Princess andPullmantur have a household income of USD 100K 12
Key Decision Factors“I have left my heart in somany ports”13
Key decision factors37%See Multiple Destinations, Unpack Only Once30%Cruise vacation offers great value10%Cruise Ships are Family Friendly7%Cruise Vacations are Easy to Plan6%Cruising is Social4%Cruising Is RomanticCruising allows you to tailor to your own 2%Ships Offer a Variety of Onboard Activities0%Q: 1 What influenced you to take to take your cruise trip?N:4603%5% 10% 15% 20% 25% 30% 35% 40%14
Key Decision FactorsFor 36% of the participants, friends/ relatives were the main source ofinformation followed by internet (25%) and travel agent (21%).36%Q: 5 Which of the following sources of information wasthe single most important sources in making yourdecision to take this cruise ?N:46025%21%The remaining 18% indicated their mainsources of information were NewsPapers(1%), Destinations (1%) followed bySocial Media (2%), TV/Radio adds (2%) andPersonal Experiences 12%15
Key decision factors66% of the participants indicated that Aruba being on theitinerary influence them to take the tripFor the remaining 34% the main purpose for theirtrip were event-driven vacation (Family trip,Honeymoon, anniversary) (21%) followed bymultiple destinations (18%)Q: 6 Did the presence ofAruba on the Itineraryinfluenced you to take thecruise?N:46016
Key Decision FactorsThe number one main decision factor to take a cruise is to see multiple destinations.However, Aruba being part of the itinerary strengthened the decision to take the cruise.What influenced you totake your cruise trip?Please select the singlemost importantCruise vacation offersgreat valueSee Multiple Destinations,Unpack Only OnceCruise Ships are FamilyFriendlyShips Offer a Variety ofOnboard ActivitiesCruise Vacations are Easyto PlanCruising Is RomanticCruising is SocialCruising allows you totailor to your own individualstyle and tasteTotalQ: 1 What influenced you to take to take your cruise trip?N:463Total answers140Did the presence of Aruba on the itineraryinfluence your decision to take this 048646330715617
Key insights The main motivation is multiple destinations, and unpack only once (37%) The main source of information is Friends and Family (36%) 66% of the respondents indicated that “Aruba” as destination stop was their mainmotivation to choose the cruise18
Cruise visitor spending in Aruba“Yes, money can’t buyhappiness,But, it’s more comfortable tocry in a BMW than on abicycle”19
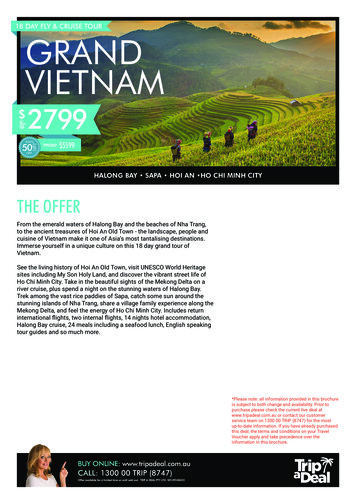
Cost of cruise tripOn average the total cruise trip cost per travel party USD 4,081.The majority of the travel party consists of 2 people meaning thecruise trip cost about USD 2,041 per person.The average length of cruise trip is 11 nightsQ: 6-8: What was the total cost of your cruise packagefor your travel party (including airfare) in USDHow many person does this coverHow long was your cruise tripN:46020
Cruise visitor spending in ArubaFood and Beverage consumer outside the 45%Souvenirs45%Shopping (cheese alcohol)33%Tour purchased while in Aruba22%Taxi20%Prepaid (Tour purchased on board cruise ship)19%The top 3 spendingcategories are :1. F&B outsidethe cruise ship(45%)2. Souvenirs3. Shopping(chocolate,cheese, alcoholetc.)Q: 9 Please select “yes” for the categories that apply toyour traveling party’s expenditure in ArubaN:460Public Transportation11%Apparel and Shoes11%Jewelry8%OthersTelephone / InternetCasinos5%5%4%Car Rental2%Perfumes2%Watches / Electronics2%0% 5% 10% 15% 20% 25% 30% 35% 40% 45% 50%21
Cruise visitor spending in ArubaAverage spend perparty in USD% On island spend(weighted)Average spend perparty in USD(weighted)Average spend perperson in 7.3513.68Food and Beverage consumedoutside the cruise ur purchased while in Aruba78.5722%17.288.64Apparel and s / Electronics149.38Car Rental75.00Public Transportation10.73Perfumes52.50Telephone / Internet13.33Q: 9 What were your traveling expenditures in ArubaTotalUSDthe amount that apply to your travelingPleaseinindicateexpenditure in ArubaTotalin USD (without PreN:460paid .530.33121.73216.11108.06Shopping (e.g. Alcohol,cheese, etc.)JewelryPrepaid (Tour purchased onboard cruise ship)22
Cruise visitor spending in ArubaOn average about 26% of the cruise visitor’s budget is spend onshopping (e.g. Alcohol, cheese, etc.), 24% on jewelry, 12% onPrepaid tours on ship, and 9% on F&B outside shipTaxi26%3% 5%Apparel and Shoes7%Tour purchased while in Aruba8%9%24%12%SouvenirsFood and Beverage consumeroutside the cruiseshipPrepaid (Tour purchased onboard cruise ship)JewelryShoppingQ: 9 What were your traveling expenditures in ArubaPlease indicate the amount that apply to your travelingexpenditure in ArubaN:46023
Cruise visitor spending in ArubaAverage spend per personPrincess Cruises Royal Caribbean Pullmantur Carnival OthersPassengers (participated in study)1006776561627363254711Shopping (e.g. Alcohol, cheese, etc.)523736210JewelryPrepaid (Tour purchased on board cruise82514259ship)Food and Beverage consumed outside41781910the cruise ship10129147Souvenirs879108Tour purchased while in Aruba39495Apparel and hes / Electronics0.3210.90.8Car Rental0.40.0611.00.8Public lephone / Internet1291848421272Total in USDTotal in USD (without Pre-paid tours)1211597018763Insight: Cruise visitors of Carnival are the highest spenders in Aruba, this is followed by Royal Caribbean. Carnival passenger24spend the most on jewelry while Royal Caribbean spend the most on shopping.
Cruise visitor spending in ArubaMotivation to Shop49.13%Price of goods20.81%Products specific to Aruba11.27%Accessibility of shopsInsight: The main motivation toshop is “price of goods”,however this is below 50%.Meaning in Aruba the prices donot seem attractive.ServiceElectronic payment0.00%Q: 11: If you shopped in Aruba, what primary factorinfluenced you to purchase .00%50.00%60.00%25
Stagnation of spending In 2002 the CBS performed a cruise study andconcluded that the average cruise visitors spend 112.11 while in Aruba (including on boardpurchase excursions) In 2015 BREA performed a cruise study andconcluded that the average cruise visitors spend 112.10 while in Aruba (excluding on boardpurchased excursions) In 2016 A.T.A cruise study it is indicated that theaverage cruise visitor spend 121.73 (includingon board excursions) and 108.06 (excluding onboard purchased excursions)Insight: In the last 14 yrs. thespending has grown by 9% (2002vs. 2016) (including on boardexcursions)Insight: 2016 vs. 2015 spending(excluding on board purchasedexcursions) have dropped by 4%26
Key Insights In terms of volume the top 3 spending categories are: F&B outside the ship, souvenirsand shopping (cheese, alcohol) In terms of spending amount the top 3 categories are: Shopping, Jewelry andExcursions (on ship) The average cruise visitor spends 121.73 (including on board excursions) Stagnation of spend (2002 vs. 2016) a growth by only 9% (including onboardexcursions) Drop in spending 2015 vs. 2016 by 4% (excluding onboard excursions)27
Aruba Rating“Aruba is the Friendliest place on earth”“Aruba has the most beautiful and kind people on earth”“Aruba is the best beach destination on earth”“Aruba is the safest place on earth”28
Aruba RatingFriendliness of locals29%65%Beaches30%63%Feeling safe and secure in the area34%61%Appearance, cleanliness and presentation ofCruise Terminal Facilities & Product 35%59%Level of customer service received33%59%Appearance, cleanliness, atmosphere andpresentation of Downtown37%54%Ease of getting around40%Taxi and transport options37%50%Range of Food and Beverage available37%48%Day tours, attractions and excursions40%46%Range of shopping available43%36%53%SatisfiedVery satisfied0% 10% 20% 30% 40% 50% 60% 70% 80% 90% 100%Q: 10: Concerning your visit to Aruba how would yourate the following aspects?29
Aruba RatingVeryDissatisfie Dissatisfiedd0%0%Friendliness of locals0%1%Beaches0%0%Feeling safe and secure in the areaAppearance, cleanliness and0%0%presentation of Cruise TerminalFacilities and Product Offerings0%0%Level of customer service receivedAppearance, cleanliness,0%1%atmosphere and presentation ofDowntown0%0%Ease of getting around0%1%Taxi and transport optionsRange of Food and Beverage1%0%availableDay tours, attractions and1%1%excursions0%1%Range of shopping availableQ: 10: Concerning your visit to Aruba how would yourate the following 2%37%48%3%9%40%46%6%13%43%36%30
Aruba rating-by generation“Range of shopping available” was rated the lowest by theMillennial generation, only 5% was very satisfied with thisaspect.“Day tours and excursions” were rated the lowest by theMillennial generation, only (6%) were very satisfied.The Gen X generation also rated this aspect low since only7% rated this as high.“Range of food” available were rated the lowest by theMillennial generation only 5% was very satisfied.Insight: The younger generationwere the main driver for the lowrated aspects (Range of shopping,day tours and excursions andrange of food available. With thelater being driven by the BabyBoomers as well.The Baby boomer generation also rated this low, only 13%was very satisfied with this.Q: 10: Concerning your visit to Aruba how would yourate the following aspects?31
Aruba RatingInsight: Pullmantur cruise visitorare the most satisfied with Arubafollowed by Carnival, Princess andRoyal CaribbeanFriendliness of locals75%Beaches39%60%43%58%63%64%59%58%50%Feeling safe and secure in the area62%61%Appearance, cleanliness and presentation of CruiseTerminal Facilities & Product Offerings60%57%66%55%55%Level of customer service received65%54%58%63%49%59%Ease of getting around54%48%Range of Food and Beverage available 21% 49%53%Princess %38% 24%32% 27% 41%50%55%43% 27%Day tours, attractions and excursions 24% 24% 45%0%63%43%Taxi and transport options 24% 24% 41%Q: 10: Concerning your visit to Aruba how would you rate thefollowing aspects? Answers for very satisfied by cruise ship70%Royal CaribbeanAppearance, cleanliness, atmosphere and presentation ofDowntownRange of shopping available67%38% 21%100%150%200%250%300%350%32
Cruise visitor recommendationA map of the island along with somerecommendations50%A brochure about all the need to knowabout Aruba45%A recommended Aruba trip itinerary38%More information on Aruba.com aboutactivites in Aruba30%Participation in self guided tours30%Walking trails29%0%10%20%30%40%50%60%“Visitors map withrecommendations”Q: 13: In your opinion which of the following will helpyou maximize your time in Aruba N:46033
Cruise visitor recommendationBe free to roam the island on my own terms and timeVisit the beachAccess to free wifiVisit the must-see touristic places/ sightseeingEat local foodFun attractionsShopping for local productsVisit cultural attractionsParticipate in pre-booked tours / activtiesLearn new thingsExperience the culinary cuisine of the islandEngage in natureExclusive shopping at high end brands and/or Health and fitness0%Q: 13: If you had less than 24 hrs on Aruba how wouldyou spend your time ? %30%40%50%3460
Cruise visitor recommendation25%The most popular restaurants to dine inSelf guided tours29%The local activities you need to visit29%30%The best places to shop32%The most iconic attractions you need to visitParticipation in guided tours33%How to get around on the island33%40%The must see beaches0%Q: 14: At the port did you get enough information on?Answers shown for strongly agree N:4605%10%15%20%25%30%35%40%45%Insight: Better information isneeded on restaurant to dine in, selfguided tours, local activities and35best places to shop
Key Insights More information at the port or on ship about the most popularrestaurant to dine in Aruba (25%) More information at the port or on the ship about self-guided tours inAruba (29%) More information at the port or on the ship about the local activities(29%) More information at the port or on the ship about the places you needto shop (30%)Q: 12 Please select the statement that best describeyour feelings “ at the port or on ship did you receiveenough information on “ N:350“BetterInformation aboutmost popularrestaurants, selfguided, localactivities andplaces you needto shop”36
Aruba- Product recommendations Better range of food and beveragesaccessible to cruise visitor Better range of shopping Better tours and executions offered A map with recommendations is helpful Access to Wi-FiEspecially, the younger generation scoredAruba low on these aspects37
Likelihood to return to Aruba 63% of the respondents are very likely to recommendAruba to others 48% of the respondents are very likely to return toAruba on another cruise 35% of respondents are very likely to return to Arubaas land-based visitor (conversion) Thus, 48% of the respondents are very likely to returnto Aruba, but not as land-based visitorQ: 16 & 17: How likely are you to return to ArubaHow likely are you to recommend Aruba to othersN:460“Higherlikelihood toreturn as Cruisevisitor”38
Likelihood to return to Aruba by generation70 %18-240%5%6%10%15%20%25%30%35%40%45%The older the person the less likely they will return toAruba by plane, the younger the person the higher likelyto return by plane39
Key Insights 68% of land based visitor are very likely to return to Aruba 35% of cruise visitor are very likely to return as land based The younger generation are more likely to return as land basedvisitor40
Conclusion The main motivation to take a cruise is to see multiple destinations, and unpack only once(37%). 66% of the respondents indicated that “Aruba” as destination stop was their main motivation tochoose the cruise. The main source of information is Friends and Family (36%). On average a person spend USD 2041 per cruise package (including airfare). The top three spending categories (in terms of volume) are F&B (outside ship) (45.22%),souvenirs (44.78%), and shopping (33.22%). The average cruise visitor per person spends 121.73 (including pre-paid tours), while thecruise visitor spend about 243.47 (including pre-paid tours) per party while in Aruba From the above-mentioned budget, the highest spend (in terms of amount) are spend onshopping (26%), jewelry (24%), pre-paid tours (12%) and F&B (9%). The top reason for shopping in Aruba is the price of goods (49.13%).41
Conclusion In the last 14 yrs. the cruise spending has grown by 9% (2002) vs. (2016) this includes on-boardexcursions. However, the cruise spending (excluding on-board excursions) have dropped by 4%vs. 2015. The cruise line that brings the highest income passengers are Carnival followed by RoyalCaribbean. 45% of passengers from Carnival have a HH of 100K and over, and 40% of passengers ofRoyal Caribbean have a HH of 100K and over. The passengers (per person) from Carnival spend the most when on island on average 212,this is followed by Royal Caribbean 184.42
Conclusion Friendliness of locals, beaches and safety were the top three best rated aspects of Aruba. Range of food available, excursions and range of shopping available were rated the lowestof Aruba. The majority of participants (50%) indicate that a “Map along with recommendations” is themost helpful tool to allow them to maximize their time on island. 53% of respondents seek to be free to roam the island on their own, 47% seek to visit thebeach and 34% indicated that access to Wi-Fi are their top three favored activities whenvisiting Aruba during limited time. The majority of respondents seek better information about most popular restaurant, selfguided tours, local activities and place you need to shop 48% of respondents are very likely to come back to Aruba as cruise visitors. The youngercruise victors are more likely to come back to Aruba as land visitors.43
Conclusion Aruba on the itinerary influences the visitorsdecision to come Aruba is friendliest place on earth, the bestamong other islands Better information is needed on ship or at theport about Aruba about where to eat, localactivities and self guided tours Wi-Fi access is requested Better range of food option, shopping andexcursions are requested The young cruise visitor are more likely tocome as land based visitor Cruise visitor has been spending more or lessthe same amount in the last 14 yrs. Nonetheless, a drop by 4% is seen in 2016 vs.2016 when comparing spend (excluding on44board purchased excursions)
Travel Habits Convenience and see multiple destination are themain motivation for cruise Specific destination can be a main motivation forcruise. Such as 66% of respondents indicated thatAruba is their main purpose for taking the cruise. If a specific destinations is not the main contributorfor taking a cruise, an event such as family trip,honeymoon, and anniversary is the largestcontributor. Main source of information is friends and family It cost 2041 per person to take a cruise package(11 nights)45
Satisfaction and spend of cruise visitor 2016 1 Cruise spend updated based on rounding of spend data . 2 PAX CALLS AVG PAX PER SHIP 2016 2015 % GROWTH 2016 2015 % GROWTH 2016 2015 % GROWTH YTD August Cruise visitor YTD August 2016 Insight: YTD August 2016 the cruise visitor grew by 16% in .