Transcription
Ridership SummaryFiscal Year 2016-17For the six-month period ending December 31, 2016Planning DepartmentWith 3,117,345 passengers year to date, ridership is below that for the same period lastyear by 316,290, or -9.2%. There was one additional weekday, the same number ofSaturdays and one less Sunday in the first half of FY 16-17 compared to FY 15-16. Onaverage per day type for the first half of the fiscal year, ridership decreased by 10% perweekday, 12% per Saturday and 7% per Sunday year to date.According to ridership data prepared by the American Public Transportation Association(APTA), the ridership decrease for the first half of the year remains consistent with thatexperienced by other transit agencies statewide. As reported in recent ridership reports,this is likely attributed to lower gas prices, increased vehicle registrations, decreasedinternational student enrollment (e.g., EF -33% year to date) and decreased SBCC Fallsemester enrollment (-7.1%). There were also six additional days of measurableprecipitation the second quarter of this fiscal year compared to last fiscal year whichtypically negatively affects ridership.Fall 2016 Service Changes:Ridership results of the service changes that were implemented in August 2016 arehighlighted below: Alternating trips of Lines 6 and 11 were interlined with Lines 25 and 23 respectivelyat the Storke/Hollister intersection to lessen the need to transfer. Lines 23 and 25were also de-interlined with the routing changed somewhat to provide more directservice in those areas. As opposed to all other lines in light of calendar daydifferences, ridership on Line 23 was significantly better and ridership on Line 25experienced a significant increase. 1 Passengers per hour on Line 23 increased by30.3% for the second quarter and 140.7% year to date. Passengers per hour on Line25 decreased by 11.5% probably due to passengers distributed more throughout theday and night given the more regular service on this line (i.e., less service gaps).Year to date the passengers per hour on Line 25 increased by 8.9%. The overall1 The Line 23 and Line 25 higher ridership is significant because when passengers are no longer required totransfer between lines (e.g., Line 23 to Line 11), the fare box registers ridership only once upon boarding thebus vs prior to the August changes when ridership is registered two times due to transferring. Therefore,ridership occurring after the August changes compared to prior to the changes is actually greater than theridership data shown. The inverse to this can also occur with lines that are no longer constantly interlined(e.g., Line 6 to 11) versus prior to the August changes when they were constantly interlined.1
significant positive change on these lines is likely due to the significant increase inpassenger convenience. Line 7 service was extended over the Fairview Bridge to provide direct service to OldTown Goleta and frequency was increased during weekdays. Lines 8 and 9 werediscontinued. On average per weekday, ridership on Line 7 slightly decreased byapproximately 5% (or 45 passengers) when comparing to combined ridership of Lines7, 8 and 9 of the second quarter of last fiscal year which is less than the system wideridership average per weekday decrease of approximately 9% (2,092 passengers). Onaverage per Saturday, ridership was approximately flat in comparison and on averageon Sunday increased by approximately 16% (or 35 passengers). Line 20 frequency was increased from one hour to 40 minutes during the mid-day onweekdays. Consistent with the district wide trend, Line 20 has experienced asignificant decrease in “at capacity” and “too full to board” occurrences for thesecond quarter and year to date likely due to the increased frequency as well asdecreased overall ridership. Many passengers have commented they are pleased withthe greater frequency of service for that is the only transit line serving betweenCarpinteria and Santa Barbara during the mid-day. A new Line 28 began service between Camino Real Marketplace and UCSB onAugust 22, 2016. It is fully funded by UCSB. The passengers per hour at 67.6 forthe second quarter is more than double the system total of 29.8. Passengers may benew ones given the convenience of the 15 minute frequency during the weekdaysand/or as a result of the 1,000 increase in student enrollment this school year. Manyof the passengers may also be previous Line 11, 15x, 24x and 27 passengersdepending on daily class schedules and origin and destination with respect to wherethe lines serve. Ridership on those other lines may decrease accordingly as a result.For example, Line 27 at capacity loads decreased by 76% or an average of 1.6 per dayto 0.4 per day. In addition, UCSB faculty and staff can ride Line 28 for free per theUCSB/MTD agreement which in turn would increase the free fare category overall tosome degree. Year to date passengers per hour is 27.6. It is significantly lower thanthe second quarter (yet at about the system YTD average of 28.8) likely due to UCSBFall quarter beginning toward the end of the first quarter on September 22.UCSB, SBCC & Secondary Schools:There were two less SBCC and UCSB school days in session for the second quarter ofthis fiscal year compared to the second quarter of last fiscal year. Year to date there wasnot a change in the number of SBCC and UCSB school days. Combined UCSB andSBCC student ridership for the second quarter of the year was 36% of total ridershipwhich is similar to the second quarter of last fiscal year at 33%, and year to date was 28%of total ridership which was similar to year to date of last fiscal year at 26%. Combinedridership decreased 0.9% (5,287 passengers) for the second quarter and 4.3% (38,422passengers) year to date compared to last year.2
On average, there was a UCSB ridership increase of 14% (or 615 UCSB passengers) perweekday for the second quarter and an increase of 14% (or 391 UCSB passengers) perweekday year to date. As previously stated, the increase could be partially attributed tothe 1,000 student enrollment increase this school year as well as the additional direct Line28 service and more direct service between Line 23 and Line 11 which directly servesIsla Vista and UCSB. San Joaquin is now partially open for occupancy (128 out of a1,005 beds) which can also contribute somewhat to the increase number of studentpassengers.On average, there was a SBCC ridership decrease of 23% (or 893 SBCC passengers) perweekday and a decrease of 21% (or 727 SBCC passengers) per weekday year to date. Aspreviously stated, SBCC enrollment for the Fall semester decreased 7.1%. Theenrollment decrease probably eases the SBCC parking situation, which might reduce theincentive for students to reach campus without an automobile. Also, construction of anew building on West Campus began shortly toward the end of the second quarter of FY15-16 which involved closure of the West Campus bus stop served by Line 16. Line 16,now on a detour route compared to not on detour the second quarter of last year, saw anaverage per weekday passenger decrease for the second quarter of approximately 32%and for year to date at approximately 25%.There were three less Santa Barbara Unified School District class days this secondquarter than the second quarter of last year which is likely attributable to the 10.6%decrease in school booster ridership. Year to date, there was one more class daycompared to year to date last fiscal year which is likely attributable to less of a schoolbooster ridership decrease at 4.5% compared to a system wide decrease of 9.2%.Cruise Ships:There were ten cruise ship visits to Santa Barbara in the second quarter of 2015. Sixwere large vessels (over 3,000 total capacity) which required a full complement of extrashuttles (4 units), while four were smaller vessels (under 3,000 total capacity) requiringthree extra units. There were 11 cruise ship visits to Santa Barbara in the second quarterof 2016. Seven were large vessels requiring four extra units, while four vessels were ofsmaller size (under 3,000 total capacity) requiring three extra units. Year to date therewas one additional ship compare to year to date last fiscal year. As usual, the extrashuttles were appreciated and well-used, with all shuttles together carrying an average ofnearly 1,000 additional passengers per day. Note that passengers paying Senior fare arecounted by the fare box as ‘Senior’ and not as ‘Shuttle’ passengers – thus the increase inSenior ridership.3
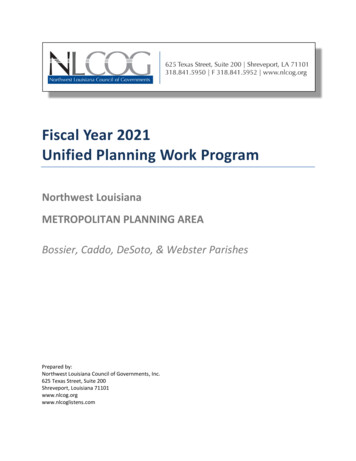
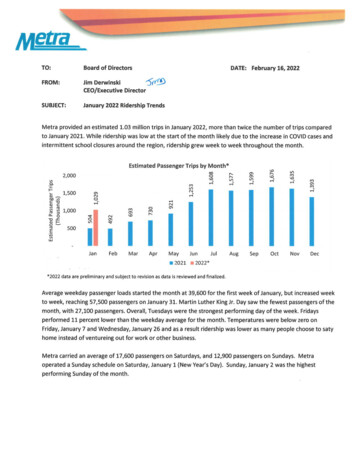
PlanningRidership by Fare Category (October – December 2016)YTDQuarterFare CategoriesOct 16 - Dec 16 Oct 15 - Dec 15% ChangeFY 2016-2017 FY2015- 2016% ChangeGeneral 81283,545-18.8%My Ride / 319,0613.2%Full Fare Prepaid(1)Santa Barbara City CollegeSenior & Disabled PrepaidShuttle (DWE & Seaside)UC Santa BarbaraYouth Prepaid(3)Persons w ith 2%(1) Includes adult 10-ride and unlimited 30-day Passport use.(2) Includes seniors' and persons w ith disabilities' 10-ride, and unlimited 30-day Passport use.(3) Includes K-12 Youth 10-ride and unlimited 30-day Passport use.Source: MTD Passdat Program, MTD Transit Development Department, Planning SectionRevenue Hours and Revenue Miles (October – December 2016)QuarterMetricsPassengersRevenue HoursPassengers per Revenue HourMilesPassengers per MileYTDOct 16 - Dec 16 Oct 15 - Dec 15%ChangeFY 2016-2017 FY2015- 2016% ce: MTD Passdat Program, MTD Transit Development Department, Planning Section4-10.9%4.3%-11.3%-12.5%3.9%-12.6%
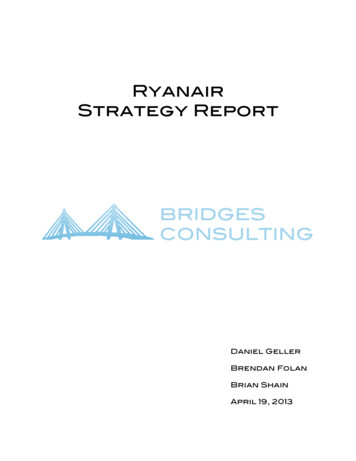
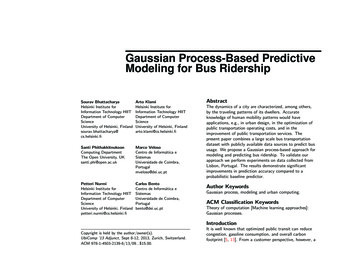
PlanningMTD System Ridership (October – December 2016)YTDQuarterLINEOct 16 - Dec 16Oct 15 - Dec 15 % ChangeFY 2016-2017FY2015- 2016% Change1West Santa Barbara83,13995,421-12.9%172,007196,638-12.5%2East Santa k Park48,27549,750-3.0%97,958104,540-6.3%4Mesa / SBCC30,30033,645-9.9%63,37270,264-9.8%5Mesa / La Cumbre6Goleta7County Health / Fairview8County Health9Calle Real / Old Tow n Shuttle10 Cathedral 0%12x Goleta Express53,54761,609-13.1%114,675125,777-8.8%14 Montecito20,26023,648-14.3%42,81949,152-12.9%15x SBCC / UCSB Express72,33894,927-23.8%126,342168,125-24.9%16 City College Shuttle27,52845,170-39.1%47,11469,596-32.3%17 Low er West / SBCC38,00440,242-5.6%78,05987,913-11.2%20 1x Carpinteria Express20,28023,215-12.6%42,26249,816-15.2%11 UCSB23 Winchester 897-17.2%281,129332,655-15.5%25 Ellw ood15,63311,33238.0%28,89724,57717.6%27 Isla Vista 943-18.9%24x UCSB Express28 UCSB Shuttle36 Seaside Shuttle37 Crosstow n 2,5230.8%31 East Beach Waterfront Shuttle8,0017,3558.8%24,29924,2180.3%32 West Beach Waterfront ooster ServicesSystem SubtotalDowntown Waterfront Shuttles30 Dow ntow n ShuttleUnknownSystem TotalRelated Routes20, 21x Carpinteria1, 2, 37 East/West & 2,456270,046-13.9%479,059555,285-13.7%4, 5, 15x, 16, 17 Mesa Lines202,913252,766-19.7%386,226477,842-19.2%6, 11 15.1%63,98565,422-2.2%130,7657, 8, 9 Calle Real/FairviewSource: MTD Passdat Program, MTD Transit Development Department, Planning Section5139,157-6.0%
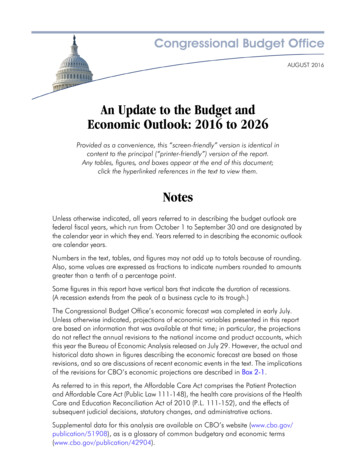
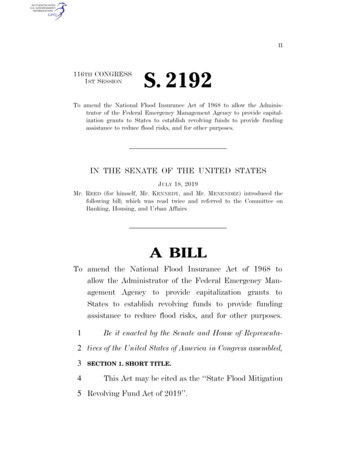
PlanningMTD Passengers per Revenue Hour (October – December 2016)YTDQuarterLINEOct 16 - Dec 16Oct 15 - Dec 151West Santa Barbara28.934.6% Change-16.3%FY 2016-2017 FY2015- 201629.535.1-16.1%2East Santa Barbara28.134.7-19.1%28.435.6-20.4%3Oak Park19.519.6-0.8%19.120.1-5.3%4Mesa / SBCC26.529.7-10.8%27.230.3-10.2%5Mesa / La 7.6%31.534.6-9.0%7County Health / Fairview17.024.3-30.1%18.126.3-31.4%8County Health-27.8-100.0%26.028.2-7.6%9Calle Real / Old Tow n Shuttle-14.0-100.0%11.713.9-16.2%10Cathedral 8%30.135.2-14.7%12xGoleta 19.2-15.5%17.019.6-13.5%15xSBCC / UCSB Express39.749.7-20.1%36.647.5-23.1%16City College Shuttle36.657.4-36.3%38.756.8-31.8%17Low er West / .0-15.6%20.523.9-14.3%21xCarpinteria Express22.422.20.9%21.923.2-5.5%% Change23Winchester Canyon23.317.930.3%45.418.9140.7%24xUCSB Express47.657.6-17.4%27.155.9-51.6%25Ellw ood26.830.2-11.5%35.032.18.9%27Isla Vista Shuttle43.052.3-17.8%56.143.030.3%28UCSB Shuttle67.6-100.0%27.6-100.0%36Seaside Shuttle12.520.0-37.3%15.619.3-19.1%37Crosstow n Shuttle14.216.5-13.8%14.616.0-9.3%Booster .133.6-13.5%10.4%27.626.15.8%System SubtotalDowntown Waterfront Shuttles30Dow ntow n Shuttle25.022.731East Beach Waterfront Shuttle16.014.87.7%17.517.6-0.5%32West Beach Waterfront stem Total0.0%0.0%Related Routes20, 21x Carpinteria20.11, 2, 37 East/West & Crosstown26.031.5-17.4%26.432.0-17.6%4, 5, 15x, 16, 17 Mesa Lines32.439.8-18.5%31.839.2-18.8%6, 11 State/Hollister31.635.5-10.9%30.635.0-12.5%7, 8, 9 Calle Real17.023.1-26.5%18.324.2-24.1%Source: MTD Passdat Program, MTD Transit Development Department, Planning Section6
PlanningMTD “At Capacity” Loads * (October – December 2016)YTDQuarterLINEFY2015- 2016% Change1West Santa Barbara611-45.5%1016-37.5%2East Santa Barbara1433-57.6%2566-62.1%3Oak Park24-50.0%111010.0%4Mesa / SBCC42100.0%5366.7%5Mesa / La %County Health / Fairview550.0%920-55.0%County Health-4-100.0%14-75.0%Calle Real / Old Tow n Shuttle--0.0%--0.0%10Cathedral Oaks11UCSB12x Goleta Express14Oct 16 - Dec 16 Oct 15 - Dec 15 % Change FY 2016-2017Montecito15x SBCC / UCSB %16City College Shuttle738-81.6%1752-67.3%17Low er West / -40.8%21x Carpinteria Express23Winchester Canyon24x UCSB Express25Ellw ood4-100.0%5-100.0%27Isla Vista Shuttle35146-76.0%39163-76.1%28UCSB Shuttle79-100.0%79-100.0%36Seaside Shuttle-11-100.0%527-81.5%37Crosstow n ShuttleBooster ServicesSystem 26-28.8%1,0161,461-30.5%Downtown Waterfront Shuttles30Dow ntow n Shuttle221283.3%85158-46.2%31East Beach Waterfront Shuttle3-10078-12.5%32West Beach Waterfront Shuttle--0--0.0%Related Routes20, 21x Carpinteria922-59.1%2544-43.2%1, 2, 37 East/West & Crosstow n2546-45.7%4088-54.5%4, 5, 15x, 16, 17 Mesa 11,630-30.6%6, 11 State/Hollister7, 8, 9 Calle Real, FairviewUnknown/MiscellaneousSystem Total* Classified as a 30-foot vehicle w ith 10 or more standees, or a 40-foot vehicle w ith 20 or more standees.Source: GFI Genfare, MTD Transit Development Department, Planning Section7
PlanningMTD “Too Full to Board” Loads * (October – December 2016)QuarterLINE1 West Santa Barbara2 East Santa Barbara3 Oak Park4 Mesa / SBCC5 Mesa / La Cumbre6 Goleta7 County Health / Fairview8 County Health9 Calle Real / Old Tow n Shuttle10 Cathedral Oaks11 UCSB12x Goleta Express14 Montecito15x SBCC / UCSB Express16 City College Shuttle17 Low er West / SBCC20 Carpinteria21x Carpinteria Express23 Winchester Canyon24x UCSB Express25 Ellw ood27 Isla Vista Shuttle28 UCSB Shuttle36 Seaside Shuttle37 Crosstow n ShuttleBooster ServicesSystem SubtotalDowntown Waterfront Shuttles30 Dow ntow n Shuttle31 East Beach Waterfront Shuttle32 West Beach Waterfront ShuttleRelated Routes20, 21x Carpinteria1, 2, 37 East/West & Crosstow n4, 5, 15x, 16, 17 Mesa Lines6, 11 State/Hollister7, 8, 9 Calle Real, FairviewUnknown/MiscellaneousYTDOct 16 - Dec 16 Oct 15 - Dec 15 % Change FY 13.9%1,087FY2015- 2016 % .8%91,741433.3%-7.5%104150.0%48System Total94178020.6%1,611* Indicates that passengers w ere refused service because a vehicle w as too full to safely board additional riders.Source: GFI Genfare, MTD Transit Development Department, Planning Section8
PlanningMTD Bicycles Carried (October – December 2016)YTDQuarterLINEOct 16 - Dec 16 Oct 15 - Dec 15FY 2016-2017FY2015- 3,052-4.7%Oak Park446595-25.0%8581,368-37.3%Mesa / t Santa Barbara2East Santa Barbara345Mesa / La Cumbre7546Goleta3,9877County Health / Fairview1,5338County Health-9Calle Real / Old Tow n Shuttle-10 Cathedral Oaks% Change% Change104123-15.4%250288-13.2%11 UCSB5,8356,635-12.1%11,22712,960-13.4%12x Goleta 5-36.5%425631-32.6%14 Montecito15x SBCC / UCSB Express16 City College Shuttle17 Low er West / SBCC20 Carpinteria21x Carpinteria Express23 Winchester 1749125.7%3,4953,905-10.5%6,9367,564-8.3%25 Ellw ood406163149.1%62434779.8%27 Isla Vista Shuttle472833-43.3%7791,229-36.6%28 UCSB ,760-10.0%24x UCSB Express36 Seaside Shuttle 137 Crosstow n Shuttle1Booster ServicesSystem SubtotalDowntown Waterfront Shuttles130 State Street Shuttle--N/A--N/A31 East Beach Waterfront Shuttle--N/A--N/A32 West Beach Waterfront Shuttle--N/A--N/A20, 21x Carpinteria2,5422,914-12.8%5,0776,020-15.7%1,2,37 East/West & Crosstow n2,0032,102-4.7%4,1304,283-3.6%4, 5, 15x, 16, 17 Mesa Lines2,7683,206-13.7%5,4856,433-14.7%6,11 , 8, 9 Calle ated RoutesUnknown/MiscellaneousSystem Total1MTD electric shuttles cannot carry bicycles.Source: GFI Genfare, MTD Transit Development Department, Planning Section9
PlanningMTD Wheelchairs Boarded (October – December 2016)YTDQuarterLINEFY 2016-2017FY2015- 20161West Santa Barbara300325-7.7%665689-3.5%2East Santa Barbara484503-3.8%1,0099941.5%3Oak Park339443-23.5%749793-5.5%4Mesa / SBCC272317.4%705332.1%5Mesa / La 21,271-14.1%7County Health / Fairview45834532.8%89062043.5%8County Health-191-100.0%86348-75.3%9Calle Real / Old Tow n Shuttle-69-100.0%33147-77.6%10 Cathedral OaksOct 16 - Dec 16 Oct 15 - Dec 15% Change% Change42100.0%93200.0%11 UCSB598771-22.4%1,2211,503-18.8%12x Goleta Express171188-9.0%361389-7.2%14 Montecito5355-3.6%124133-6.8%15x SBCC / UCSB Express6113369.2%12123426.1%16 City College Shuttle887222.2%16311344.2%17 Low er West / SBCC20 Carpinteria21x Carpinteria Express23 Winchester Canyon24x UCSB Express25 Ellw ood27 Isla Vista 28 UCSB Shuttle15-100.0%15-100.0%36 Seaside Shuttle1441-65.9%3668-47.1%37 Crosstow n 32-14.0%8,2538,932-7.6%Booster ServicesSystem SubtotalDowntown Waterfront Shuttles30 State Street Shuttle26113199.2%50629670.9%31 East Beach Waterfront Shuttle3157-45.6%6593-30.1%32 West Beach Waterfront Shuttle316-81.3%1022-54.5%20, 21x Carpinteria350574-39.0%672955-29.6%1, 2, 37 East/West & Crosstow n796848-6.1%1,7211,724-0.2%4, 5, 15x, 16, 17 Mesa 00.0%4,2904,847-11.5%8,8709,355-5.2%Related Routes6, 11 State/Hollister7, 8, 9 Calle Real/FairviewUnknown/MiscellaneousSystem TotalSource: GFI Genfare, MTD Transit Development Department, Planning Section10
three extra units. There were 11 cruise ship visits to Santa Barbara in the second quarter of 2016.Seven were large vessels requiring four extra units, while four vessels were of smaller size (under 3,000 total capacity) requiring three extra units. Year to date there was one additional ship compare to year to date last fiscal year.