Transcription
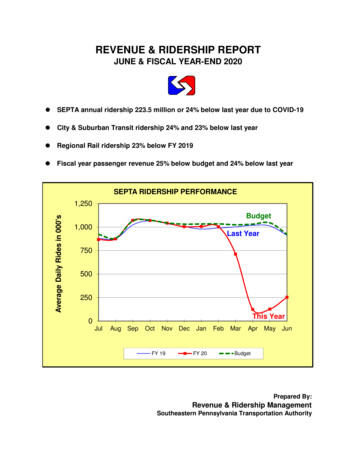
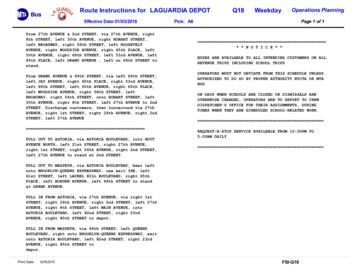
Jan 10-14Jan 17-2152.052.445.85044.06039.6Average Weekday Ridership(Thousands)Average Weekday Ridership40302010-Jan 3-7Jan 24-28 Jan 31-Feb 4The BNSF continued to be Metra’s highest ridership line in January 2022, followed by the ME, UP-N, UP-NW, andRI. All lines showed growth when compared to January of 2020.The ME was the only line with special event service in January, with two extra trains for the Chicago Bears gameat Soldier Field on January 2.Estimated Passenger Trips(Thousands)Metra System Estimated Passenger Trips by Line * (Jan 2021-Jan 7977347674HC4MD-NMD-W7052383 22 data are preliminary and subject to revision as data is reviewed and finalized.There were no special event passes offered in January 2022. Sales of the Round Trip Plus ticket ended January31. Compared to January 2019, a significant share of ridership has shifted from the Monthly Pass to the OneWay Ticket and 10 All Day Pass. The share of riders using the Ventra App was 62.1 percent in January 2022compared to 42.1 percent in January 2019.Page 2 of 3
Ticket Sales and Ridership by Ticket Type * (thousands)Jan2019Jan2022Ticket SalesJan 2019ShareJan 2022ShareJan2019Jan2022RidershipJan 2019ShareJan 2022ShareMonthly Pass8389.1%2.3%3,55323660.6%23.0%10-Ride Ticket1463216.0%9.1%1,45932524.9%31.5%One-Way Ticket62316668.3%46.8%63216610.8%16.1%Weekend Pass60-6.6%0.0%154-2.6%0.0%One Day Weekend Pass-250.0%7.0%-400.0%3.9%Two Day Weekend Pass-60.0%1.6%-120.0%1.2% 10 All Day Pass-970.0%27.3%-1880.0%18.3%Round Trip Plus-210.0%5.8%-380.0%3.7%RTA Ride Free Permit---0.0%63241.1%2.3%Ticket TypeTotal912355100%100%5,8611,029100%100%Note: Values do not add to total ridership due to Group Sales, Marketing Sales, and Refund Adjustments; 2019 data may not matchpreviously reported totals due to late-reporting sales and refunds; 2022 data are preliminary and subject to revision as data is reviewedand finalized. Sales of incremental tickets are not included.Ridership by Sales Channel * (thousands)Sales ChannelConductorJan2019Ticket SalesJanJan 20192022ShareJan 2022ShareJan2019RidershipJanJan 20192022ShareJan 2177620.7%7.4%Ventra App45824550.2%69.1%2,46963942.1%62.1%Ticket 95113.3%1.1%--0.0%0.0%63241.1%2.3%Commuter BenefitTicket Vending MachineRTA Ride Free PermitTotal912355100%100%5,8661,029100%100%Note: Values do not add to total ridership due to Group Sales, Marketing Sales, and Refund Adjustments; 2019 data may not matchpreviously reported totals due to late-reporting sales and refunds; 2022 data are preliminary and subject to revision as data is reviewedand finalized. Sales of incremental tickets are not included.Prepared byLynnette Ciavarella, Senior Division Director, Strategic Planning & PerformanceSteven Mannella, Mgr, Transportation Planning, System Performance & DataCody Wolcott, Service Analyst, System Performance & DataPage 3 of 3
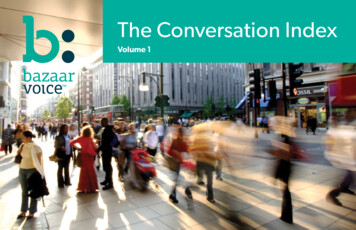
TO:Board of DirectorsDATE:FROM:Jim DerwinskiCEO/Executive DirectorSUBJECT:Ridership Trends - Annual 2021 ReportFebruary 16, 2022Jim Derwinski by JAMMetra provided an estimated 14.1 million passenger trips, 19 percent of 2019 annual trips. Estimatedpassenger trips grew the first three quarters of 2021 reaching daily record highs since the pandemic began inthe 4th quarter, before falling due to the holidays and the latest wave of the pandemic.Estimated PassengerTrips (Millions)Estimated Passenger Trips by y2018Jun2019Jul2020AugSepOctNovDec20212021 Ridership Highlights Summer weekend ridership (Jun-Aug) averaged 53 percent of pre-Covid (2019) weekend ridership, withannual weekday ridership averaging 19 percent of 2019 figures. Off-peak weekday ridership (Jan-Dec) increased 5 percent compared to 2020, with midday ridership seeingthe largest increase of 9 percent compared to 2020. Metra reached its highest ridership day since March 2020 with 108,700 passengers on the Thursday ofLollapalooza and reached a high of 91,000 weekday passengers on December 1st. In cooperation with Cook County, the Fair Transit South Cook Pilot began in January 2021, offering reducedfares for the Monthly Pass, 10-Ride Ticket, Round Trip Plus, and One Way Ticket on the ME and RI lineswith Cook County reimbursing Metra for the lost fare revenue. The ME and the RI have retained more oftheir pre-Covid ridership than any of the other lines at 25.2 percent (ME) and 22.7 percent (RI), while theother lines have averaged just 19 percent of their total ridership in 2021 compared to 2019. Ticket sales in 2021 recovered to 37.5 percent of 2019 levels. Sales of the Monthly Pass have declined to1.7 percent of all ticket sales in 2021. These tickets represented 59 percent of riders in 2019 compared tojust 20 percent in 2021. Ventra mobile app adoption reached an all-time high of 68.6 percent of ticket sales in November. The 10 All Day Pass offered a discount over any combination of two One-Way tickets traveling 3 or morezones and was attractive for workers who did not travel to the office five days a week. 10 All Day Passincreased to 24 percent of all ticket sales on all lines. Removing the ME and RI, where round trip tickets areless than 10, the percentage increased to over 30 percent of all tickets sales.
In February 2021, Metra began offering a 7 One Day Weekend Pass and the 10 Two Day Weekend Passwas made available on the mobile app only. Roughly 85 percent of weekend tickets sold were the new 7One Day Weekend Pass.Ravinia resumed concerts in July 2021. For the first time in Metra history, Ravinia concertgoers could showtheir concert ticket as proof of payment for their ride on Metra. Metra provided over 32,300 trips to themusic venue.In October, the Heritage Corridor held Metra’s self-promoted “Rails, Trails and Ales” program, addingoutbound-focused Saturday service to the Heritage Corridor for the first time in Metra history. 338 riderstook advantage of the promotion.Metra trains carried about 146,000 bicycles which was 81 percent of 2019 figures. This relatively highnumber of bikes carried may point to the success of Metra’s 2021 bike car program, which added bike carsto the MD-N, BNSF, ME, UP-N and RI lines at various times of the year.ATTACHMENTSA. Ridership Trends - Annual 2021 ReportPrepared by:Lynnette Ciavarella, Senior Division Director, Strategic Planning & PerformanceSteven Mannella, Mgr, Transportation Planning, System Performance & DataCody Wolcott, Service Analyst, System Performance & Data
ATTACHMENT ARIDERSHIP TRENDS2021 ANNUAL REPORTPrepared by the Division of Strategic Planning & PerformanceFebruary 2022
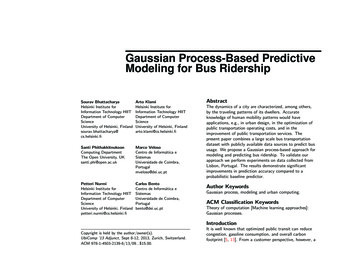
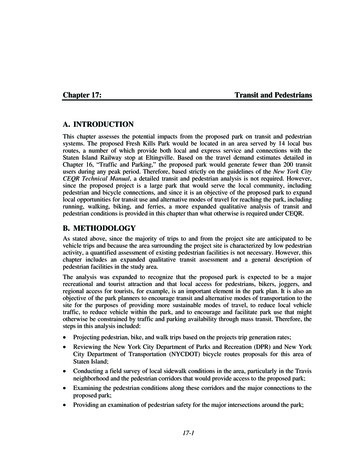
I. OVERVIEWFigure 1: 2021 Passenger Trips by Line (Millions of Trips)This report details the trends that influencedMetra system ridership in 2021. Metra is theCommuter Rail Division of the RegionalTransportation Authority and provides commuterrail passenger service on eleven service linesthroughout metropolitan Chicago (see Figure 1).Metra estimates ridership each month based onthe number and types of tickets sold.2.00.11.12.0Metra ridership grew for the first three quartersof 2021, as COVID-19 vaccinations increased, and1.1social distancing requirements were relaxed.Returning riders showed a growing preferencefor the Ventra mobile app, reaching a high inNovember of 68.6 percent of all ticket sales. The1.5Fair Transit South Cook pilot launched in January,offering reduced fares to customers on the MetraElectric and Rock Island for the next three years,2.5reimbursed by Cook County. The Restore IllinoisCOVID-19 recovery plan officially allowed 100percent office occupancy starting June 11. Metra0.1continued to add service for all lines through midJuly. Lollapalooza returned in late-July. Withspecial event service, Metra reached its highest1.71.8ridership day since the start of the pandemic with0.3108,690 passengers on the Thursday ofLollapalooza. Area schools returned to in-personclasses in the fall. Average weekday ridershipcontinued to climb, and on Dec 1 reached a high for the year of 90,980 daily passengers (without specialevent service).Overall, Metra provided an estimated 14.1 million passenger trips in 2021, which is -14.7 percentunfavorable to the budgeted forecast of 16.5 million passenger trips. Metra’s lowest historical ridershipoccurred in April 2020 at 3.1 percent of 2019 ridership. Ridership recovered to an annual average of 19.0percent of 2019 levels in 2021, starting the year at 8.6 percent in January and reaching 24.2 percent inDecember.1
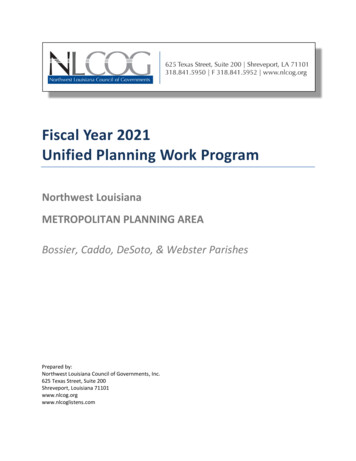
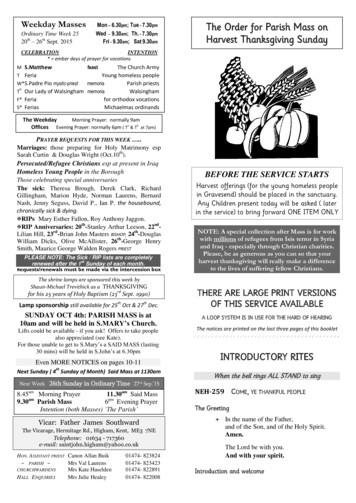
Estimated Passenger Trips(Millions)Figure 2: Metra System Annual 774.018.614.1II. 2021 RIDERSHIP TRENDSIn 2021, estimated passenger trips were 14,080,749, -14.7 percent unfavorable to the budgeted forecast.Table 1: Estimated Passenger Trips Actual Compared to ual Total2019 3,6805,760,11074,043,5162021 02,000,00016,515,0002021 13.9%28.6%12.6%3.1%-1.4%-13.3%-30.3%-14.7%Metra estimates ridership based on ticket sales, and usage rates from mobile ticket users. From April 2020through May 2021, the Union Pacific did not collect fares onboard UP-N, UP-NW, and UP-W. Union Pacificline ridership is estimated based on passenger loads instead of ticket sales during this period.2
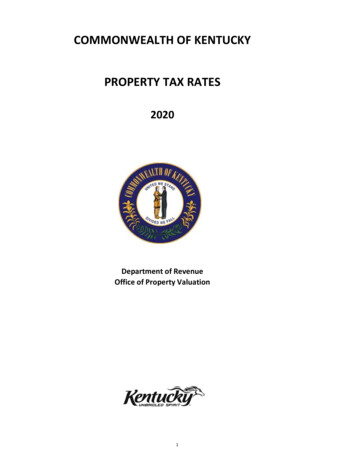
Ridership by QuarterEstimated passenger trips grew the first three quarters of 2021, reaching daily record highs in the 4thquarter since the start of the pandemic, balanced out by seasonal decreases around the holidays. Table 2tracks the recovery of ridership in 2021 compared to 2019 as well as provides a comparison to 2020.Relaxed social distancing requirements, the return of several summer events, and increased Metra servicehelped restore Metra ridership in the 2nd and 3rd Quarters. Area schools held in-person classes throughoutthe Fall, boosting ridership until the holidays.Table 2: Estimated Passenger Trips by Recoveryto 0%4Annual TotalRidership by MonthEstimated passenger trips were higher in 9 of 12 months in 2021 compared to 2020. Ridership was at itslowest in January and February, increasing through June as more workers became eligible for vaccines,and COVID-19 cases declined. In July, service was expanded on all lines to accommodate growingridership. Area schools resumed in-person classes in the fall.There was no fare increase in 2021. The special 10 All-Day Pass was available all year. The Fair TransitSouth Cook Pilot began in January, offering reduced fares for the Monthly Pass, 10-Ride Ticket, Round TripPlus, and One-Way Ticket on the ME and RI lines. In February, the 7 One Day Weekend Pass wasintroduced and available for purchase from conductors, vending machines, ticket agents, and the VentraMobile App. The 10 Two Day Weekend Pass became available only on the mobile app. The 7 One DayWeekend Pass was also available on holiday weekends.Estimated Passenger Trips(Millions)Figure 3: Estimated Passenger Trips by JulAug201720182019202020213SepOctNovDec
Ridership by LineFrom April to December 2021, all rail lines had higher ridership than in 2020. Table 3 shows estimatedpassenger trips by line for the last five years. Note that the ME has retained more of its pre-Covid ridershipthan any other line at 25.2 percent, followed by the RI at 22.7 percent. For the system, Metra has retained19% of its total ridership in 2021 compared to pre-Covid.Table 3: Estimated Passenger Trips by Rail 13.9%10.6%10.6%UP-NWUP-WAnnual Figure 4 on the following page shows the ridership by rail line since 1983.4
Figure 4: Annual Estimated Passenger Trips by Rail .51.00.50.01983202120022.01.51.00.50.01983Est. Trips 212021UP-NMD-W019832002NCSSWS15Est. Trips (Millions)Est. Trips (Millions)UP-NW0198382021Est. Trips (Millions)0.80.0198310RIEst. Trips (Millions)Est. Trips (Millions)HC2002Est. Trips (Millions)01983MD-NEst. Trips (Millions)20Est. Trips (Millions)Est. Trips (Millions)BNSF108642019832002202120022021
Ridership by Fare ZoneMetra records the valid zones for each ticket with specific zone requirements. By the end of 2021, allconductors were able to use the Ticket Daily Collection app to record tickets sold by zone pair, reducingthe quantity of tickets with unknown zone pairs. This caused an increase in the share of intermediate tripsin 2021. At the end of 2021, only conductor sales of the One Day Weekend Pass and 10 All Day Pass weresold without zone pair information.Changes in the zone pairs over time reflect changes in ridership patterns (See Figure 5). Between 2016and 2021, the share of trips with known fare zone pairs increased for zones A and B, with slight increasesseen in Zone C and Zones I-J. Zones D, E, and H did not see much change, with Zone F seeing a decreasein its share of trips. Fare collection was limited for the Union Pacific Lines from January to May 2021.Consequently, data in 2021 has limited comparability to prior years.The 2017-2018 Fare Structure Study recommendations implemented in July 2018 also influenced a shiftin ridership in Zones B and C while slowing ridership declines in Zone J. 83rd St. and 87th St. (ME-ML) and123rd St. (RI-Beverly) stations were reassigned from Zone C to B; State St. through Ashland stations (MEBI) were reassigned from Zone D to C. Fare Zones K-M (Woodstock, McHenry, Harvard, Antioch, andKenosha stations) were consolidated into Fare Zone J.Figure 5: Share of Estimated Passenger Trips to and from Zone A by Fare Zone**25%20%15%10%5%0%Zones A & BZone CZone DZone E2011Zone F2016Zones G & HZones I-JIntermediate*2021*Intermediate trips do not begin or end in Zone A**Note: Includes zone-pairs from all tickets sold in 2021 with fare zones. Onboard fare collection was limited on the UnionPacific lines from January to May 2021.6
Figure 6: Estimated Passenger Trips to and From Zone A by Fare ZoneZone C8Est. Trips (Millions)Est. Trips (Millions)Zones A & 202120032021IntermediateEst. Trips (Millions)Est. Trips (Millions)Zones I-J019852003Zones G & HEst. Trips (Millions)Est. Trips (Millions)Zone F019852021Zone EEst. Trips (Millions)Est. Trips (Millions)Zone D2003202143210198520032021Note: In 2018, 83rd St. and 87th St. (ME-ML) and 123rd St. (RI-Beverly) stations were reassigned from Zone C to B; State St.through Ashland stations (ME-BI) were reassigned from Zone D to C. Fare Zones K-M (Woodstock, McHenry, Harvard, Antioch,and Kenosha stations) were consolidated into Fare Zone J.7
Passenger Miles Note: This table has not been updated for 2021.Each year, Metra calculates the number of passenger miles traveled and the average trip length by line.The total number of passenger miles decreased by 75.5 percent in 2020 when compared to 2019. Averagetrip length decreased by 0.6 miles to 21.7 miles in 2020 compared to .0Passenger MilesAverage Trip Length 1820192020Estimated Passenger Miles(Millions)Figure 7: Passenger Miles and Average Trip Length*Average Trip Length*Free RTA Ride Free Permit rides are not included.Passenger Loads by Service PeriodPeak period/peak direction remains Metra’s largest ridership market. In 2021, 65.6 percent of weekdaytrips were taken in the peak period/peak direction. Figure 8 shows average daily passenger loads byservice period for the last five years. Saturday and Sunday passenger loads performed the strongest, risingto 46.2 percent of 2019 levels. During the week, midday service averaged 29.9 percent of 2019 passengerloads, while peak service reached 15.9 percent of 2019. Peak loads were the only service period thatdecreased from last year, at -33.9 percent. Overall, weekday off-peak loads increased 5.2 percent, withMidday loads seeing the largest increase of 8.9 percent. Saturday loads increased 72.4 percent and Sundayloads increased 79.6 percent compared to 2020.Average Daily Passenger Loads(Thousands)Average Daily Passenger Loadby Service Period (2017-2021)25020015010050Average Daily Passenger Loads(Thousands)Figure 8: Average Daily Passenger Loads by Peak201782018201920202021
Figure 9 shows a rolling three-month average of daily passenger loads by service period since 1984.Figure 9: Passenger Loads by Service Period (3 Month Rolling Average)Peak Period/Reverse Direction300Passenger Loads(Thousands)Passenger Loads(Thousands)Peak Period/Peak 0198420211996Sunday120Passenger Loads(Thousands)Passenger 02001984202155019842008EveningPassenger Loads(Thousands)Passenger Loads(Thousands)Midday1996101996200801984202191996
RTA Ride Free ProgramSenate Bill 1920 was signed into law in September 2008 granting free trips to riders with an issued CircuitPermit as part of the new People with Disabilities Ride Free Program. The legislation required free tripson fixed-route and regularly scheduled transit in the RTA’s service region available to any Illinois residentwho enrolled as a person with a disability in the Illinois Circuit Breaker Program. The People withDisabilities Ride Free Program officially began on October 24, 2008. As of September 6, 2011, the numberof Circuit-Permit trips also included the low-income seniors who qualified for the program. EffectiveJanuary 1, 2013, the state changed the name of the Circuit Breaker Program to the Benefit AccessProgram. The program is now referred to as the RTA Ride Free Program. In 2021, the number of free tripsreached 276,180, or 32.2 percent of 2019 levels. 2.0 percent of all trips in 2021 were made using an RTAFree Ride Permit, an increase from 1.2 percent of all trips in 2019.Table 4: RTA Ride Free Permit Trips 259*For 2008-2011 RTA Free Ride totals, see Metra’s 2020 Annual Ridership Report882,290857,348255,422276,180DecTotalPolice Officer and Firefighter Free RidesChicago-area uniformed police officers from any municipality, including sheriff’s deputies, bailiffs,corrections officers, and Chicago firefighters are allowed free transportation on Metra. These free tripsare not reimbursed by the State of Illinois. Conductors began recording the number of free trips taken bythese uniformed police officers and firefighters in April 2012. The number has decreased by 0.7 percentfrom 2020 to 2021.Table 5: Total Police Officers and Firefighters in Uniform Riding 9128167468,3391,544242217Annual 29017,72617,59611
RTA Reduced Fare TripsIn 2021, Metra offered reduced fares through the Regional Transportation Authority’s Reduced FarePermit Program (active on all lines). Costs for the RTA’s program are eligible for reimbursement from theState of Illinois. The following groups of riders are eligible to receive a reduced fare permit through theRTA’s Reduced Fare Permit Program. All senior citizens who are within three weeks of their 65th birthday or older Medicare card recipients receiving Social Security benefits People with disabilities who receive Social Security benefits Veterans with disabilities who receive Service-connected disability benefits People with disabilities whose doctors validate their disability Full-time students enrolled in an accredited grade school or high school with a valid letter ofcertification from their school (on school stationery) or a valid school I.D. bearing the student'sname, school name and authorized signature.Metra also offers reduced fare tickets to children ages 7 to 11 (saving 50 percent over One-Way fares) andto U.S. military personnel (may purchase One-Way or 10-Ride tickets at a reduced fare provided theypresent proper military identification indicating they are on active duty). Prior to the fare change effectiveFebruary 1, 2012, young adults (ages 12-17) were eligible for reduced fares on weekends and holidays.Table 6 shows all reduced fare passenger trips by year for 2007 through 2021. In 2008, state legislationrequired Metra to provide free rides to seniors under the Seniors Ride Free Program. This caused a -39.9percent drop in the number of reduced fare passenger trips in that year. This decision was reversed inSeptember 2011.Table 6: Reduced Fare Passenger Trips by s figure includes reduced fare rides for reimbursement from the State of Illinois anddoes not include conductor sales, group sales, or tickets purchased through the Fair TransitSouth Cook Pilot. While onboard fare collection was inactive on the Union Pacific linesfrom April 2020 to May 2021 and all lines April 2020 to May 2020, eligible customers wereable to independently purchase reduced fare tickets. These purchases are included in onlyTables 6 and 7 of this report.Year12
Table 7 shows total free trips and all reduced fare passenger trips by month.Table 7: Estimated Reduced Fare Passenger Trips by Total*Does not include tickets eligible for a reduced fare through the Fair Transit South Cook 00,610**Note: While fare collection was inactive on all Metra lines in April and May 2020, eligible customers were able to independently purchasereduced fare tickets.Cook County’s Fair Transit South Cook PilotThe Fair Transit South Cook Pilot began in January 2021 and offers reduced fare tickets to all riders on theME and RI lines. The Pilot is scheduled to last three years. Cook County has agreed to reimburse Metra forthe difference in price between full and reduced fare tickets. Riders may continue purchasing reducedfare tickets through other Metra programs. Tickets through the Pilot are marked as “South Cook” ticketsand are not valid for travel on other Metra lines. Riders wishing to transfer to another line must purchasea full fare ticket for that portion of their trip. Tickets for the Pilot are available through the mobile app andcommuter benefit program. South Cook tickets are also available at vending machines and ticket agentsalong the ME and RI lines only.Table 8 shows total ridership and the number of rides eligible for reimbursement on the ME and RI linesby Cook County through the Fair Transit South Cook Pilot.Table 8: ME & RI Total Ridership and Fair Transit South Cook Pilot al TotalTotal 957188,850179,941161,1491,836,7231,669,27313Fair Transit South Cook 3171,490158,359146,6081,587,6871,488,153
Accessible Equipment UsageMetra’s trains became fully accessible in April 1998, providing at least one accessible car per trainconsistent with the Americans with Disabilities Act (ADA). In 2021, Metra provided approximately 9,000passenger trips that utilized either ADA lifts on diesel lines or bridge plates on the Metra Electric, or 26percent of 2019 levels. Figure 10 shows the annual number of passenger trips utilizing the accessibleequipment since 1999.Accessible Passenger Trips(Thousands)Figure 10: Annual Passenger Trips Utilizing Accessible Equipment40353530252015111110950Bikes on Trains ProgramBeginning in June 2005, Metra implemented the Bikes-on-Trains program, permitting a limited number ofbicycles in each passenger car during weekday off-peak and weekend service periods. From October 2014to October 2020, bicycles were permitted on weekday inbound trains that arrive downtown before 6:30a.m. and during special events at the discretion of conductors. In October 2020, Metra tested its first bikecar on the Milwaukee District-North for select trains, accommodating up to 16 additional bicycles in thebike car. Bicycle restrictions were also relaxed in October, allowing bikes in designated areas without timerestrictions at the discretion of the conductor. In May 2021, bike cars were added to the BNSF and RI lines.Metra conductors reported nearly 146,000 bicycles brought onto Metra trains in 2021, representing 81.1percent of 2019 levels (see Figure 11) and represents 10% of riders bringing a bike on-board.Divvy bikeshare stations were first installed downtown in June 2013. Since then, their use has continuedto climb. Divvy introduced e-bikes in 2020, which could be locked anywhere in the Divvy service area foran additional fee.Bicycle Passenger Trips(Thousands)Figure 11: Bikes on Trains Program Usage3503002902501802001461501031005002005 2006 2007 2008 2009 2010 2011 2012 2013 2014 2015 2016 2017 2018 2019 2020 202114
III. 2021 RIDERSHIP INFLUENCESMetra provided an estimated 14.1 million passenger trips in 2021, representing 19.0 percent of 2019annual trips. Many factors contribute to year-over-year ridership changes. Some of these factors areunder Metra’s control (fare and service changes) while others are not (changes in employment and fuelprices). Recovery from the COVID-19 pandemic was the primary driver of ridership increases in 2021, asmore employers were able to bring some workers back to in-person work.Telecommuting, Flextime, and Compressed or Alternate Work SchedulesMany Metra riders had the option to telecommute before the COVID-19 pandemic. According to Metra’s2019 Origin-Destination Study, over half of Metra’s respondents (56 percent) reported telecommuting atleast one day per month. Of those, 46 percent say they telecommute 1 to 4 times a month. The first twoyears of COVID-19 drastically increased the number of workers who were allowed to telecommute andincreased their frequency. Employers gradually resu
Note: Values do not add to total ridership due to Group Sales, Marketing Sales, and Refund Adjustments; 2019 data may not match . 20 40 60 80 100 120 1984 1996 2008 2021 Passenger Loads (Thousands) Saturday 0 10 20 30 40 50 60 70 1