Transcription
KANSAS WATERSHED RESTORATION AND PROTECTIONSTRATEGY (WRAPS) PROJECTNEOSHO RIVER WATERSHED ASSESSMENTFINAL REPORTKDHE Project No. 2004-0029March 2012Prepared and Submitted by:Dr. Kyle R. Douglas-Mankin, Principal InvestigatorDr. Aleksey Y. SheshukovDepartment of Biological and Agricultural EngineeringKansas State University129 Seaton HallManhattan KS 66506785-532-2911krdm@ksu.edu
Table of ContentsAcknowledgements . 4Executive Summary . 5Introduction . 6Geographic Scope/Location . 6Population . 7Surface Water Resources . 12Designated Uses . 13Public Water Supplies (PWS) and National Pollutant Discharge Elimination System (NPDES) . 15Land Uses / Land Cover . 17Wildlife Habitat. 22Endangered Species. 23Recreational Areas. 24Watershed / Water Quality Conditions . 24Total Maximum Daily Loads (TMDLs) . 25The 303d List of Impaired Water Bodies . 31Goals, Objectives, and Tasks . 36Goals . 36Objectives . 36Tasks/Activities . 36Summary of Project Activities and Accomplishments . 37Timeframe . 37Inform and Educate Watershed Stakeholders . 37Activities . 37Establish Assessment Criteria . 40Inventory Existing Information . 40Provide Technical Information to Support Implementation Decisions . 41Watershed Atlas . 41TMDL Reports . 42Watershed Modeling . 44Neosho River WRAPS Assessment Project Final ReportPage 1
Soil and Water Assessment Tool (SWAT) . 44Data Collection . 45Pollutant Yields . 55STEPL Modeling . 57Critical Targeted Areas . 65Middle Neosho River Watershed . 65Upper Neosho River Watershed . 66Stakeholder engagement . 68Economic Analysis . 68General Economic Research . 68Work Products . 69Non-market valuation and input-output impact analysis . 70Next Steps / Transition into Planning Phase . 71Evaluation of Project Goal, Objectives, and Tasks . 72Conclusions, Recommendations, and Lessons Learned . 73Conclusions . 73Lessons Learned . 73Recommendations. 74Watershed modeling is important to the WRAPS Assessment process. . 74Watershed modeling remains highly sophisticated. . 74Believable watershed modeling requires technical skill and social connection. . 74References . 75Appendix A: Watershed Atlas. 1Appendix B: TMDLs. 2Appendix C: Financial Summary . 3Figures and TablesFigure 1 Maps of (a) Middle Neosho and (b) Upper Neosho River Watersheds 8Figure 2 HUC 12 Delineations in (a) Middle Neosho and (b) Upper Neosho River Watersheds 9Figure 3 Population density in (a) Middle Neosho and (b) Upper Neosho River Watersheds 11Figure 4 Map of alluvial aquifer underlying (a) Middle Neosho and (b) Upper Neosho RiverWatersheds 13Figure 5 Rural Water Districts (RWD) and Public Water Supply (PWS) Diversion Points in (a)Middle Neosho and (b) Upper Neosho River Watersheds 19Figure 6 Land cover map (2010 NASS Crop Data Layer) for the (a) Middle Neosho and (b) UpperNeosho River Watersheds 21Figure 7 Percentage of individual land uses (Based on 2010 Crop Data Layer) in the (a) MiddleNeosho and (b) Upper Neosho River Watersheds 22Figure 8 Map of rare species, protected areas, and areas with walk-in hunting access in (a)Middle Neosho and (b) Upper Neosho River Watersheds 24Neosho River WRAPS Assessment Project Final ReportPage 2
Figure 9 TMDL streams and lakes in the (a) Middle Neosho River and (b) Upper Neosho RiverWatersheds 30Figure 10 Streams on 303d list in the (a) Middle Neosho and (b) Upper Neosho River Watersheds33Figure 11 Neosho River Basin delineated with SWAT 46Figure 12 Topography map 47Figure 13 Land use map utilized in the SWAT model 48Figure 14 Soil map used in the SWAT model 50Figure 15 Maps of (a) total phosphorous, (b) total nitrogen, and (c) sediment yields in 17subbasins of the Middle Neosho River Watershed 53Figure 16 Maps of (a) Phosphorous (lb/acre), (b) Nitrogen (lb/acre), and (c) Sediment (tons/acre)Yields as Determined by SWAT in the Upper Neosho River Watershed 55Figure 17 Maps of (a) Phosphorous (lb/acre), (b) Nitrogen (lb/acre), and (c) Sediment (tons/acre)Yields as Determined by SWAT in the Upper Neosho River Watershed 59Figure 18 Total loads per each land use for Spring Watershed calculated with the STEPL model.62Figure 19 Maps of (a) Total phosphorous, (b) Total nitrogen, and (c) Total sediment yields in 22subbasins of the Lake O’ The Cherokees Watershed 63Figure 20 Total loads per individual land use for Lake O’ The Cherokees Watershed calculatedwith the STEPL model 64Figure 21 Critical targeted subwatersheds in Middle Neosho River Watershed 67Figure 22 Critical targeted subwatersheds in Upper Neosho River Watershed 68Table 1 Main populated areas in the Neosho River Watershed 10Table 2 Designated Water Uses 13Table 3 NPDES Sites 15Table 4 TMDLs in the Watershed 26Table 5 Impaired streams and lakes and water-quality sampling visits and times in the MiddleNeosho River Watershed 31Table 6 2008 303d List of Impaired Waters in the Middle Neosho River Watershed 34Table 7 2010 303d Delisted Waters 35Table 8 Areas of land uses and its classification used in SWAT model 49Table 9 Soil characteristics used in the SWAT model 50Table 10 Total pollutant loads for each subwatershed 56Table 11 Pollutant loads for each HUC-12 subwatershed 60Table 12 Pollutant loads for each HUC-12 subwatershed 64Neosho River WRAPS Assessment Project Final ReportPage 3
AcknowledgementsThis project was made possible with financial support provided by State Water Plan fundsadministered by the Kansas Department of Health and Environment – Watershed ManagementSection, granted to K-State Research and Extension through the Kansas WRAPS (WatershedRestoration and Protection Strategy) – Neosho River Basin Assessment project (2004-0029).The Assessment phase of this project resulted from the dedicated team effort of these KSUpersonnel: Aleksey Y. Sheshukov, Watershed ModelerAmir Pouyan Nejadhashemi, Watershed ModelerJosh Roe, Watershed EconomistSumathy Sinnathamby, Graduate Student, Watershed ModelerCraig M. Smith, Watershed EconomistRobert M. Wilson, Watershed PlannerSue P. Brown, Watershed CommunicationJohn C. Leatherman, Professor, Agricultural EconomicsWilliam Hargrove, past KCARE DirectorNeosho River WRAPS Assessment Project Final ReportPage 4
Executive SummaryThis project served to compile and develop watershed environmental and economicinformation to assist stakeholders in the Neosho River Basin Watershed (two watershedsdownstream from John Redmond Reservoir) to develop a Watershed Restoration and ProtectionStrategy (WRAPS) Plan and Report. The Neosho River Basin downstream from John RedmondReservoir is divided into three main watersheds located within Kansas borders: Upper NeoshoRiver watershed, Middle Neosho River watershed, and Spring River watershed. Drainage areasof Upper Neosho River and Middle Neosho River watersheds are exclusively in Kansas.Initiated in June 2006, this WRAPS Assessment Phase project was completed by July 2009.Project accomplishments include: Watershed Assessment: We compiled existing information related to the Middle NeoshoRiver Watershed, culminating in development and publication of a Watershed Atlas.Watershed Modeling: We completed the SWAT modeling analysis of current watershedconditions. General assessment information (limited watershed modeling with STEPL) wasconducted for Spring Watershed and Lake O’ The Cherokees Watershed.Economic Analysis: We developed user-friendly decision tools for stakeholder groups toanalyze and compare economic and environmental effects of cropland BMPs, vegetativebuffer systems, streambank stabilization systems, and tillage systems.Two stakeholder leadership teams (SLT) were established in 2008 for Upper Neosho River andMiddle Neosho River Watersheds and actively participated in a critical review of the assessmentactivities including modeling findings of targeted areas, discussions on non-point sourcepollution areas in the watershed that could not be identified with SWAT, like areas with highconcentration of livestock produced nutrient contribution to stream pollution.The SLTs were engaged in the process of clarifying WRAPS objectives and assessment needs,refining watershed information and modeling data, reviewing modeling results, and assessingeconomic and environmental impacts of various management scenarios. Groundtruthing ofSWAT identified targeted areas assisted in identifying current BMP implementation rates in thetargeted areas and provided basis for economic analysis of future BMP implementationscenarios.Neosho River WRAPS Assessment Project Final ReportPage 5
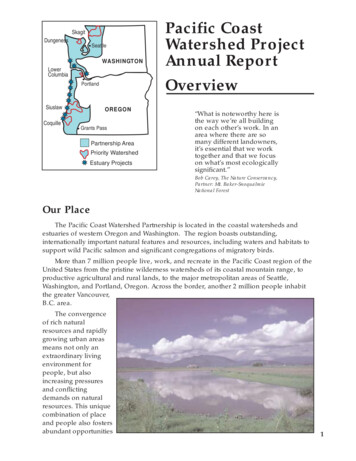
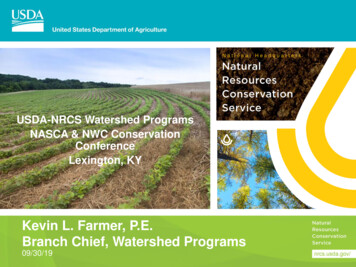
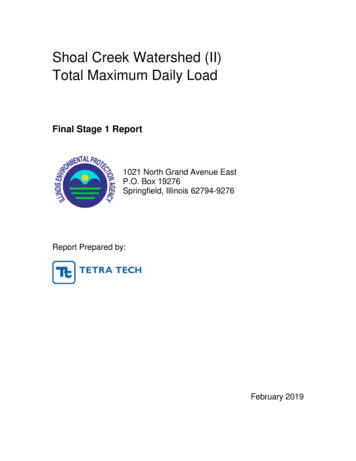
IntroductionThe Neosho River Basin covers three HUC-8 watersheds below John Redmond Reservoir andabove Kansas/Oklahoma state line: Upper Neosho River watershed, Middle Neosho Riverwatershed, and Spring River watershed. Upper Neosho River and Middle Neosho Riverwatersheds are exclusively in Kansas while Spring River watershed lies in Kansas, Oklahoma, andMissouri. In Upper Neosho River and Middle Neosho River watersheds individual StakeholderLeadership Teams were formed and watershed management and assessment activities wereindependent from each other. Therefore, in the sections below, Upper Neosho River and MiddleNeosho River watersheds will be discussed separately.Geographic Scope/LocationThe Middle Neosho River Watershed (HUC 11070205) is located primarily in Neosho,Crawford, Labette, and Cherokee counties in southeast Kansas, with small drainage areasoriginating from Allen and Bourbon counties (Figure 1a). The watershed primarily includesNeosho River drainage area, about 912,698 acres and its numerous tributaries. The watershedhas upper boundary with an elevation of 677 meters (2,221 feet) and the outlet at the KansasOklahoma state line, with 200 meters (656 feet) above sea level. Parsons Lake, Neosho StateFishing Lake, Altamont and Bartlett State Fishing Lakes are some examples of lakes within thiswatershed. The Middle Neosho Watershed is comprised of six HUC 10 delineations(1107020501, 1107020502, 1107020503, 1107020504, 1107020505 and 1107020506) and 33HUC 12 (110702050101, 110702050102, 110702050103, 110702050104, 110702050105,110702050106, 110702050107, 110702050108, 110702050109, 110702050201, 110702050202,110702050203, 110702050204, 110702050205, 110702050301, 110702050302, 110702050303,110702050304, 110702050305, 110702050501, 110702050502, 110702050503, 110702050504,110702050505, 110702050601, 110702050602, 110702050603, 110702050604 and110702050604) delineations (Figure 2a).The Middle Neosho Watershed includes areas of mined land and wildlife. The areas mined forcoal formed many small depressions and lakes. Kansas Department of Health and Environment(KDHE) and the United States Department of Agriculture (USDA) designated the Middle NeoshoWatershed as a Category I watershed indicating that it is in need of restoration in Kansas UnifiedWatershed Assessment 1999. Also, the Middle Neosho is ranked 24th in the priority watershedlist among 92 watersheds in the state.Neosho River WRAPS Assessment Project Final ReportPage 6
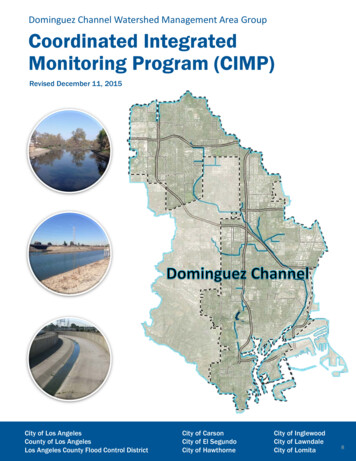
The Upper Neosho River Watershed is located in Southeast Kansas primarily in Coffey County,Anderson County, Woodson County, Allen County, Wilson County and Neosho County (Figure1b). The Upper Neosho River watershed has 11070204 HUC 8-digit code number. The watershedarea includes five HUC 10 subwatersheds (1107020401, 1107020402, 1107020403, 1107020404,1107020405) and thirty-one HUC 12 subwatersheds (110702040101, 110702040102,110702040103, 110702040104, 110702040105, 110702040106, 110702040107, 110702040201,110702040202, 110702040203, 110702040204, 110702040205, 110702040206, 110702040301,110702040302, 110702040303, 110702040304, 110702040305, 110702040306, 110702040401,110702040402, 110702040403, 110702040404, 110702040405, 110702040406, 110702040407,110702040501, 110702040502, 110702040503, 110702040504, 110702040505) (Figure 2b).The Upper Neosho River Watershed includes 668 miles of stream and covers 862,080 acres ofland. There are numerous towns and cities and no major reservoirs within this watershed.Elevation of the Upper Neosho River Watershed ranges from 200 meters (656 feet) to 677meters (2,221 feet) above sea level. In 1999 Kansas Unified Watershed Assessment submittedby the Kansas Department of Health and Environment (KDHE) and the United States Departmentof Agriculture (USDA) had Upper Neosho River Watershed designated as Category I watershedindicating that it is in need of restoration. In addition it was also prioritized for restoration.Among ninety-two watersheds in Kansas State, the Upper Neosho River Watershed is rankedtwentieth in priority. Upper Neosho River Watershed with other branches has nutrients,sediment and bacteria contribution into Grand Lake located in North-East Oklahoma.PopulationThe Middle Neosho River Watershed has population of 35,158 people and the Upper NeoshoRiver Watershed has population of 35,067 according to the Census 2000 (Table 1). Thepopulation density ranges from 0 to 448. Labette County has the highest population densitywithin Middle Neosho River watershed whereas Allen County has the largest population(13,520) in Upper Neosho River watershed. The spatial distribution of the population (based on2000 census data) is shown in Figure 3.Neosho River WRAPS Assessment Project Final ReportPage 7
(a)(b)Figure 1 Maps of (a) Middle Neosho and (b) Upper Neosho River WatershedsNeosho River WRAPS Assessment Project Final ReportPage 8
(a)(b)Figure 2 HUC 12 Delineations in (a) Middle Neosho and (b) Upper Neosho River WatershedsNeosho River WRAPS Assessment Project Final ReportPage 9
Table 1 Main populated areas in the Neosho River ESMiddle Neosho 21Total351581733017828138849513Upper Neosho 157141829619Neosho River WRAPS Assessment Project Final ReportPage 10
(a)(b)Figure 3 Population density in (a) Middle Neosho and (b) Upper Neosho River WatershedsNeosho River WRAPS Assessment Project Final ReportPage 11
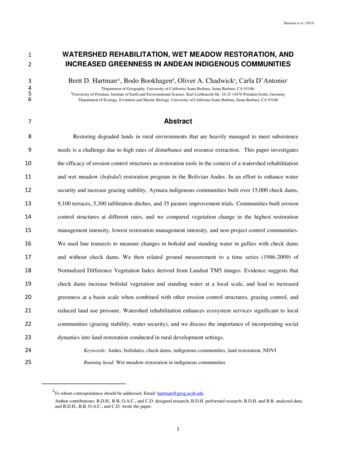
Surface Water ResourcesThe Neosho River along with its tributaries are the primary waterways of Neosho RiverWatershed. The Neosho River continues further south in Oklahoma State and drains into GrandLake. The Neosho River Watershed has two aquifers (Figure 4): Alluvial Aquifer - The alluvial aquifer is a part of and connected to a river system andconsists of sediments deposited by rivers in the stream valleys. The Neosho River has analluvial aquifer that lies along and below the rivers. Ozark Aquifer - The Ozark Aquifer extends from southeastern Kansas and easternOklahoma east to St. Louis and south into Arkansas. It is mainly comprised of limestoneand dolomite. Historically, water from this aquifer is very hard.(a)Neosho River WRAPS Assessment Project Final ReportPage 12
(b)Figure 4 Map of alluvial aquifer underlying (a) Middle Neosho and (b) Upper Neosho River WatershedsDesignated UsesNeosho River is primarily used for public swimming. Designated uses (Kansas Surface WaterRegister, KDHE, 2004) other surface waters in this watershed are aquatic life support (fish),human health purposes, domestic water supply, recreation (fishing, boating, swimming),groundwater recharge, industrial water supply, irrigation and livestock watering (Table 2).Table 2 Designated Water UsesStream NameMiddle Neosho RiverBachelor Creek (seg 396), Center Creek, DennyBranch, Downey Creek, Fourmile Creek,Grindstone Creek, Hackberry Creek, LimestoneCreek, Little Cherry Creek, Little Elk Creek, LittleFly Creek, Little WalnutCreek, Litup Creek, Mulberry Creek, MurphyCreek, Ogeese Creek, Pecan Creek, PlumCreek, Rock Creek, Stink Branch, ThunderboltCreek, Tolen Creek, Town Creek,Bachelor Creek (seg 40), Canville Creek,Cherry Creek, Deer Creek, Elk Creek, ElmCreek, Flat Rock Creek (seg 14), HickoryCreek, Lake Creek, Lightning Creek, LittleLabette Creek, Spring Creek, Walnut Creek,Fly CreekALCRDSFPGRIWIRLWEEENeosho River WRAPS Assessment Project Final ReportXCXPage 13
Flat Rock CreekLabette Creek (seg 21 and 22)Labette Creek (seg 20), Neosho RiverTurkey CreekUnnamed Stream (seg 298, 303, 304, 305),Wolf CreekAltamont City Main Lake,Altamont City West Lake, MinedLand Lake #10, 11, 12, 13, 14, 17, 18, 19, 20,21, 22, 23, 24, 25, 27, 28, 29, 30, 31, 32, 33,34, 35, 36, 37, 38, 39, 40, 41, 42, 43, 44, 45,Mined Lake #42 WetlandBartlett City Lake, Timber LakeHarmon Wildlife AreaNeosho County SFLNeosho Wildlife AreaParsons LakeUpper Neosho RiverBadger Cr, Big Cr, N, Carlyle Cr,Charles Br, Draw Cr, Elm Cr,Goose Cr, Indian Cr, Mud Cr,Owl Cr, Plum Cr, School Cr,Scott Cr, Slack Cr, Sutton Cr,Turkey Br, Twiss Cr, Varvel CrBig Cr Seg 14Big Cr Seg 2Big Cr S, Cherry Cr, Coal Cr,Cottonwood Cr, Crooked Cr,Dinner Cr, Long Cr, Martin Cr,Rock Cr, Spring Cr, Turkey CrSeg 18, Village CrBloody Run, Little Indian Cr,Onion Cr, Owl Cr S, Wolf CrDeer CrNeosho RLittle Turkey CTurkey Cr Seg 32Chanute Santa Fe Lake, Iola CityLake, John Redmond WildlifeArea,Circle Lake, Leonard’s LakeGridley City LakeNeosho Falls City Lake, NewStrawn Park LakeWolf Cr LakeYates Center CXXXXXXEEXXXXEbbBSEBAEEEBBAXXXOXXXXAquatic Life SupportGroundwater RechargeContact Recreation UseIndustrial Water SupplyNeosho River WRAPS Assessment Project Final ReportPage 14
DSIRFPLWABbCSEXOBlankDomestic Water SupplyIrrigation Water SupplyFood ProcurementLivestock Water SupplyPrimary contact recreation lakes that have a posted public swimming areaPrimary contact recreation stream segment is by law or written permission of thelandowner open to and accessible by the publicSecondary contact recreation stream segment is not open to and accessible by thepublic under Kansas lawPrimary contact recreation lakes that are not open to and accessible by the publicunder Kansas lawSpecial aquatic life use waterExpected aquatic life use waterReferenced stream segment is assigned the indicated designated useReferenced stream segment does not support the indicated beneficial useCapacity of the referenced stream segment to support the indicated designated usehas not been determined by use attainability analysisPublic Water Supplies (PWS) and National Pollutant DischargeElimination System (NPDES)KDHE regulates wastewater treatment facilities fail rate within this watershed. Maximumamount of point source pollutants allowed to be discharged is controlled by National PollutantDischarge Elimination System (NPDES). The watershed has numerous NPDES and wastewatertreatment facilities (Table 3). P water supply diversion points and rural water districts in additionto countless private wells within this watershed are shown in Figure 5. Groundwater is the mainsource of pollution in public PWS with pollutants like sediment, nutrient and E. coli. Other thanCity of New Strawn, all other water supply points use surface water. City of New Strawn getsPWS from groundwater.Table 3 NPDES SitesFacility NameMiddle NeoshoRiverKansas Gas& Elect CoParsonsMccune CityOf StpGirard CityOf WwtpStark City OfWwtpHepler CityOf StpUs ficationCityCountyPub PriElectricalServicesPrimary alStarkNeoshoMunicipalHeplerCrawfordNot On ElParsonsLabettePublicPublicPublicFederalNeosho River WRAPS Assessment Project Final ReportPage 15
AmmunitionChetopaCity OfWwtpParsonsWater & SewerDeptAltamontCity Of StpErie City OfWwtpOswego CityOf StpSavonburgCity OfWwtpScammonWastewaterTreatment FWestMineral CityOf WwtpBartlett CityOf WwtpCherokeeWwtpWalnut CityOf WwtpSt. Paul CityOf MunicWwtpMidwestMinerals,Inc. Quarry7NelsonQuarry dwestMinerals IncQuarry 21MidwestMinerals IncQuarry 3Upper icipalSaint PaulNeoshoPrivateMeat PackingPlantsOn ElgNeoshoCountyNeoshoPub PriErieNeosho0.00000NelsonQuarryErie/beachnerPub PriParsonsLabette0.00000Pub PriPrivateGalesburgCrushed AndBrokenLimestoneCrushed AndBrokenLimestoneNeoshoOn urgCrawfordOn licNeosho River WRAPS Assessment Project Final ReportPage 16
Iola City OfStpIola City OfMunicPowerPlantAllenCountySewer Dist1 WwtpNelsonQuarrystokesQuarryLaharpeMwwtfColonyMun WwtfWolf CreekGeneratingStationBurlington‐ MunicipalPltGridleyCity Of StpLeroy CityOf StpAsh GroveCement CoChanute PChanuteWwtp (NewPlant)Chanute,City OfPower Plnt3YatesCenter CityOf StpPublicPub llenPrimary rivateCrushed ectricalServicesOn ElgLa HarpeAllenMunicipalLa HarpeAllenMunicipalColonyAndersonPrimary OBurlingtonCoffeyBurlingtonCoffeyPublicPublicPub PriPub aulicMunicipalGridleyCoffeyMunicipalLe RoyCoffeyOn uteNeoshoPublicElectricalServicesOn sCenterWoodsonPublicPrivateLand Uses / Land CoverThe primary land uses in the Middle Neosho River watershed are grassland (53.7%) andcropland (Figure 6 and Figure 7). Cultivated land within this watershed does not have anybuffers and only low percentage of land is used in continuous no-till. With a relatively highannual rainfall amount, the watershed has high potential for erosion and nutrient runoff thatoriginates in cropland areas. Cropland is the major source of pollutant. Grassland can contributeE. coli bacteria from grazing livestock manure. The remainder of the land has deciduous forest(10%) and urban open land (4.5%).Neosho River WRAPS Assessment Project Final ReportPage 17
The major land use in the Upper Neosho River Watershed is grassland (68.54 %), followed bycropland (Figure 6 and Figure 7). Nutrients and fecal bacteria from livestock, sediment fromovergrazed grassing lands and croplands, and fertilizer and manure from cropland can be majorpollutants in this watershed. Other land uses consist of deciduous forest (8.3 %) and opendeveloped areas (4.1 %).(a)Neosho River WRAPS Assessment Project Final ReportPage 18
(b)Figure 5 Rural Water Districts (RWD) and Public Water Supply (PWS) Diversion Points in (a) Middle Neoshoand (b) Upper Neosho River WatershedsNeosho River WRAPS Assessment Project Final ReportPage 19
(a)Neosho River WRAPS Assessment Project Final ReportPage 20
(b)Figure 6 Land cover map (2010 NASS Crop Data Layer) for the (a) Middle Neosho and (b) Upper NeoshoRiver Wa
Neosho River drainage area, about 912,698 acres and its numerous tributaries. The watershed has upper boundary with an elevation of 677 meters (2,221 feet) and the outlet at the Kansas Oklahoma state line, with 200 meters (656 feet) above sea level. Parsons Lake, Neosho State