Transcription
Cosmic Ray Muon DetectionMeasurements of Cosmic Ray Muon Flux andMuon Lifetime Using Scintillation DetectorsDepartment of Physics and Space SciencesFlorida Institute of TechnologyG. Karagiorgi, J. Slanker, and M. HohlmannG. Karagiorgi – Florida Academy of Sciences 2004
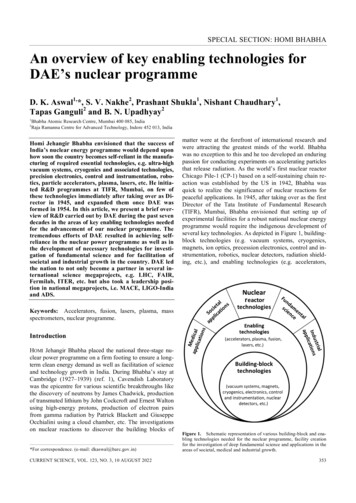
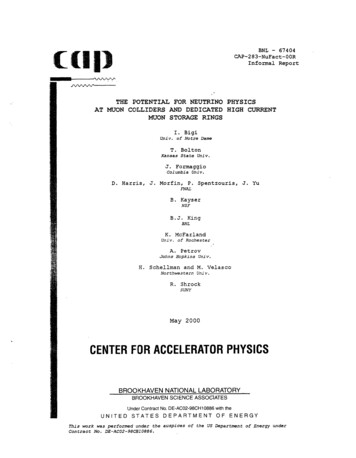
Cosmic Ray Muons: µ- µ Cosmic raysmostly protons that come fromouter space Air showerdifferent subatomic particles arecreatedπ - Æ µ- µπ Æ µ νµFigure 2:Developmentof Cosmic RayAir ShowerFigure 1: Cosmic Ray Air ShowerG. Karagiorgi – Florida Academy of Sciences 2004
SummaryUsing a setup of two scintillation detectors Flux Count rate Energy Variationof muons originating from cosmic ray air showers were investigated.The factors considered were: Amount of material muons travel through Zenith angle Setup configuration of the detection system (overlap area and separation distance)Finally, the method of detection allowed for verification of the theoretical value for themuon lifetime.G. Karagiorgi – Florida Academy of Sciences 2004
BackgroundFluxMuons reach the surface of the Earth with typically constantflux Fµ: (count rate) d2Fµ �——(area of top panel) (area of bottom panel)[Horizontal detectors]Fµ 0.48 cm-2min-1sterad-1 (PDGFigure 5: Detector Setuptheoretical value)Count rate: 0.585cm-2min-1(for horizontal detectors)Our experimental value: 36min-1(8% efficiency)The flux varies with zenith angle θ as:Fµ cos2θG. Karagiorgi – Florida Academy of Sciences 2004Figure 6:Zenith Angle θ
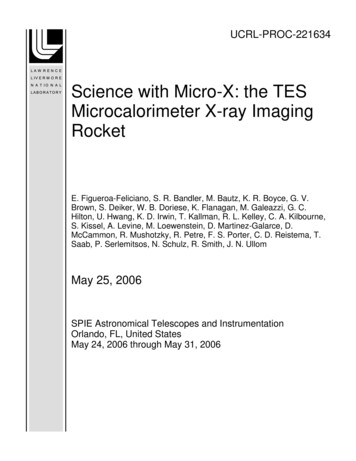
Setup SpecificationsFigure 3: Schematic Diagramfor the ScintillatorsA sc intillation d etec torhas the property toemit a small flash oflight (i.e. a sc intillation)when struck by ionizing rad iation.Figure 4: Detector SetupThe technique of recording“coincidences” Results in elimination of background noise Offers a great number of possible experimentsG. Karagiorgi – Florida Academy of Sciences 2004The setup is suchthat the counteron the DAQ boardand the computera rere c o rd ing“coincid ences”, i.e. signals sentfrom both detectors at the sametime.
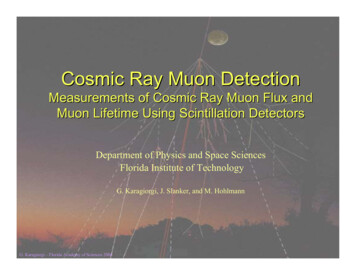
ResultsInvestigation of Flux VariationA rotational mount was constructed that allowedvariation of the zenith angle of the setup keepingall other parameters constantflux (count/min.cm 2.sterad) With zenith angleflux vs. (cosθ) 0.40.60.811.2(cosθ) 2Plot 2: Flux Dependence on Zenith Angle Θflux vs. θflux (count/min.cm 2.sterad)Figure 8: Rotation 10.00050-100Plot 3: Flux Dependence on CosineSquared of Zenith Angle ΘG. Karagiorgi – Florida Academy of Sciences 2004-500θ (degrees)50100
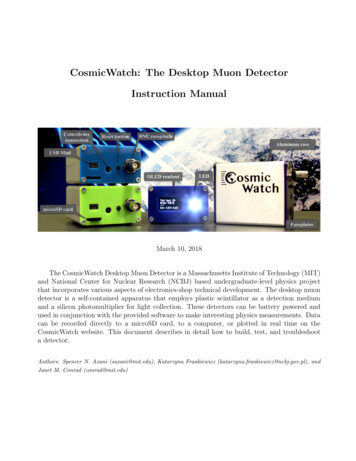
ResultsInvestigation of Flux VariationFlux vs. floor level With material above detectors0.004flux (count/min.cm 2.sterad)Data were collected on the 7 differentfloors* of Crawford Building,on the Florida Tech ure 7: 7th floor,Crawford Building,Florida TechCampus*All measurements were taken alongthe same vertical axis, except for theone on the 7th floorG. Karagiorgi – Florida Academy of Sciences 20041234floorPlot 1: Flux Dependence on Material Above Detectors5678
ResultsInvestigation of Flux Variation With overlap areaflux (count/min.cm 2.sterad)The measurement was conducted to confirm theindependence of flux with detection area, as wellas to define any possible non-uniformities in theactive area of the scintillation paddlesflux vs. overlap 30.00150050100150% overlapPlot 4: Flux Dependence on Overlap (Detection) AreaFigure 9: Scintillation Paddle Configuration for Overlap AreaMeasurementG. Karagiorgi – Florida Academy of Sciences 2004
ResultsInvestigation of Count Rate Variation With overlap areacount rate (min -1)The measurement was conductedto confirm the linear dependenceof count rate with detection areacount rate vs. overlap area (min separationdistance)35y 0.2971x 1.442530R 2 0.993825Series120Series215Linear (Series1)10Linear (Series2)5y 0.2575x 1.58750050100150% overlapPlot 5: Count Rate Dependence on Overlap (Detection) AreaG. Karagiorgi – Florida Academy of Sciences 2004R 2 0.9998
ResultsInvestigation of Count Rate Variation With separation distance between the two paddlesThe paddles were placed in a rectangular arrangement. The active area (horizontal) was kept constant(lxl), and the separation distance d was altered in multiples of lcount rate (about vertical direction) vs. separation distancedstereo angle vs. d1.612.001.410.001.2counts/minstereo angle (*π sterad)1.810.80.60.48.006.004.002.000.200.000246d (in multiples of l)Figure 10: Theoretical Dependence of Stereo Angle,Calculated Using Mathematica Integral OutputG. Karagiorgi – Florida Academy of Sciences 20048020406080100120distance d (cm)Plot 6: Experimental Count Rate Dependence on SeparationDistance d
ResultsInvestigation of Energy Variationdata plot for double hits at different anglesUsing a QuarkNet DAQ v.1 board, lowenergy (decaying) muon events wererecorded on the computer. Theseevents are called “doubles”200180160140120# of doubles100% of doubles80total # of hits6040200-100-50050angle θ (degrees)Figure 11: Coincidence Event from a Decaying Muon,Recorded as a Double EventG. Karagiorgi – Florida Academy of Sciences 2004Plot 7: Double Event Flux Dependence on Zenith Angle Θ100
ResultsMuon Lifetime MeasurementThe muon lifetime was calculated using the QuarkNet DAQ v.1 board data for double events.The decay time tdecay of an initial sample N0 of decaying muons was recorded.N(t) was plotted and the data were fitted to an exponential curve of the form:N(t) N0e-t/Twhere T muon lifetimeResults:Fit line:y -63.856 616.791e-0.4552xLifetime T:T 2.1965µsTheoretical lifetime Tth:T 2.1970µsPlot 8: Muon Lifetime Experiment CurveG. Karagiorgi – Florida Academy of Sciences 2004
PhotosRotationMountFlux Measurements, Ground Floor of CrawfordBuildingRotation Mount and Setup forFlux MeasurementG. Karagiorgi – Florida Academy of Sciences 2004
The EndG. Karagiorgi – Florida Academy of Sciences 2004
Acknowledgements http://pdg.lbl.gov/2002/cosmicrayrpp.pdf our.html /muon/G. Karagiorgi – Florida Academy of Sciences 2004
Questions?G. Karagiorgi – Florida Academy of Sciences 2004
on the Florida Tech Campus Plot 1: Flux Dependence on Material Above Detectors Figure 7: 7th floor, Crawford Building, Florida Tech Ca*All measurements mpus were taken along the same vertical axis, except for the one on the 7th floor Flux vs. floor level 0 0.0005 0.001 0.0015 0.002 0.0025 0.003 0.0035 0.004 012345678 floor f l ux (c oun t / m i .


![[AWS Black Belt Online Seminar] AWS X-Ray](/img/17/20200526-blackbelt-x-ray.jpg)