Transcription
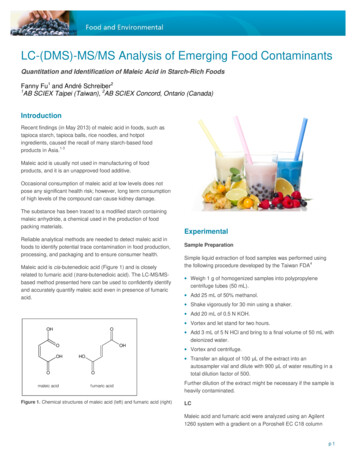
LC-(DMS)-MS/MS Analysis of Emerging Food ContaminantsQuantitation and Identification of Maleic Acid in Starch-Rich FoodsFanny Fu1 and André Schreiber21AB SCIEX Taipei (Taiwan), 2AB SCIEX Concord, Ontario (Canada)IntroductionRecent findings (in May 2013) of maleic acid in foods, such astapioca starch, tapioca balls, rice noodles, and hotpotingredients, caused the recall of many starch-based food1-3products in Asia.Maleic acid is usually not used in manufacturing of foodproducts, and it is an unapproved food additive.Occasional consumption of maleic acid at low levels does notpose any significant health risk; however, long term consumptionof high levels of the compound can cause kidney damage.The substance has been traced to a modified starch containingmaleic anhydride, a chemical used in the production of foodpacking materials.ExperimentalReliable analytical methods are needed to detect maleic acid infoods to identify potential trace contamination in food production,processing, and packaging and to ensure consumer health.Sample PreparationMaleic acid is cis-butenedioic acid (Figure 1) and is closelyrelated to fumaric acid (trans-butenedioic acid). The LC-MS/MSbased method presented here can be used to confidently identifyand accurately quantify maleic acid even in presence of fumaricacid. Weigh 1 g of homogenized samples into polypropylenecentrifuge tubes (50 mL).Simple liquid extraction of food samples was performed using4the following procedure developed by the Taiwan FDA Add 25 mL of 50% methanol. Shake vigorously for 30 min using a shaker. Add 20 mL of 0.5 N KOH. Vortex and let stand for two hours.OHOOOHOmaleic acid Add 3 mL of 5 N HCl and bring to a final volume of 50 mL withdeionized water.OHHOOf umaric acidFigure 1. Chemical structures of maleic acid (left) and fumaric acid (right) Vortex and centrifuge. Transfer an aliquot of 100 μL of the extract into anautosampler vial and dilute with 900 μL of water resulting in atotal dilution factor of 500.Further dilution of the extract might be necessary if the sample isheavily contaminated.LCMaleic acid and fumaric acid were analyzed using an Agilent1260 system with a gradient on a Poroshell EC C18 columnp1
4.593.5e6maleic acid3.0e6Intensity, cps2.5e62.0e61.5e6fumaric me, min4.55.05.56.06.57.07.58.0Figure 1. LC-MS/MS analysis of maleic acid and fumaric acid(150 x 3.0 mm, 2.7 μm) and a mobile phase of water containing0.1% formic acid (A) and methanol containing 0.1% formic acid(B). The flow rate was set to 0.3 mL/min. Gradient details arelisted in Table 1. A sample volume of 10 μL was injected.LC-MS/MS data were processed using the MultiQuant software version 2.1.Table 2. MRM transitions and retention times of maleic acid and fumaricacidTable 1. LC gradient used for the separation of maleic acid and fumaricacidTime (min)Flow (mL/min)A (%)B .00.3982MS/MS The AB SCIEX QTRAP 5500 was used with the Turbo V source and an Electrospray Ionization (ESI) probe. The massspectrometer was operated in Multiple Reaction Monitoring(MRM) mode using negative polarity. Two selective MRMtransitions were monitored using the ratio of quantifier andqualifier ion for identification (Table 2).In addition, SelexION differential mobility separation wasinvestigated to increase selectivity, improve Signal-to-Noise(S/N), and increase confidence in identification.CompoundQ1 (amu)Q3 (amu)CE (V)Maleic acid 111571-11Maleic acid 211532-28Fumaric acid 111571-11Fumaric acid 211532-28Results and DiscussionAn example chromatogram of the detection of maleic acid andfumaric acid is shown in Figure 1.First, the limit of quantitation (LOQ), linearity, and repeatabilitywere evaluated using injections of maleic and fumaric acidstandards ranging from 0.5 to 200 ng/mL and spiked matrixsamples.Both compounds had LOQ values in the sub ng/mL range,allowing a sample extract dilution to minimize possible matrixeffects. Linearity was excellent with a regression coefficient of0.999 for quantifier and qualifier transitions. The accuracy valuesranged from 89.6 to 107.6% across the linear dynamic range(Figure 2).p2
blank(115/71)0.51.02.0blank(115/32)0.51.02.0Figure 2. Chromatograms of the quantifier and qualifier transition of maleic acid of the blank sample and at concentration of 0.5, 1.0, and 2.0 ng/mL(top) and calibration lines from 0.5 to 200 ng/mL (bottom)Repeatability was evaluated using 7 injections at 5 ng/mL. Thecoefficient of variation (%CV) was 2.9% for the quantifiertransition (115/71) and 1.8% for the qualifier transition (115/32).A number of food samples were analyzed for maleic and fumaricacids, including noodles, tapioca starch, and processed foods.The analysis of a 20 ppb spiked blank extract gave 91.9%recovery.Table 3. Maleic acid findings in different food samplesConcentration(mg/kg)MRM ratioExpected MRMratioNoodles0.180.0520.049Tapioca starch47900.0570.049Processed food36.70.0550.04920 ppb spike inblank extract18.4(91.9% recovery)0.0570.049Compoundp3
Figure 3. Results for maleic acid in different food samples, the ‘Multicomponent’ query in MultiQuant software was used to identify target analytesbased on their MRM ratioTable 3 and Figure 3 show quantitative and qualitative results.MRM ratios were calculated using the ‘Multicomponent’ query inMultiQuant software.In a last experiment we investigated the use of SelexION differential mobility separation (DMS) to increase selectivity andconfidence in identification.SelexION uses a planar differential mobility device thatattaches between the curtain plate and orifice plate of the QTRAP 5500 system (Figure 4). An asymmetric waveform,called Separation Voltage (SV), combined with a CompensationVoltage (CoV) is used to separate ions based on difference in5-6their mobility.Orifice plateDMS cellCurtain plateFigure 4. SelexION differential mobility separation (DMS)Chemical modifiers, like isopropanol, methanol, or acetonitrile,can be introduced into the transport gas via the curtain gas toalter the separation characteristics of analytes.p4
SV and CoV were optimized for maleic and fumaric acids toseparate these two isomers with identical MRM transitions. Bestseparation and highest selectivity was achieved using an SV of3600 V and CoV of -8.0 V and -10.5 V, respectively (Figure 5).The added selectivity resulted in reduced backgroundinterferences. The presence of an MRM signal in combinationwith an optimized CoV value can also be utilized as an additional‘identification point’ to increase confidence in data quality.maleic acidSummaryThe method and data presented here showcase the fast, easy,and accurate solutions for the analysis of maleic acid andfumaric acid in starch-rich foods by LC-MS/MS and LC-DMS MS/MS. The AB SCIEX QTRAP 5500 systems provideexcellent sensitivity and repeatability for this analysis, withminimal sample preparation allowing maximized throughput forthe analysis of many samples in a short time period.Maleic acid was quantified in different food samples. MRM ratiocalculations in MultiQuant software used for compoundidentification. SelexION differential mobility separation wasalso used successfully to further increase selectivity and toclearly differentiate between isomeric species adding another‘identification point’ and increased confidence to the results.fumaric acidReferences12Figure 5. Compensation voltage (CoV) ramps for maleic and fumaricacid, best separation and highest selectivity was achieved using CoV of-8.0 V and -10.5V, respectiviely345XIC of -MRM (2 pairs): 115.000/71.000 Da ID: Maleic acid 1 from Sample 6 (2mix-10ppb) of 20130705 MA.wiff (Turbo Spray), SmoothedIntensity, cpsDMS offmaleic acid1.5e561.0e5fumaric .010.0Time, minXIC of -MRM (30 pairs): 115.000/71.000 Da ID: CoV -7.5 from Sample 1 (2mix) of 20130705-DMS.wiff (Turbo Spray), Smoothed7.011.1911.8611.012.5812.013.0013.013.97 14.20 14.7914.015.0Max. 2.8e4 cps.4.902.8e42.5e4maleic acid2.0e4Intensity, cpsMax. 2.0e5 aspx?ID 9918&chk 3748D6/26074/Pressrelease sid 3503B.B. Schneider, T. R. Covey, S.L. Coy, E.V. Krylov, E.G.Nazarov: Int. J. Mass Spectrom. 298 (2010) 45-54B.B. Schneider, T. R. Covey, S.L. Coy, E.V. Krylov, E.G.Nazarov: Anal.Chem. 82 (2010) 1867-1880DMS on(CoV – 8.0 8.09.010.0Time, minXIC of -MRM (30 pairs): 115.000/71.000 Da ID: CoV -10.5 from Sample 1 (2mix) of 20130705-DMS.wiff (Turbo Spray), Smoothed11.012.013.014.015.0Max. 5175.0 cps.6.045000Intensity, cpsDMS offfumaric acid4000(CoV – 10.5 V)30002000100000.01.02.03.04.05.06.07.08.0Time, min9.010.011.012.013.014.015.0Figure 6. Selective detection of maleic acid and fumaric acid using LCDMS-MS/MS, the added selectivity resulted in lower background noiseand interferences and increased confidence in identificationFor Research Use Only. Not for use in diagnostic procedures. 2013 AB SCIEX. The trademarks mentioned herein are the property of AB Sciex Pte. Ltd. or their respective owners. AB SCIEX is being used under license.Publication number: 7830213-01353 Hatch Drive Foster City CAHeadquarters500 Old Connecticut Path, Framingham, MA 01701 USAPhone 508-383-7700www.absciex.comInternational SalesFor our office locations please call the divisionheadquarters or refer to our website atwww.absciex.com/offices
MS/MS. The AB SCIEX QTRAP 5500 systems provide excellent sensitivity and repeatability for this analysis, with minimal sample preparation allowing maximized throughput for the analysis of many samples in a short time period. Maleic acid was quantified in different food samples. MRM ratio calculations in MultiQuant software used for compound