Transcription
Scalable metadata environments (MDE): artistically-impelledimmersive environments for large-scale data explorationRuth G. West*a, Todd Margolisb, Andrew Prudhommeb, Jurgen P. Schulzeb, Iman MostafavidJP Lewisc , Joachim Gossmannb, Rajvikram Singhb,aUniversity of North Texas, 1155 Union Circle, Denton TX 76203; bUCSD 9500 Gilman Dr., LaJolla, CA 92093; cVictoria University Wellington, NZ; dLimbic Software, San Francisco, CA 94301ABSTRACTScalable Metadata Environments (MDEs) are an artistic approach for designing immersive environments for large scaledata exploration in which users interact with data by forming multiscale patterns that they alternatively disrupt andreform. Developed and prototyped as part of an art-science research collaboration, we define an MDE as a 4D virtualenvironment structured by quantitative and qualitative metadata describing multidimensional data collections. Entiredata sets (e.g.10s of millions of records) can be visualized and sonified at multiple scales and at different levels of detailso they can be explored interactively in real-time within MDEs. They are designed to reflect similarities and differencesin the underlying data or metadata such that patterns can be visually/aurally sorted in an exploratory fashion by anobserver who is not familiar with the details of the mapping from data to visual, auditory or dynamic attributes. Whilemany approaches for visual and auditory data mining exist, MDEs are distinct in that they utilize qualitative andquantitative data and metadata to construct multiple interrelated conceptual coordinate systems. These "regions" functionas conceptual lattices for scalable auditory and visual representations within virtual environments computationally drivenby multi-GPU CUDA-enabled fluid dyamics systems.Keywords: Keywords: immersive multiscale, multiresolution visualization, art-science collaboration, spatialized multichannel interactive audio, audio rendering, audio spatialization1. MAKING THE ABSTRACT EXPERIENTIALAs we race towards a “digital universe” of 40 trillion gigabytes by 2020 that encompasses the full scope of humanendeavor from science to the economy, humanities, telecommunication and the arts, we are challenged not only by itssize, but its ephemerality[1]. We must also come to terms with its incompleteness and our inability to effectively search,aggregate and cross-reference its myriad elements[2]. While data is often considered a resource, a raw material that canbe manipulated and refined along a continuum from information-to-knowledge-to-wisdom[3] fundamentally there is, andmay always be, a gap between the data, the underlying phenomena it represents, and the meaning ascribed to it. One candevise rules to assign meaning to the output of rule-based systems, yet the output itself must be interpreted in turn,leading to an infinite regress[4]. Generating, storing, accessing, representing and interpreting data also necessarilyinvolve subjective choices. This is not always acknowledged nor made explicit. Through choices such as what tosample, the sampling resolution, file formats, what gets discarded versus stored when the data is too large to retain all ofit, or the database schemas utilized in managing it, unspoken framing narratives arise that encode agreed uponassumptions about what the creators think they will find in the data, what they think they can know. Framing narrativesalso arise from our choice of representational schemas, statistics, and algorithms, displays, interaction technologies, andmetaphors. Recording complex phenomena from the personal to the global as digital data with technologies that oftentranscend the capacities of our senses (E.g. fitness wearables, terrestrial observatories, ultra-high resolution sub-cellularimaging, databases of consumer transactions, genomics etc.) creates digital repositories with information content richenough to produce an enormous number of observations. Yet, an individual or given domain expert can only generate alimited number of interpretations, mostly guided by their specific expertise and the respective framing narratives of datacreation and representation. These observations combined with the emergence of ArtScience as an approach for creatingnew ways of seeing and knowing through hybrid strategies[5] motivate our pursuit of aesthetic and artistically-impelledapproaches to support intuitive exploration of large data collections that transcend disciplinary boundaries and individualThe Engineering Reality of Virtual Reality 2014, edited by Margaret Dolinsky, Ian E. McDowall,Proc. of SPIE-IS&T Electronic Imaging, SPIE Vol. 9012, 901205 · 2014 SPIE-IS&TCCC code: 0277-786X/14/ 18 · doi: 10.1117/12.2038673SPIE-IS&T/ Vol. 9012 901205-1Downloaded From: http://proceedings.spiedigitallibrary.org/ on 04/16/2014 Terms of Use: http://spiedl.org/terms
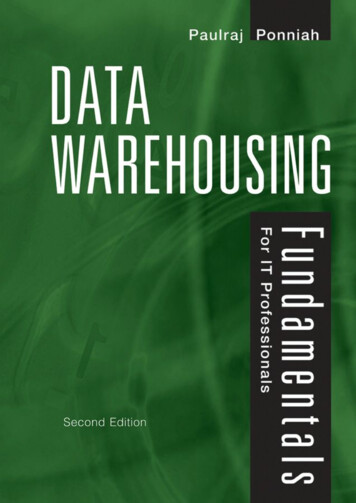
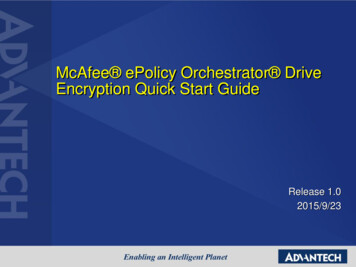
expertise. Many existing visualization techniques seek to preserve quantitative transparency in the data display[6]. Forexample, direct visualizations present a one-to-one mapping of data attributes to visual elements. This paper presents ourexploration of creative practice based methods for working with large and highly dimensional data that do not focus ondirect visualization/sonificaiton and one-to-one mappings because the number of potential mappings in abstract andhighly dimensional data is vast. In fact, it is more than combinatorial, since it is the number of possible mappingprograms, and as such systematically exploring this space using an engineering or optimization inspired approach islikely intractable. In the sections below we describe our prototype design for metadata environments, one approach forcreating aesthetic and experiential encounters with vast and abstract data spanning scales from nature to culture.2. METADATA ENVIRONMENTSWe define a scalable metadata environment (MDE) as a virtual space partitioned in to regions based on metadatarelevant to one or more data collections. Regions function as conceptual lattices for dynamic and scalable visual andauditory representations. They facilitate embodied exploration in a manner akin to scaffolded environments in whicheach sub-region establishes distributed patterns that contribute to a larger pattern-structure that humans cansimultaneously engage and co-create[7]. In parallel to the way that an architectural space has sub-spaces reflectinghuman intention and externalized memory or guided cognition, metadata environment regions collectively represent the“space” and “pattern” containing a data set existing at immaterial scales and make it available for embodied exploration.To provide the data framework for ATLAS in silico (http://www.atlasinsilico.net), an interactive artwork blending newmedia art, electronic music, virtual reality, data visualization and sonification, with metagenomics[8] we developed aprototype MDE for the Global Ocean Sampling (GOS) expedition dataset. Creating this artwork also includeddeveloping schemas for scalable visual[9] and auditory[10] data representation, along with novel hybrid strategies for10.1 multi-channel interactive audio spatialization and localization[11]. These elements were integrated with infraredhead and hand motion tracking for enabling user interaction within the immersive environment. The GOS (2003 - 2006)conducted by the J. Craig Venter Institute, studies the genetics of communities of marine microorganisms throughout theworlds oceans. It produced a vast metagenomics dataset with “far-reaching implications for biological energyproduction, bioremediation, and creating solutions for reduction/management of greenhouse gas levels in our biosphere[12].” The data contains millions of DNA sequences and their associated predicted amino acid (protein) sequences.These predicted sequences, called “ORFs” (Open Reading Frames), candidates for putative proteins, are subsequentlyvalidated by a variety of bioinformatics analyses. It also includes a series of metadata descriptors, such as temperature,salinity, depth of the ocean, and depth of the sample, latitude and longitude of the sample location that describe the entireGOS data collection. For ATLAS in silico we utilized the entire first release of the GOS which contained 17.4 millionORFs [ibid]. Analysis of the GOS is ongoing and the dataset, available online via the CAMERA portal, is comprised ofover 60 million sequences[13].JCVI PEP 1112698573936 /od id JCVI ORF 1112698573935 /read id JCVI READ 1106614468035 /begin 201 /end 837 /orientation 1 /5 prime stop TGA /5 prime loc 120 /3 prime stop TGA /ttable ll /length 2sample id JCVI SMPL GSO48b /sample name GS048b /number of sites lIdentifiers Metadatasite id 1 JCVI SITE GS048 /location 1 "Inside Cook's Bay, Moorea, French Polynesia" /region 1 "Indian Ocean" /sample depth1 "1.3 m" /chlorophyll density 1 "0.095 (0.091 /- 0.02) mg /M3 (Month /- SD)" /salinity 1 "35.1 ppt" /temperature 1 "28.9 C" /water depth 1 "34 m" /Ip notice "This genetic information downloaded from http: / /camera.calit2.net may beo be part of the genetic patrimony of France, the country from which theIP Notice /obtained. Users of this information agree to: (1) acknowledge France as theigin in any publications where the genetic information is presented and (2)contact the CBD focal point identified on the CBD website (http: //www.biodiv.org /doc/infocentre.shtml) if they intend to use the genetic information for commercial RHTHEEEILAIGERYTETVHGGVHOSequence DataFig. 1. Three major components of a GOS record: identifiers and metadata, IP notice resulting from MOU and sequence data.Each database record within the GOS spans scales from the imperceptible informational scales of genetic sequences topalpable environmental metrics including water temperature or salinity, to IP notices generated by country-specificSPIE-IS&T/ Vol. 9012 901205-2Downloaded From: http://proceedings.spiedigitallibrary.org/ on 04/16/2014 Terms of Use: http://spiedl.org/terms
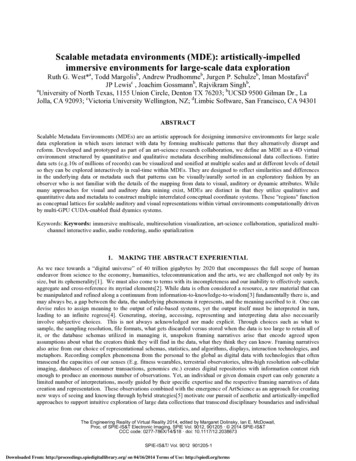
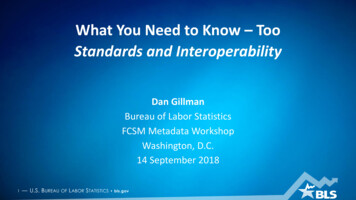
MOUs along the route of the circumnavigation. The later can be indexed to macro socio-economic variables at globalscales such as CO2 emissions, internet usage per capital or infant mortality rates. In this way each record of the GOSspans both nature and culture.The MDE constructed for the GOS enables exploration of the 17.4 M GOS ORFs (100% of the first GOS release[12]) ina single virtual environment in which the entire data set is visualized and sonified simultaneously at interactive framerates. Each region within the environment is constructed from one metadata category with its value range mapped to thedepth (z) axis, along with contextual and conceptual dimensions such as GPS location, mapped to the other (x, y) axes.The entire MDE environment is instantiated within a fluid force computed as described in[14] wherein each particle inthe fluid dynamics simulation corresponds to a single database record. The movement of particles within this systemreveals the specific values of all metadata descriptors for each record. The concept of the “metadata cell” or sub-regionof the virtual environment is integral to the design of MDEs (see figure 2). Each metadata cell represents specificattributes of the entire data collection, with each region representing all possible values of each metadata category. Thisconcept is central to the mechanisms underlying the dynamic sifting/sorting that enables emergent patterns to developrevealing structures within the entire data set influenced by the fluid forces within the virtual environment. Data(particles) are placed in an MDE within the fluid simulation at random starting positions. Since each sub-region isessentially a volume with an individual coordinate system, the overall environment can be seen as constructed by a largecoordinate lattice. As particles (data elements) enter and move about regions their movement and interactions areconstrained by the metadata properties for each region as well as by the metadata annotations that each data record(particle) carries. Over time as the data moves throughout the space an overall pattern emerges. The patterns result fromkinesthetic movement of clusters of data records moving together in space.74. oro }co, per C:aNta117.00 tonFig. 2. Metadata cells (regions) and visual, behavioral and auditory encodings for the GOS MDE.2.1Evolving the MDE frameworkOver the course of its development the MDE framework for the GOS has evolved from a single threaded CPUimplementation providing interaction with 20,000 records, to a single-GPU based CUDA implementation allowing forexploration of 1M records to a multi-GPU and CUDA based parallelized and partitioned framework enabling interactionwith 17.4M records comprising the entire first release of the GOS. Figure 3 shows an overview and detail inset of theMDE for the GOS.SPIE-IS&T/ Vol. 9012 901205-3Downloaded From: http://proceedings.spiedigitallibrary.org/ on 04/16/2014 Terms of Use: http://spiedl.org/terms
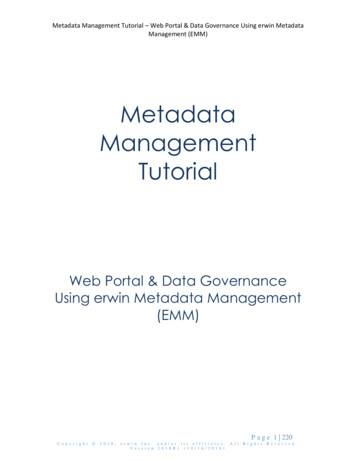
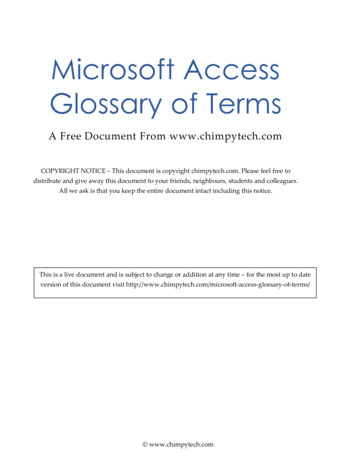
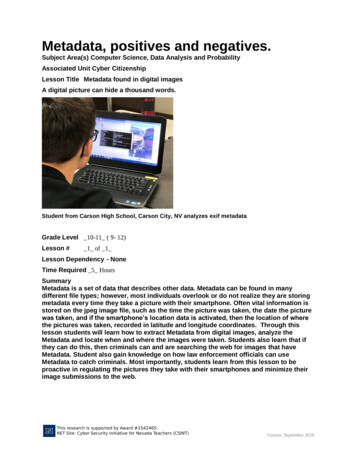
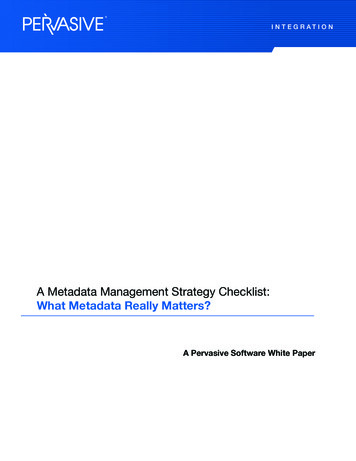
elf f MexicoUlf of Mainequatorlal Pacific TAC. BuayDirty Rock, Cocos Islandaievil, Crown, Floreana Island.elawara lady,NJpasta] Floreanahesapeake Bayi, MDi ape May, NJabo Marshals, Isabella IslandFig. 3. Metadata environment for the GOS: (Left) 17.4 million GOS ORF database records within a single MDE.Detail: (Inset/Right) GOS ORF records (particles) cluster in to streamline-like spatio-temporal patterns when recordsshare metadata characteristics. Records with differing sets of characteristics move in distinct trajectories creatingdistributed patterns. Cool to warm pseudocolor map indicates the number of sampling sites each ORF assembles across.Blue 1 site, deepest red 24 sites. (Right)The partitioned and parallelized structure of the framework supports filtering operations to create subsets of 1Mrecords directly from the entire 17.4M GOS record dataset. The filtered subset of records is immediately explored withinthe MDE while the system simultaneously continues the simulation for the entire dataset thus maintaining therelationship of the subset to the whole. Figure 4, below, summarizes the multiple approaches undertaken.Realtime 0000020000002345678ApproachFig. 4. Multiple approaches for realtime visualization with frame rates ranging from 12 to 39 FPS were achieved withmultiple combinations of GPUs and partitioning approaches.Approaches legend:(1) single-threaded, CPU-based simulation (non-VBO) (non-CUDA);(2) multi-threaded, CPU-based simulation (non-VBO) (non-CUDA);(3) multi-threaded, CUDA-enabled simulation (non-VBO) (1 card sim & 1 gfx card render);(4) multi-threaded, CUDA-enabled simulation (VBO) (1 card sim & 1 gfx card render);(5) multi-threaded, CUDA-enabled simulation (VBO) (1 card for both sim and render);(6) multi-threaded, CUDA-enabled simulation on 2 cards 2 GPUs (VBO) & render on another card (Synchronousupdate);(7) multi-threaded, CUDA-enabled simulation on 2 cards 3 GPUs (VBO) & render on another card (Synchronousupdate);(8) multi-threaded, CUDA-enabled simulation on 2 cards 3 GPUs (VBO & display list, progressive updating) & renderon another cardSPIE-IS&T/ Vol. 9012 901205-4Downloaded From: http://proceedings.spiedigitallibrary.org/ on 04/16/2014 Terms of Use: http://spiedl.org/terms
The multi-GPU based CUDA enabled implementation utilizes both parallelization and partitioning strategies to provideuser interaction (head and hand tracking) at interactive frame rates along with the underlying simulation of the entiredata set and real-time rendering.Figure 5 demonstrates the result of a filtering operation to select GOS ORFs that assemble in one or more sets ofsequences from sampling sites in addition to the collection corresponding to their physical sampling location.Fig. 5. Filtering: (Left) MDE showing results of filtering operation to select only records with two or more sets ofmetadata, and therefore sequences identified at two or more sample sites. Detail(Inset/Right) Cool to warm pseudocolormap indicates number of sampling sites. Compare inset to figure 1 inset. Blue 1 site, deepest red 24 sites.In-world user interface features enable drill down/through operations, subset filtering (creating subsets of 1M records),small sub-set selection of 20 records for comparative exploration, and single record selection for detailed exploration.These operations are accompanied by distortion-less detail-in-context viewing via the form of a “traceback” metadatasignature presented in the context of the entire data set.2.2Scalable Representations and User InteractionThe 4D nature of MDEs creates dynamic patterns from entire data collections. In-world user interface features allowusers to interact with and explore data by disrupting these patterns and observing them as they are dynamically reformed.An in-world menu panel (Figure 6 below) enables easy toggling of UI elements and control of simulation parameters.The design and user experience includes several interrelated representations and interactive modalities spanning multiplelevels of scale.SPIE-IS&T/ Vol. 9012 901205-5Downloaded From: http://proceedings.spiedigitallibrary.org/ on 04/16/2014 Terms of Use: http://spiedl.org/terms
15.93cationsrSalinityCO2 per CapitaFig. 6. GOS MDE with in-world control panel.MDEs are designed to reflect similarities and differences in the underlying data or metadata such that patterns can bevisually/aurally sorted in an exploratory fashion by an observer who is not familiar with the details of the mapping fromdata to visual, auditory or dynamic attributes. This requires an approach that generates as wide a range of distinctivepatterns as possible. We developed and utilize scalable auditory data signatures (SADS) for data sonicafication[10] andmeta-shape grammars[9] in which rule generation and interpretation is mapped to higher-order functions as describedin[15] for data visualization as n-dimensional glyphs, and we generate spatio-temporal signatures (which we term“tracebacks”) to visualize metadata characteristics at multiple scales. Each record, in addition to being represented by aparticle in the MDE fluid force is visually encoded according to metadata annotation sets and behaviorally encodedwithin the MDE according to both values within the record and metadata values in the context of fluid forces. MDEregions are not only spatially distinct but aurally differentiated so that user interaction with one region elicits distinctauditory features from interaction with other regions. This auditory distinctiveness is generated by differences in themetadata characteristics of each region as well as differences in the properties of the data nearby where a user isexploring the MDE by disrupting the emergent patterns.a::The user experience starts with an overview of the entire dataset in the MDE “particle” mode. To go to the next level ofscale, users can filter the data to view larger subsets ( 1M records) or select a small subset of records nearby a point inthe metadata space. The selection places the individual records in the foreground within the context of the entire dataset.This change is represented by changes in visual auditory and behavioral encodings. The entire dataset is placed in to the“background” as the particles (records) lose their color encoding and de-saturate to a grayscale value as the fluidsimulation “freezes.” Simultaneously the subset of records retain some aspects of the visual encoding and evolve in todistinct glyph structures that also incorporate distinct auditory (SADS) and behavioral encoding. Selecting one recordout of this subset transitions to the next level of scale in which an individual record is foregrounded against the entiredataset, while region markers and information from within the specific record emerge as visuals, audio and text. Therelationship of the individual record to the entire MDE is revealed by a spatio-temporal signature that incorporates all ofthe metadata values for the record within the context of each region and the MDE as a whole. Deselecting this recordreturns it in to the data set, transitioning the view back to the active fluid simulation state in which patterns can beexplored, disrupted, reformed, and filtering, selection and drill down/up operations performed.Figure 7 shows the activity of the rendering pipeline for the meta-shape grammar generating n-dimensional glyphs inworld and in real-time from user selected subsets of 20 records for visual and auditory data exploration. The right-mostpanel shows the result of selecting a single database record from the set of 20 for visual/auditory exploration. Theselected glyph (a shape grammar object visualizing the ORF sequence, biophysiochemical features and metadata) ispresented in the context of the spatiotemporal metadata signature (traceback) and both are in the context of target data.The data underlying both the glyph and spatio-temporal signature are sonified.SPIE-IS&T/ Vol. 9012 901205-6Downloaded From: http://proceedings.spiedigitallibrary.org/ on 04/16/2014 Terms of Use: http://spiedl.org/terms
Fig. 7. (Left) SGO (n-glyph) real time rendering and sonification in-world; (Center) 20 records group comparison including glyphs,interaction and sonification; (Right) single record selection, glyph, interaction, sonification, detail-in-context viewing withbackgrounded data set and metadata signature traceback.For the GOS data, in order to combine sequence and geospatial data spaces we established “waypoint” markers withinthe MDE. This enabled us to add a layer of geo-coded information for each metadata region. Waypoint markers (Figure8)cross-reference sampling site latitude and longitude with metadata values within each region. Selecting andhighlighting waypoints activates a coordinated view to display metadata values across regions and within a region, asshown in figure 8 below.Sample Lbw'Fig 8. (Left) Geo-referenced sampling site “waypoint” markers (green spheres) are displayed via in-world UI menu.(Center) Browsing the data by selecting a waypoint presents the corresponding metadata coordinated across all regions.Metadata values for sample location, sample depth, temperature and salinity are displayed for a selected waypoint.(Right) GOS ORFs moving in patterns through sample site waypoints.In addition to the regular grid structure (as in figures 2, 3, 5, 6 and 8), our design for the MDE includes functionality formetadata cells/region juxtaposition to be reconfigured, providing alternative views of spatial temporal patterns within theoverall data set in addition to the multiple perspectives available from navigating the initial configuration.Fig. 9. Users can reconfigure the position of regions to explore alternate juxtapositions of metadata. (Left) 1M recordsin a user-determined region order and position. (Right) Data explored in the context of chlorophyll values.SPIE-IS&T/ Vol. 9012 901205-7Downloaded From: http://proceedings.spiedigitallibrary.org/ on 04/16/2014 Terms of Use: http://spiedl.org/terms
2.3Use case: MDEs as New Views of BLASTBLAST, the Basic Local Alignment Search Tool[16,17], allows researchers to compare DNA or protein sequences ofunknown identity, function, and structure with “knowns” from validated databases, providing a measure of functional orevolutionary similarity or homology among sequences. It is one of the foundational bioinformatics techniques utilizedworld wide.Working with CAMERA researchers we developed a use case demonstrating the potential application MDEs inproviding novel views of BLAST results that incorporate metadata as a context to BLAST analyses. A BLAST querywas run with an individual sequence from the GOS. The small set of “top hit” results for the BLAST query is visualizedwithin the GOS MDE as shown in figures 10 and 11. The multiple types of visual, auditory and behavioral encodingallow users to explore the metadata characteristics of the BLAST results in relation to the target dataset’s metadatacharacteristics within a single MDE. In web-based BLAST user interfaces, users receive tabular lists of metadataattributes that correspond to the records returned by the algorithm. This metadata is analyzed separately and not in thecontext of either the query or the target dataset as is possible in an MDE.Fig 10. (Left) Standard web interface for BLAST results with metadata spreadsheet. (Right) Exploring BLAST resultsin an MDE with metadata and target data contexts.:::::::.In a standard analysis and user interface, the differences in metadata values for each of the top three “hits” (results) ofthe blast query would be difficult to see, and even more difficult to see in relation to each other and the overall metadatacharacteristics of the target database. . Figure 11 below demonstrates the potential for MDEs to augment BLASTanalysis by presenting query results in their metadata context.4"SPIE-IS&T/ Vol. 9012 901205-8Downloaded From: http://proceedings.spiedigitallibrary.org/ on 04/16/2014 Terms of Use: http://spiedl.org/terms
827k6130037058671.6.,135E-158 G tc / Gaa2.123E-134 G. t;: / Gat. I 1.522E-132 -- G-tè/ GatEaity.alytic domain)talytic domain)catalytic domain)Fig. 11. BLAST results in MDE context: Each of the three colored lines (tracebacks) is a spatio-temporal signatureencoding the set of metadata values associated with the top hits in a BLAST query result set. The top hit (red) and thesecond hit (green) each have a single set of metadata descriptors. Their values, while similar, are distinct anddemonstrate that the sequences were identified at different sample locations. The third hit (yellow) is a sequence thathas multiple sets of metadata descriptors (4 values for each category). It is a sequence that was sampled at a singlephysical location but algorithmically identified in collections of sequences from three additional sample sites. (Center)The purple colored pointer with associated “Salinity” value shows a user exploring the metadata space.3. MAKING AND BREAKING PATTERNSMetadata environments are an example of aesthetically impelled approaches for working with large and complex data inwhich user exploration makes and breaks patterns within a broader contextual scaffold. Our design of the MDE for theGOS metagenomics dataset piloted a method to integrate multiple data types to enable intuitive discovery-orientedbrowsing of large data collections by non-expert audiences. The prototype consists of a metadata driven virtualenvironment that is partitioned in to sub-regions, each representing specific metadata attributes used to describe theentire GOS data collection. This environment is instantiated within a computed fluid force. Each particle in the fluidcorresponds to a single database record and movement reveals the specific values of all metadata descriptors for eachrecord. Our future work envisions creating a generalized and scalable (extensible) MDE framework. We envisionenabling users to construct environments based upon not only metadata descriptors for data sets, but any combination ofvariables, to create environments of arbitrary size and dimensionality and to dynamically adjust regions interactively atrun time as a method for intuitive, open-ended exploration of very large data spaces. The design and implementation ofMDEs are an example of dataremix-ing[18] in which data is conceptualized as akin to a fluid, or flow, with multiplestate transitions rather than a raw material that is acted upon in discrete phases progressing along the data to knowledgepipeline. Our aesthetic and artistic approach to visualization and sonification of GOS data and contextual metadatapresented here is data-driven yet non-hypothesis nor problem driven. It is a hybrid multi-scale strategy that mergesquantitative and qualitative representation with the aim of supporting open-ended, discovery-oriented browsing andexploration of massive multidimensional data collections in ways that do not require a priori knowledge of therelationship between the underlying data and its mapping. Data is presented visually within the virtual environment asdynamic and abstract patterns in different positions relative to the overall virtual world coordinate system and the user(real-world) coordinates. Data is also presented not only as audio objects within the virtual environment, but usingSPIE-IS&T/ Vol. 9012 901205-9Downloaded From: http://proceedings.spiedigitallibrary.org/ on 04/16/2014 Terms of Use: http://spiedl.org/terms
spatialization strategies that position and move audio objects relative to the user according to both their interaction withthe patterns, and the relation between and within data objects themselves. In a broader context, this work engages theconcepts of “context’ and “pattern” as framing and facilitating data exploration in circumstances where one may notknow what one is looking for (e.g. detecting the unexpected, ideation, or hypothesis generation) and where the data canbe accessed by a broad user base spanning researchers, citizen scientists, educators and the general public.ACKNOWLEDGEMENTSThis work was supported in part by National Science Foundation IIS-0841031. Any opinions, findings, and conclusionsor recommendations expressed in this material are those of the author(s) and do not necessarily reflect the views of theNational Science Foundation. Additional support was provided by Calit2, CRCA, CAMERA, Ingenuity Festival,TimeLogic, CENS, NCMIR, EVL and SDSC. Installation hardware and software is provided by Da-Lite ScreenCompany, VRCO/Mechdyne, Meyer Sound, and 2][13][14][15][16][17][18]Gantz J.F., Reinsel D. (2012) The Digital Universe in 2020:Big Data, Bigger Digital Shadows, and BiggestGrowth in the Far East– United States, IDC. Online: http://www.emc.com/leadership/digitaluniver
Scalable metadata environments (MDE): artistically -impelled immersive environments for large -scale data exploration Ruth G. West* a, Todd Margolis b, Andrew Prudhomme b, Jurgen P. Schulze b, Iman Mostafavi d JP Lewis c, Joachim Gossmann b, Rajvikram Singh b, aUniversity of North Texas, 1155 Union Circle , Denton TX 76203 ; bUCSD 9500 Gilman Dr ., La .
![[MS-MDM]: Mobile Device Management Protocol - Microsoft](/img/16/ms-mdm-130808.jpg)

![Practical Fine-Grained Binary Code Randomization[2]](/img/19/acsac20.jpg)