Transcription
PNCWA WebinarComputerized MaintenanceManagement Systems (CMMS)Benefits to Smaller AgenciesJanuary, 2015
Presentation Outline Introduction – Jeremy Coles What is a CMMS – Brown and Caldwell (BC) How can a CMMS help my utility – (BC) Manage information about your assetsManage work information and historyTrack customer complaintsHow can a CMMS help my utility – (BC) Case Study – Santa Barbara Case Study – Tony Bisson, Clark Regional WWD (WA) What does a utility need to get started? – BC Q&A – Jeremy Coles
Our assets – their ownershipand care
Agency assets – what we all would like toknow .BasicWhat do we own and where is it?What condition is it in?What are the likelihood and consequence of failure?AdvancedHow should we maintain it?Focus on critical assetsAnalyze how data is collectedWork Orders (WO’s) go to prioritized assetsBetter updates for financial forecasting (and rates)Brown and Caldwell4
Why is AM important?.without it theowner could be:Putting level ofservice (LOS) at risk(e.g. boil notice)Not saving enough for maintenanceNot have enough forreplacementsBrown and CaldwellOperatinginefficientlyOver/undercharging ratepayers5
Data – best to store and manage assetinformation somewhere other than our heads .Brown and Caldwell6
Goals (Purpose) for AM ProgramFrom “Effective Utility Management, a Primer forWater and Wastewater Utilities” Operational optimization – timely,cost-effective, reliable operations(efficient work, right time) Infrastructure stability – Highservice level, low cost, reliable/lowrisk water delivery Measurement and continuousimprovementBrown and Caldwell7
What is a CMMS system?A software package designed to managehigh volumes of asset information Data Driven Houses the asset register Detailed information aboutan agencies assets (size, HP,condition etc.) Schedule and history of thework performed on thoseassetsBrown and Caldwell8
Goals are to better manage our utilities – wheredoes the CMMS fit in?Five fundamental areas to a well runutility:1. Agency policies andprocedures2. Equipment data3. Work order control4. Preventativemaintenance practices5. Materials controlBrown and Caldwell9
CMMS systems - manage the detail of bothassets and the work performedThe “What and When” Detailed asset inventory Maintenance history Maintenance and budgetplanning tool Generates reports Dynamic/transactionalDynamic What you own, what you’ve done,what you have to doBrown and Caldwell10
How can a CMMS help myutility?
Even the smallest agencies can have thousandsof assets worth hundreds of millions of Brown and Caldwell12
Each individual asset has it’s own set ofdetailed informationAsset IDAsset NameTypeDescription/FunctionDesign TypeDesign VoltagePhaseRated AMPsHPWatt/KWRPMService FactorEfficiencyPower FactorThermal ProtectionY/NAmbient Temperature (Max.)Design CodeNEMA Insulation ClassFrame numberDrive End Bearing #Non Drive End Bearing #Serial numberModel numberSizeFrame numberMonth/Year ManufacturedFailure AnalysisIncluded in Criticality Model?Y/NDrive End BearingBearing manufacturerDrive End BearingBearing numberOpposite Drive End BearingBearing manufacturerOpposite Drive End BearingBearing numberOwnerInstallation CostPurchase CostPurchase dateExpected life (years)Mean Time Between Failure - HoursAverage Monthly Use - HoursTotal Usage - HoursBrown and CaldwellWARRANTY INFORMATIONShipping dateWARRANTY INFORMATIONStartup dateWARRANTY INFORMATIONEffective dateWARRANTY INFORMATIONDuration (months) 100%WARRANTY INFORMATIONExpiration dateWARRANTY INFORMATIONDuration for reduced coverageWARRANTY INFORMATIONDuration for reduced coverage #2WARRANTY INFORMATION(Warranty PDF)WARRANTY INFORMATIONCommentsLOCATION INFORMATIONAddressLOCATION INFORMATIONCity, ST, ZipLOCATION INFORMATIONLocationLOCATION INFORMATIONArea #LOCATION INFORMATIONSub - AreaLOCATION INFORMATIONRoomLOCATION INFORMATIONLevelLOCATION INFORMATIONDirectionLOCATION INFORMATIONGPS - LatitudeLOCATION INFORMATIONGPS - ERCity, ST, ZipMANUFACTURERPhone #MANUFACTURERFax #MANUFACTURERemailMANUFACTURERWeb siteVENDORVENDORAddressVENDORCity, ST, ZipVENDORPhone #VENDORFax #VENDORemailVENDORWeb siteNotes13
All of that asset information can live in manydifferent places .(or not be captured at all)FinancialData(Oracle)Institutionalmemory (riskydata sources)Vertical AssetInventory(Maximo)Linear AssetInventory(GIS)Senior staffknowledgeRandomspreadsheetsOld paper sourcesBrown and CaldwellIdeal locationfor detailedasset data andwork historyCondition 4
CMMS systems provide a clean & standardizedplatform for information managementBrown and Caldwell15
CMMS can track the full life of each assetand report on it (and across all assets)Houses assetdataReplacementScheduling &executing WO’sR&R PlanningTransactionhistoryComparativereporting
If my CMMS was fully populated with asset andwork information benefits can include systematicallyprioritize work andrecord work historystreamline and focuswork managementCan report acrossgroups of assetsBrown and CaldwellEasier to findinformation gapsGood data toother systems(e.g. financial orHR/staffing17
Maintenance workScheduling, completing, trackingand reportingBrown and Caldwell18
Prioritizing, managing and reporting on work canbe tough to track
CMMS systems help organize workmanagement (and show trends) Preventative Maintenance (PM’s)Corrective Maintenance (CM’s)Predictive Maintenance (PDM’s)Emergencies (out of service/shutdowns etc.) Want to comply with warrantiesand perform the RIGHT amount ofmaintenance over the asset lifecycleBrown and Caldwell20
CMMS - Planning, tracking andexecuting PM’s (warranty and beyond)Brown and Caldwell21
Collect and reviewexisting dataIdentify criticalassets andmaintenancestrategiesRecommend assetclasses to collectcondition dataReview existingmaintenancebusiness processand recommendchanges*Perform fieldworkDatabaseautomatically pullsCA info from MaximoRecs made for O&Mand CIPO&M work focuseson improving data oncritical assetsRecord data inMaximoReview Maximo WorkOrder processes andrecommendchanges*Capital ImprovementProgramsMaximo Upgrade ProgramOperations andMaintenanceR&R ProgramCMMS systems provide a vehicle for workstructure including schedules, prompts etc.* This is an ongoing process that will take several iterations before the process changes are madeMaximo pulls recs,creates Work Ordersbased on prioritizedRecsBundled rehabprojectsContractor performswork, submits data
Key Performance Indicators (KPI’s) – prove you areefficient .or that you need more resourcesMeasurementGoals**Goals**Work Order BacklogPlanned 6 weeks (SMRP 5.4.8)Ready to schedule 2-3 weeks(SMRP 5.4.9)Overtime 5% (SMRP 5.5.8)Preventive Maintenance Compliance 90% (SMRP 5.4.14)Schedule Compliance 90% (SMRP 5.4.4)Report as to why the schedule was broken (equipment notready, emergency breakdown, staffing etc.)Planned Maintenance Ratio85% (AWWA benchmark)Reactive Work 10% (SMRP 5.4.1)Mean Time Between Failure(start on critical assets)Higher the better. Don’t want failures between PM’sBudgeted vs Actual95%-100% of BudgetBrown and Caldwell**THE SOCIETY FOR MAINTENANCE AND RELIABILITY PROFESSIONALS23
CMMS reports can show performance againstindustry benchmarks .and trendsBrown and Caldwell24
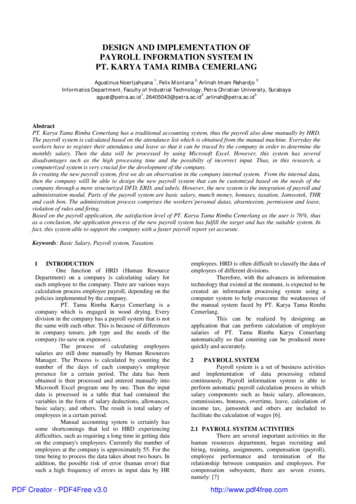
Organized CMMS information (pipe age, condition,material etc.) supports Replacement and Rehabilitation(R&R) modelingMean Year of FailureProbability of Failure20%15%10%Asset with meanuseful life of50 years, standarddeviation of 10 years5%50 year old asset’s mean year offailure is in its 57th yearNew asset’s mean year of failure isin its 50th yearAsset Age: 0 yearsAsset Age: 50 yearsAsset Age: 70 years70 year old asset’s mean year offailure is in 73rd year25%0%0Brown and Caldwell1020304050Years6070809010025
More realistic R&R planning supports financialforecasts Brown and Caldwell26
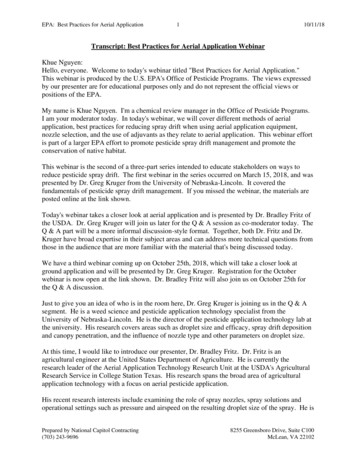
Which leads to more accurate and defensiblerate adjustments and CIP funding 35,000Refurbishments 30,000Replacements 25,000 20,000 15,000 2020192018201720162015 02014 5,000
Opportunity to capitalize on (and quantify) savingsCost of Service Per Customer5%0%Australia average:Savings 19%-5%-10%-15%-20%-25%Hunter WaterSavings 39%-30%Brown and 91-35%28
Case Study –Allan Scott –Santa Barbara
Benefits to Small Agencies Provides visibility and transparency Management understands what is happening in the field Field crews understand what is important for effective utilitymanagement Collect reliable data to measure performance Workload backlogProductivityEffectiveness of preventative maintenanceImproves focus on critical assetsTrue O&M costs Standardize O&M practices Extend useful life and reduce O&M-related equipment failuresFacilitates continual improvementCaptures system O&M knowledgeStreamline work practices
Santa Barbara Case Study Implemented Cartegraph CMMS forSewer Collection System Group and forWater Distribution About 95,000 customers 260 miles of gravity sewers 298 miles of water distribution pipeBrown and Caldwell
Key Challenges Waste water SSO consent decree requiring increasedperformance for sewer pipe cleaning and inspection Aging water infrastructure and O&M resourcelimitations raised concerns over effectiveness of O&Mprogram and identification of future needs.
Standard Workflows Supported by TechnologyHelped Santa Barbara Achieve its ion esourcesBrown and CaldwellSupported byCarteGraphand othertechnologysystemsInspection& dSSMPFOGRCM(FM/PS)33
Streamlining Work Practices By Aligning Technologyand Data With Efficient Work ecordresultsDailySheetsMapsManualupdatesGISBrown and ailySheetUpdatescheduleScheduleproblem areasNew workrequestsCartegraph34
Streamlining Work Practices By Aligning Technologyand Data With Efficient Work ProcessesAssign basinIdentify PrioritiesPlan routeClean pipesRecord resultsSupervisorreviewInteractiveMapsNew GISBrown and Caldwell35
Preventative Maintenance Metrics PMs Planned: The number of schedule PMs for the time period defines the overallmaintenance plan. PMs Completed: How many of the planned PMs were actually completed? %PMs Completed: How well was the plan followed? Hours Estimated: Number of planned hours for preventative maintenance Actual Hours: Number of hours spent on preventative maintenance Hour Actual vs. Estimated: How close is the plan to the actual execution? PMs total hours: Same as Actual Hours. CMs Total Hours: Number of hours spent on corrective maintenance. % CMs vs. PMs: Helps identify high areas of unplanned maintenance. CM/PM vs PMs Completed: Compares areas of high unplanned maintenance withhow effective the planned preventative maintenance program is being executed.
Performance Analysis of Preventative andCorrective Maintenance Where are my highest failure rates and why?Where are my most expensive maintenance costs?Which assets are the most expensive to maintain?What changes can I make to reduce failure rates?What do I need to do to reduce costs of my problemassets?
Accomplishments for Collections Improved business processes (pipe cleaning, CCTVinspection, FOG Management, SSO Response, R&Rplanning) Improved use of GIS and CMMS “Dynamic” cleaning schedulesRisk-based CCTV inspectionsStreamlined SSO documentationImplemented Sewer Lateral Inspection ProgramImplementing R&R ProgramBrown and Caldwell
Collections Results New processes and systems in use for 2 years Decreased annual SSOs over 40% (on average) Successfully meeting Consent Decree requirements On track to clean entire system over 5 years On track to inspect entire system over 10 years Developed new Sewer CIP process that is managed byEngineering instead of Collection Systems Formalized FOG Restaurant Inspection program Developed Sewer Lateral Inspection Program Updated and audited Sewer System Management PlanBrown and Caldwell
Accomplishments for Water Distribution Early stages of implementation Developing visibility of what it really takes to maintainsystem Standardized work processes improves performanceand versatility Starting to see and react to patterns, inefficiencies andcosts Improved communication and visibility between workgroups and management
Case Study – Tony Bisson,Clark Regional WW District
Today’s Topics Vision Program Development Buy In Existing Data Staff usage Engineering and Maintenance workingtogether! Condition Assessment Asset Risk Project Scoring Next Steps42
Vision43
Vision 10 Attributes of Effectively Managed Utilities44
Vision Financial Viability Understand full life-cycle cost of utility Establish & maintain effective balance between: Long-term debtAsset valuesOperations / maintenance expendituresOperating revenues Establish predictable rates (consistent with communityexpectations / acceptability) adequate to recover costs Provide for reserves Maintain support from bond rating agencies Plan / invest for future needs45
Vision Infrastructure Stability Understand condition of & costs associated with criticalinfrastructure assets Maintain / enhance condition of all assets Over long-term at lowest possible life-cycle cost Acceptable risk consistent with customer, community ®ulator-supported service levels Consistent with anticipated growth & system reliability goals Assure asset repair, rehabilitation & replacements arecoordinated to minimize disruptions & other negativeconsequences46
Vision Customer Focused Meet customer expectations - public values survey Environmental Stewardship / Protecting Water Resources Proactive management of the system minimizes backups, I&I and unexpectedpipe failures Financial Responsibility Stable ratesStaffing and workload planningMinimize the high cost of emergency repairs and overflowsPrioritizing limited resources - Fix the Worst First! Responsible Management Practicality of managing 9,500 main line pipes segments Supporting Economic Development Reliable sewer system Targeted investments47
Program Development48
Program Development Develop a ground level record systemcapable ofWork order and asset managementAND––––––Critical Sewers AnalysisCondition AssessmentAsset RiskProject Prioritization ProcessProgram Level Project ScopingDocumentation49
Program Development Program OutlineIdentify Existing Data GIS and CCTV Investments Historical data and “tribal Knowledge”Critical Sewer Analysis Consequence of Failure (GIS Analysis)Asset Condition Probability of Failure (CCTV Data)50
Program Development Program OutlineAsset Risk Combining Condition and Criticality (GIS Analysis)Develop Prioritization ConceptDefine R&R ProjectsPrioritize R&R ProjectsProject Priority Array51
Existing Data52
Gaining Staff Buy In53
Non Tech Savvy?54
Giving Ownership55
Existing Data Identify Existing Data Assets GIS Hand written WO Asset Condition CCTV Data 475 miles of CCTV in MaintenanceManagement System (Granite & Lucity) Data collected since 2005, 95% of mainlines All lines televised at some point Tribal Knowledge of known defects56
Existing DataSewer LinesTelevised57
An example of non Work Orderusage:Critical Sewer Analysis58
Critical Sewer Analysis Defining Criticality 1 to 3 scoring scale basedon potential impact ofasset failures or“consequence of failure”59
Critical Sewer Analysis Score of 3 includes pipes: in major roads (parkways, arterials) in environmentally sensitive areas Includes all difficult to access canyon lines Greater than 18" diameter More than 14’ deep Score of 2 includes pipes: In urban collectors Inaccessible lines 10” to 18 ” diameter Score of 1 includes all other pipes60
Critical Sewer Analysis GIS Working for Us61
Critical Sewer AnalysisGIS WorkingFor Us62
Critical Sewer Analysis63
Condition Assessment64
Condition Assessment CCTV Data Infiltration / InflowStructural – Cracks / ShearsSagsRootsFats, Oils, Grease (FOG)65
Condition Assessment CCTV Data Collected from Cues CCTVtrucks.66
Condition Assessment CCTV Data Scoring “Weight”67
Condition Assessment CCTV Data68
Condition Assessment69
Condition Assessment CCTV Data Simplified Based on Score Failing: Imminent failure Poor: Monitor, proactive repairs Good: No concerns70
Asset AssessmentAssetCondition71
Asset Risk72
Asset Risk Integrating Criticality & Condition Criticality – Consequence of Failure Score 1, 2, or 3 Condition – Risk of Failure Score Red, Yellow, Green Extra point, or fraction of a point added for hot spots.Asset Risk Criticality Condition73
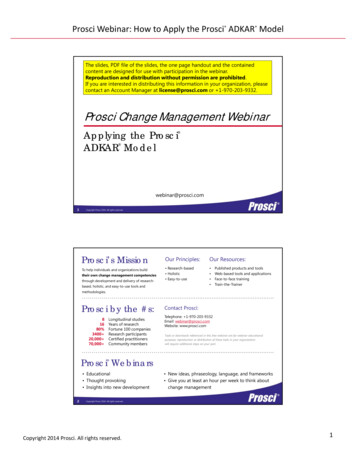
Asset Risk7,584 ft1,651 ft10,329 ft4,494 ft4,820 ft6,357 ft74
Asset RiskSewer LinesIdentified75
Asset RiskProject ZonesIdentified76
Project Scoring77
Project ScoringProject ScoresAsset Risk Criticality Condition78
Next Steps79
Lucity Rehab module Expand on our use of the rehab module.80
Next Steps Project Priority ArrayCapital Project componentPump StationsForce MainsRework codes/weights to work withPACP81
Lessons Learned You have more data collected than you realize even beforeimplementation Staff support and Management buy in is crucial to any systemssuccess CMMS systems, once populated, save time, money. Adds quantifiable data to back rehab needs and cost allocation. Provides an easily searchable data base to provide history onwork/assets, customer issues and inquires, and any other datayou may want to “gather”82
CMMS systems - What doesa utility need to get started?
AM programs – agency specific, one size doesnot fit all – CMMS systems are just onecomponentSmall Consequence ofFailure (COF) andProbability ofFailure (POF) Focus on acritical assetclass to collectadditional data Update CMMS Update financialBrown and CaldwellLargeMedium COF and POF Asset ManagementProgram Evaluation(AMPE) Business ProcessAnalysis (BPA) Collect additionaldata Update CMMS Update financial COF and POF ancial84
Getting started – CMMS implementations arejourneys .not destinations Identify & Evaluate Existing data sources and inventoriesExisting work practicesLook for gaps (e.g. collections, vertical, work history etc.)How are you currently reporting (communicating withdecision makers)? 1st round goals for system Consolidated asset database Basic work management Basic reportingStarting slowly and simply is the key to success!
Choose a CMMS system that meets your agenciesneeds/goals now .but is expandable Evaluationconsiderations Flexiblereporting Modular (canaddassets/users) Ease of use Vendor support Mobileapplications Cost
Learn from others .and find a champion Benchmark What systems are neighboring/similar agencies using? How is it working for them? Information sharing/user group potential Identify an internal “champion(s)” Day jobs will continuously get in the way One or more individuals needs to be focused on the effortand own it Other departments (e.g. IT) will need to be on board Business processes needed to support the tools
CMMS systems – BenefitsRecap
Benefits to Small Agencies Collect reliable data to measure performance Workload backlogProductivityEffectiveness of preventative maintenanceImproves focus on critical assetsTrue O&M costs Standardize O&M practices Extend useful life and reduce O&M-related equipment failuresFacilitates continual improvementCaptures system O&M knowledgeStreamline work practices
Benefits to Small Agencies (cont.) Quantify needs to decisionmakers demonstrate the need for moreresources prove warranty compliance orregulatory compliance Support rate adjustments todecision makers Provides visibility andtransparency Management understands what ishappening in the field Field crews understand what isimportant for effective utilitymanagement
Questions
What is a CMMS - Brown and Caldwell (BC) How can a CMMS help my utility - (BC) Manage information about your assets Manage work information and history Track customer complaints How can a CMMS help my utility - (BC) Case Study - Santa Barbara Case Study - Tony Bisson, Clark Regional WWD (WA)