Transcription
Solutions Assessment:Food and Water SystemsReport of Working Group 3January 2021Working Group Membership (Summer and Fall 2020)3-1
Xenia Morin, Co-Chair, School of Environmental and Biological Sciences (SEBS)Joe Charette, Co-Chair, Rutgers Dining ServicesAJ Both, SEBS/NJAESShauna Downs, School of Public HealthLauren Errickson, staff and graduate student, SEBS/NJAESSerpil Guran, NJAESLisa Tenore, Rutgers DiningElizabeth Demaray, CamdenAnna Agbotse, Student, NewarkMatan Dubnikov, Student, New BrunswickAmanda Ketterer, Student, CamdenAdditional Research Assistance from Rutgers staff, faculty and students:Wes Coleman, Procurement and WG4Dennis Demarino, ProcurementPam McElwee, SEBSMark McLane, REHSRachael Shwom, SIMAP calculationsSummer Research Interns (supervised by Rachael Shwom and Xenia Morin): Water Group: Mia Weinberg, Amulya Nagella, Nilam Kalawadia, Antionette Pauwels Food Waste Group: Gagana Yaskhi, Keiana Castellanos, Annabelle Simhon, Jennifer Schug, Lisa GiangrandeLamia Abdallah, student research assistantKajal Talele, graduate student research assistantDavid Tulloch, SEBSPeggy Policastro, Rutgers DiningOutside ConsultantsBrian Conway, Gourmet Dining Services, LLC.Richard Waite, World Resources Institute (WRI)3-2
Table of ContentsEXECUTIVE SUMMARY . 43.1. Rutgers’ current baseline . 73.1.1. Rutgers’ greenhouse gas emissions in Food and Water Sector . 73.1.2. Rutgers’ climate vulnerabilities in Food and Water Systems .143.1.3. Ongoing activities to reduce emissions and vulnerabilities .143.1.4. Related ongoing educational, research, and service activities .163.2. Overview of potential climate solutions . 203.2.1. Potential solutions .203.2.2. Cross-Cutting Solutions.223.2.2. Stakeholder Input .233.2.3. Early opportunities for action .233.2.4. Cross-cutting issues arising in the exploration of potential solutions .243.3. Assessments of potential climate solutions . 253.3.1. Menu enhancements and recipe changes.253.3.2 Climate-friendly food labeling .263.3.3. Refrigeration management .27APPENDIX A – Background Information . 29A.1. Background on Indirect Emissions from Food.31A.2. Refrigeration and the Cold Supply Chain .32A.3. Food Waste Reduction .33APPENDIX B – Water Systems. 35APENDIX C – Vending Machines and Hydration Stations Maps . 443-3
EXECUTIVE SUMMARYClimate solutions associated with food will need to come from a number of different areas within the foodsystem. Globally, approximately 26% of greenhouse gas emissions (GHGs) are associated with foodproduction with 8% of global total coming from food waste. GHG emissions associated with food comemany resources: food production methods that consume energy, water, soil and land area; packaging; fooddecomposition (especially in landfills), to the chemical used in refrigeration. It will take a lot of differentpeople working together toward a more sustainable and climate-friendly food system to bring about climatesolutions for the food system. Food justice, food security, and food equity1 are also factors that must beconsidered when implementing change.Reducing food GHG emissions is a major focus for campus food service companies as well as for the foodservice industry in general2,3,4. While Rutgers Dining Services, which serves over 6 million meals per year,has been working on sustainability issues for a long time, focusing on GHG emissions is relatively new.WG3 estimates that Rutgers Dining Services contributes only a small part of Rutgers’ overall GHGemissions (about 20,000 tonnes in FY19, about 7% of overall emissions quantified). WG3 has discoveredthrough data collected from Rutgers Dining Services and calculated using SIMAP that the greatestcontributors to food-related GHG emissions are the consumption of beef (37%) and chicken (28%) in thedining halls. Some of our GHG emissions are still unknown, especially with respect to beverages, vendingmachines as well as dining at Newark and Camden which is managed by Gourmet Dining, LLC. We havenot estimated off-campus GHG produced by our students.Food waste also contributes to our GHG emissions. Some preliminary calculations have been made andshow that more can be done to reduce food waste and to capture the food waste we generate. We have notattempted to estimate food waste created by other campus food service groups nor estimated thecontributions of off-campus households to food waste related GHG emissions. Future food waste reductioninitiatives support by Rutgers will also support the USDA, EPA5 and State of New Jersey’s new food wastereduction plan6 to achieve a 50% reduction in food waste by 2030. This reduction will help to curtailmethane production in landfills and reduce waste throughout the system.There is much more that can be done to further reduce Rutgers food systems’ impact on climate change.WG3 has identified solutions to reduce campus-based GHG emissions, and in some cases off-campusGHG emissions, and recommend that these be considered as part of the climate action plan. Thesesolutions/interventions including:1. Shift to a more “Plant Forward” (Plant Rich) Dieta. Evaluate and change recipes and menus to achieve target of 25% reduction in GHGs by2030 from 2019 baseline (see Fig. 3.3).b. Lead with tastec. Leverage Menus of Change University Research Collaborative (MCURC)For more about food justice, food security, and food equity, see: https://foodprint.org/issues/food-justice/ and thisvideo “Food for Thought: The Path to Food Security in Newark” (https://youtu.be/hZLgLFOAcrs ). Also note thatmany of our students work in the food system, both on- and off-campus, so these issues impact them directly.Menus of Change University Research Collaborative (MCURC), https://www.moccollaborative.org/Environmental Game Changers, Compass Group: rpillars/environmental-reporting.htmlWorld Resources Institute “The Cool Food Pledge” dgeUnited States Food Loss and Waste 2030 Champions: itedstates-food-loss-and-waste-2030-championsState of New Jersey, Department of Environmental Protection, Food Waste Plan. https://www.nj.gov/dep/dshw/foodwaste/ and https://www.nj.gov/dep/dshw/food-waste/food waste reduction plan.html1234563-4
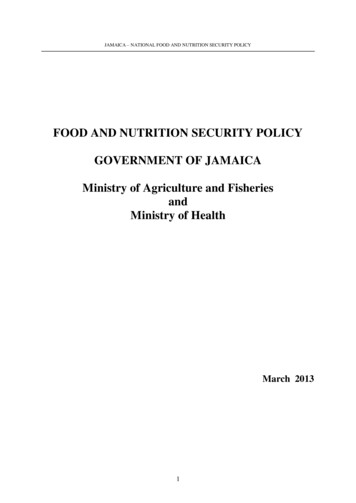
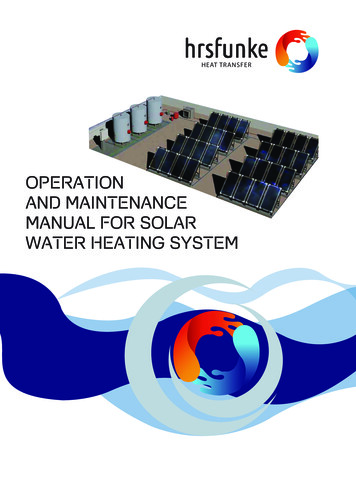
d. Co-benefits: health, environmental health, landscapes2. Climate-friendly food labeling3. Adopt a climate-friendly food labeling system for online menus4. Consumer Education and Awareness Campaignsa. On campus: for students on meal plansb. Off-campus: for students, faculty, staff and alumni5. Reduce Food Wastea. Targets to be established to reduce food wasteb. Explore with the local communities the need for anaerobic digestor and/or commercialcomposting6. Reduce single use plastic (post-COVID)a. Replace single use plastic bags with reusable bags7. Reduction of consumable goods especially those associated with foodtakeout/convenience or catering8. Increase use of re-useable water bottles and hydration stationsa. Tap water has 1/300th to 1/1000th carbon footprint compared to a single use plastic bottle ofwater9. Continue supporting locally sourced fresh products when in season10. Enhance outreach and explore incentives for better farming systems, food production systems,delivery methods, and sustainable products.11. Highlight climate friendly refrigeration management12. Upgrade snack and beverage vending machines to Energy Star Ratings.Figure. 3.1. Rutgers Dining Services GHG emissions reductions targetsSome of these solutions could be implemented in 2021-2023. WG3 estimates that investments and changesto our food system, diets, and food waste habits will be able to reduce GHG emissions from food by at least20% over the next 10 years, with further gains possible depending on the types of changes implemented.This number includes a 2019 commitment as part of Menus of Change University Research Collaboration(MCURC) to a 25% reduction in protein associated GHG emissions by 2030 (Fig. 3.1). In implementing3-5
any recommendations, food justice, food security, and food equity issues should be considered throughoutthe supply chain.WG3 also considered some other solutions such as purchasing of imperfect delicious produce, but RutgersDining has already tried this and found it to be difficult to implement since it needs to define thespecifications for bidding for our food purchases. Revisiting this solution is still an option.Additional recommendations are made in conjunction with WG4 for food waste initiatives. Additionally,this section does not consider GHG sequestration by the land used to produce the food consumed.What follows are more details of Working Group 3’s (WG3) efforts to catalog GHG emissions associatedwith Rutgers Food System Scope 3 emissions and other sustainability efforts as well as possible solutionsaimed at creating targets for GHG emissions reductions from food and water systems. Some of thisinformation is also available in the Appendix.3-6
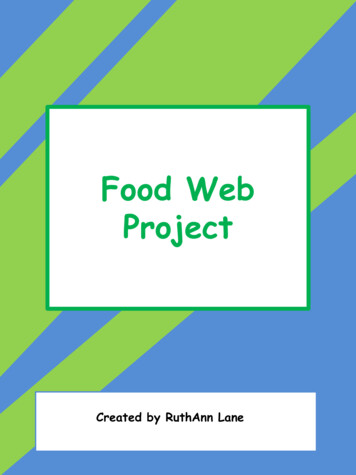
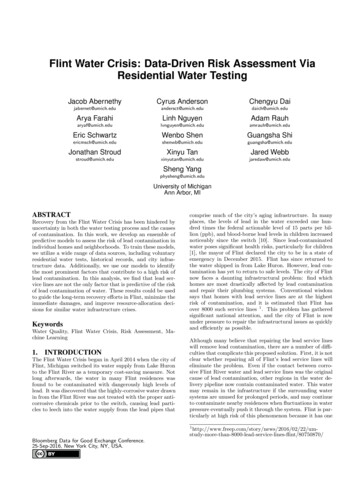
3.1. Rutgers’ current baseline3.1.1. Rutgers’ greenhouse gas emissions in Food and Water SectorEstimates for Rutgers the baseline for Scope 3 greenhouse gas emissions for the Food and Water Sectorhave been challenging to collect across all campuses. Below is a summary of information that has beengathered so far and includes estimates from Rutgers Dining (New Brunswick). WG3 did not collected fooddata from the other food service on the New Brunswick campus which includes Currito’s, Gerlanda’s, KingPita, Panera, Subway, Wendy’s, Moe’s, Szechwan Ichiban, Hoja, Qdoba,16 Handles, Gourmet Dining,Hillel or Chabad House.Further work and information are needed to complete the baseline using data from our vendor, GourmetDining, LLC, in Newark and Camden.Based on SIMAP analysis, Rutgers Dining’s FY19 food-related emissions totaled 20,462 tonnes CO 2e,roughly 3.3 kg CO2e per meal served. The breakdown of these emissions is shown in Figure 3.2. The largestshare is due to beef (37%) and chicken (28%), though these two food sources constitutes only 4% and 15%of the overall weight of food purchased, respectively. Plant-based foods (vegetables, grains, fruits, etc.)constitute only 15% of overall emissions, though they constitute 62% of the weight of food consumed.Figure. 3.2. Emissions (left) and total weight (right) associated with food purchased by Rutgers Dining Services inFY2019, based on SIMAP analysis3.1.1.1 Rutgers Food Systems and SustainabilityAn overview of Rutgers Food Systems, from dining to food sourcing and production, was outlined in ourJuly Interim report in Section 11.3 and readers are asked to refer to this report for background7. rt-FINAL.pdf3-7
summary, 6,267,201 million meals were sources, prepared and served by 1742 staff and 802 students ofRutgers Dining in FY19, our baseline year. These numbers are significantly lower during FY20 and thisyear due to the pandemic.Rutgers Dining Services is a leader around the country when it comes to campus dining sustainabilityefforts. Examples of sustainability efforts that help to reduce GHGs are already in place or underway andsome of these efforts are summarized in Table 3.1 and Fig 3.2. This list shows significant and sustainedeffort by Rutgers Dining Services to reduce the environmental impact of food service on campus and whichhave already reduced the GHG baseline for Rutgers Dining Services. Local foods make up 81% of thefood purchased. Also notable are the co-benefits of sourcing food locally: preserving farmland and greenspaces in New Jersey, Pennsylvania, and New York, supporting the local economy, and building localcommunities. This list of practices means that Rutgers Dining Services baseline for GHG emissions(FY2019) is relatively low compared to other schools who have not implemented these practices.Table 3.1. Examples of Food-related emissions reduction activities at Rutgers Dining Services in New Brunswick(NB) (Source: http://food.rutgers.edu/sustainability/ and presentation “2020 Rutgers Dining Services SustainabilityPractices, Sustainable Food Service” a Rutgers Dining presentation on this website.) New menu choices, e.g. blended burgerSustainable Food Sourcing and Purchasingo 81% local food purchases ( 250 miles)o By-catch seafood purchasesFood purchasing inventory controlTracking Food-Related GHG EmissionsFood donations to Rutgers Student Food Pantry (NB) and local food insecurity partnersFood waste from Busch Dining Hall feeds pigsTrayless dining (2014): 22% reduction in food wasteReusable Bag Bottle Program (Meal Plans)o Over 1,500,000 cups, straws and lids have been saved from the landfillo 300,000 bags saved from going to the landfillVegawatt Generatoro waste cooking oil is converted to electricity and heat (hot water for cleaning dishes)Food Waste Digesters at Neilson Dining Hall, Busch Dining Hall, Henry’s Diner and Harvest Cafeo waste food trimmings and leftover food broken down by microorganisms and converted intoenvironmentally friendly “wastewater” and discarded to sewer system; reduces need to takewaste to landfillPackaging Reduction and RecyclingPilot for food waste and student education campaignSustainability within operations including:o energy and water efficiencieso box recyclingo LED Light Bulbs ( 80% energy savings)o Better refrigeration design in new facilities3-8
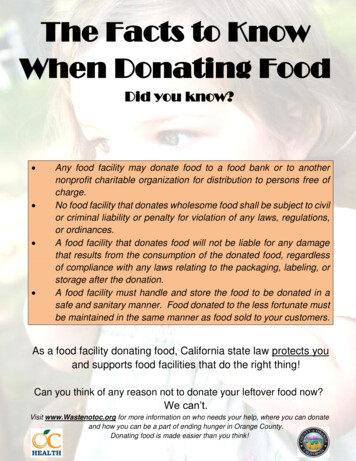
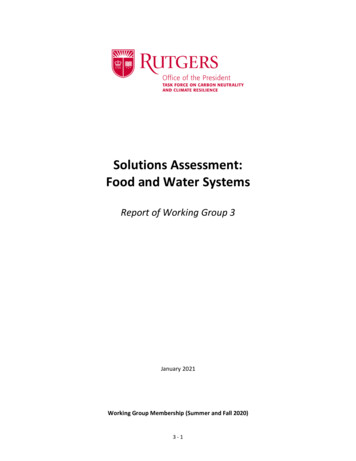
Figure 3.3. Rutgers Dining Services sourcing and purchasing baseline (FY2019)Figure 3.4. Benefits from buying localWG3 also obtained a list of sustainability efforts by Gourmet Dining, LLC., the food vendor for ourNewark and Camden Campuses as well as Athletics food operations (Table 3.2). These sustainabilityefforts are very similar to sustainability efforts by Rutgers Dining. Gourmet Dining has made recentadvances with single plastic bag elimination and “STOP FOOD WASTE DAY”. Gourmet Dining also has3-9
tracks food waste using the Trim Trax program8, developed by Compass Group USA, Inc. (Gourmetdining’s parent group), which has can be used for GHG emissions reductions. Compass Group USA hascommitted to reducing food waste by 25% by 2020 from its 2016 baseline9. “Stop Food Waste Day” is partof Earth Month and is used to promote food waste awareness and reduction. A new Carbon Foodprintprogram from Compass group will be implemented by Gourmet Dining when they begin operations10.Table 3.2. Sustainability measures from Gourmet Dining, LLC (Source: Brain Conway, Dining Director, RutgersNewark)The Rutgers Newark Dining Program has always been driven to become an efficient, sustainable andvital component of our Rutgers Newark community. Included below are only some of the sustainablepractices we execute on a daily basis. We are trayless dining – water reduction, reduces food wastePlastic Bag free - We have removed all plastic bags from our campusWeekly Food Donations to campus and surrounding pantriesRecycling of all used cooking oilAll our to-go containers are reusable and recyclablePlastic utensils are made from fully recyclable productsDish Washer is energy efficientTrim Trax Program – Utilized in our kitchens to monitor food waste from yield. All fooddonated to composting initiativesCompass Group WASTE NOT program - to track, measure and reduce food waste at the unitlevel to save on hauling costs, production costs and food waste.Imperfectly Delicious Produce – rescued produce which helps reduce the emissions ofmethane gas that is produced from decomposing produceSave the Food – Root to Stem cooking trainingSTOP FOOD WASTE DAY – we weigh all wasted food in our dining program so our guests cansee a tangible fact on the amount of food that is actually wasted dailyWe buy from local farmers – Here in Newark we utilize the COMMON MARKET – acontingency of 12 NEWARK based farms and farmersShared composting program with NJIT, a sister university across the streetWe have water dispensers in our dining areas for our staff, reducing the amount of single usebottles usedWe give special consideration to Newark residents when we hire for a positionThese are some of the items the team at Rutgers Newark utilizes in our fight for sustainable practicesand against Climate change.3.1.1.2 Rutgers Drinking WaterFor the first time, this working group has gathered background information on drinking water and exploredthe impact that single use plastic bottles has on Rutgers GHG emissions. Upon hearing concerns over thequality of water at our earlier townhall meetings, we explored Rutgers drinking water systems from publicwater utilities (see Appendix), Rutgers hydration systems and water bottle usage. Data has been collectedTrimTrax trademark: 5-2020/Personal communication from Brian Conway and Julia Jordan to Xenia Morin, 11/11/2020. The Carbon FoodprintTool in an online tool that can be used by managers to help track the environmental impact of food service. This toolmay be licensed with a monthly fee of 85 per cost center.89103 - 10
from Rutgers through the climate task force survey, and some of its vendors. Currently more work isneeded to create a baseline number but estimates can be made for GHG emission savings from shiftingfrom single use water bottles to reusable water bottles with filtered tap water.Outside of Rutgers Dining Services, spending of bottled water by Rutgers departments was 287,584 (FY20;July – May) and 387,273 (FY19). This water was provided by 4 and 5 vendors, respectively11. Otherbeverages were purchased as part of a ColaCola pouring contract. Spending in FY19 totaled 1,428,50012.WG3 does not yet know how many bottles or what volume of water these dollar amounts represent norhow many offices are currently supplied but offices that have switched to filtered water systems report costsavings at the departmental level. Whether there is the possibility to increase the amount of office-basedwater filter systems is unknown at this time.3.1.1.3 Vending Machines and Hydration Stations MapsBased on data obtained from Rutgers procurement, additional maps of Rutgers food systems were created.Newark’s campus is home to 24 snack vending machines, with only 2 having Energy Star Ratings, whileCamden’s campus has only 10 snack vending Machines. On the New Brunswick Campus we find thefollowing numbers of snack vending machines: Busch Campus: 42; Livingston: 20; College Ave: 32; andDouglas/Cook Campus: 25. Many have LED lighting, which reduces energy use, and Busch Campus hasthe highest number of Energy Star rated vending machines with 19 (45% of total).We have produced Google map layers which include the locations of snack vending machines andhydration stations (see Appendix C) and these will be posted publicly at a later time on the sustainabilitywebsite. These maps also include information about their sustainability features, such as LED lighting andenergy star ratings, where available13. Maps for beverage vending machines at the New Brunswick campushave also been made but are not shown here. There are some vending machines at other non-campuslocations and those have also been cataloged. We believe that upgrading to energy star vending machinecould reduce GHG emissions but this may have a small impact overall.3.1.1.4 Food and Catering SpendingWG3 has also obtained data from Rutgers Procurement Office14 for food and catering spending at RU-NewBrunswick, RU-Newark, RBHS, intercollegiate athletics, RU-Camden and other university units. Totalspending was 10,124,239 in FY19, with approximately 11% ( 1,150,420) to Gourmet Dining Services,LLC. WG3 has not calculated GHGs emissions associate with catering services.3.1.1.5 Background on Indirect EmissionsEmissions from food systems, from production through supply chain and food waste, are categorized asScope 3 emissions. Scope 3 emissions refer to all indirect emissions created by Rutgers that are associatedwith agriculture and food. Some Scope 1, such as fleet transportation for Rutgers dining, energy used forcooking on campus, and energy used for cold storage for food, are associated with Rutgers food systems oncampus but were not quantified by WG3 for this report. While fleet transportation is known and could beshifted to electrification or other renewable energy sources, no data is available for the amount of energyused for cooking and cooling by facility because we do not have meters recording this data.11121314Data provided by Rutgers Procurement.Data provided by Rutgers Procurement.These maps will be posted at a later date on the Rutgers sustainability website.Dennis Demarino to Xenia Morin, personal communication, 7/1/2020.3 - 11
According to the Corporate Value Chain (Scope 3) Accounting and Reporting Standard of the GHGProtocol, Scope 3 is comprised of 15 categories15. For the purposes of the Food Systems and Waterworking group the 2 most important categories considered were:Category 1: Purchased goods and services (which includes food and water)Category 5: Waste generated in operationsScope 3 accounting presents enormous methodological challenges. There are two major barriers to accuratequantification of Scope 3 emissions: first is data availability, and second is boundary-setting. Data wasavailable from Rutgers Dining Services and this has been used for this report. Additional data is still beingtracked down and, if sufficiently robust enough for GHG calculations, will be integrated into the climateaction plan proposal once available.From a methodological perspective, there are significant differences in the GHG emissions associateddifferent foods and with different with food production methods16, and to standardize calculations and allowfor comparison with other schools, the SIMAP carbon and nitrogen-accounting platform17 was used tocalculate GHG emissions from food sourced by Rutgers Dining. SIMAP requires that we be able toprovide information on the food product, the weight or volume of purchase, whether the food was local( 250 miles) and/or certified organic. One challenge in calculating GHG emissions is that food purchasesmay change with the seasons, so some estimates have been made to reflect net purchases over 2018-2019(FY2019).GHG emissions are also associated with refrigeration and the cold supply chain18. These emissions areassociated with the energy used for cooling and maintenance of cold or freezing temperatures, as well asemissions associated with the inadvertent release of refrigerant compounds. According to ProjectDrawdown, older refrigerants, CFCs and HCFCs, which caused ozone depletion were replaced by HFCsunder the Montreal Protocol. HFCS spare the ozone layer but have very high global warming potential(GWP) compared to CO2 (1,000-9,000 times) and must be handled carefully to prevent release. Anamendment to the Montreal Protocol was negotiated in 2016 with phase outs in the U.S. beginning in 2019.Substitutes are now on the market. Great care must be taken at the end of the refrigeration equipment’s lifeto ensure that these chemicals are not released but instead reused or transformed into compounds that nolonger cause warming 19. NJ DEP and EPA oversee refrigerant handling. WG3 has not performed an auditof refrigerant containing items on campus but anticipates these units are abundant in research laboratories,offices, food service locations and residence halls. Not all of these locations are for food, but nonetheless,waste disposal of any refrigeration units should be done under supervision according to regulations20.Rutgers has started to design new dining facilities with a glycol loop which cools equipment withoutcontributing heat to the indoor space which reduces the need for additional air conditioning and lowersGHG emissions. This approach demonstrates that refrigeration practices can be designed into future diningfacilities.Corporate Value Chain (Scope 3) Standard. ard. New protocolsfor carbon removals and land use were issued on 10/15/2020 and were not used for this report.Poore and Nemecek (2018) Reducing food’s environmental impact through producers and consumers. Science Vol.360 (6392), pp. 987-992. DOI: 10.1126/science.aaq0216. 7SIMAP Homepage: https://unhsimap.org/homeHu et al (2019). Potentials of GHG emission reductions from cold chain systems: Case studies of China and theUnited States. J. Cleaner Production. Vol. 239, 1. 0959652619329233?via%3DihubProject Drawdown, Refrigerant Management. 3 - 12
3.1.1.6 Rutgers Dining Carbon Food FootprintWorking Group 3 has obtained data for food purchased for FY2019 for food used in Rutgers Diningoperations on the New Brunswick campus to estimate its scope 3 emissions. Data analysis has allowed us toidentify and estimate key GHG contributions using SIMAP, a GHG calculator. Over 33,000 meals per dayduring the semester, and over 6,267,210 meals were served in FY2019 by Rutgers Dining. Based onSIMAP analysis, Rutgers Dining’s FY19 food-related emissions totaled 20,462 tonnes CO 2e, or roughly 3.3kg CO2e per meal served. A summary of the SIMAP data is shown in Figure 3.2 and Table 3.3. Beef (37%)and chicken consumption (28%)21 make up 68% of our estimated GHGs related to food purchases and arethe largest contributors overall. Pork, fish, egg and dairy each made up 5% of emissions, while plant-basedfoods constituted the remaining 15%. While emissions associated with chicken purchases has lower GHGemissions per unit weight than beef, much more chicken is consumed in Rutgers Dining Facilities whichincreased its overall net emissions.Table 3.3. Emissions and total purchases by Rutgers Dining Services, FY 2019, based on SIMAP analysis.CategoryGHG (t CO2e)Weight TotalSome additional data on sustainability measures has been collected from Gourmet Dining, LLC, theRutgers food vendor at the Newark, New Brunswick, and Athletics. This group adheres to manysustainability initiatives and these are summarized in Table 3.2, above. Additional data is still needed fromthis group to calculate GHG emission associated with food sales as this data is collected by its parentcompany, Compass Group.See the Working Group on Supply Chain and Waste Management report for detailed information on foodwaste at GHGs at Rutgers.3.1.1.7 Food Waste ReductionFood: Source reduction initiatives are at the forefront of waste reduction strategies in HigherEducation institutions. In fact, Rutgers University’s peer institutions have developed robust and modelsource reduction programs. A number of institutions have implemented reusable to-go containers with thecomplete removal of disposable containers. In addition to source reduction strategies, Syracuse, Duke,Cornell, University of Pennsylvania and University of Maryland have focused on increasing the compostingof organic waste. Composting organic waste helps divert organics from landfills and incinerators, ultimatelyreducing their impact procurement, the idea is to bolster and increase local and regional purchases as muchas feasibly possible. In order to support local purchasing, peer institutions have implemented on-campusfarms and gardens.This may be an overestimate as the Chicken comes from Bell & Evans in Pennsylvania (local) which are grown withorganic feed and high animal welfare standards and are processed in a modern 213 - 13
Most importantly, the ed
d. Co-benefits: health, environmental health, landscapes 2. Climate-friendly food labeling 3. Adopt a climate-friendly food labeling system for online menus 4. Consumer Education and Awareness Campaigns a. On campus: for students on meal plans b. Off-campus: for students, faculty, staff and alumni 5. Reduce Food Waste a.