Transcription
12nd International Conference on Urban Drainage, Porto Alegre/Brazil, 11-16 September 2011Quantifying the restoration of evapotranspiration andgroundwater recharge by vegetated infiltration systemsP. Hamel*1, T. D. Fletcher1, C.J. Walsh2, E. Plessis31Department of Civil Engineering, Building 60, Monash University, Victoria 3800, Australia2Department of Resource Management and Geography, The Univ. of Melbourne, 221Bouverie St., Parkville, Victoria, 3010, Australia3INSA-Lyon, LGCIE, 34 avenue des Arts, 69621 Villeurbanne CEDEX, France*Corresponding author, e-mail perrine.hamel@monash.eduABSTRACTInfiltration-based source-control technologies are increasingly used in urban stormwatermanagement in an attempt to restore pre-development catchment hydrology. To better assessthe potential of infiltration systems to restore both the subsurface flow and theevapotranspiration in a catchment, information is needed about the fate of infiltrated water. Toinvestigate this aspect, an experiment was set up to monitor the soil moisture surrounding avegetated infiltration system (‘raingarden’). The proposed methodology allows partitioningthe volume of exfiltrated water between the deep and shallow soil layers of surrounding soils,with the latter volume being hypothesised as available for evapotranspiration. Preliminaryresults show that: i) less than 3% of the influent water is evapotranspired from the raingardensurface area itself; ii) the heavy clay soil within the lower part of the soil profile significantlylimited exfiltration, meaning that most of the water (at least 70%) is exfiltrated into shallowlayers. This provides opportunity for water to be later evapotranspired by surroundingvegetation. However, due to the absence of water stress during the studied period, theevapotranspiration from the surrounding soils was not significantly altered by the raingarden,such that the infiltrated water effectively recharged groundwater. The study has implicationsfor the design of stormwater management strategies which aim to reduce the stormwaterrunoff volume and restore baseflows lost as a result of urbanization.KEYWORDSEvapotranspiration; infiltration system; soil moisture; water balanceINTRODUCTIONThe degradation of urban streams is partly due to modification of the natural catchmenthydrology, including an increase in surface runoff, with a corresponding reduction inevapotranspiration (ET) and infiltration-fed baseflows (Paul and Meyer 2001). Infiltrationbased source-control technologies are often applied to mitigate these detrimental effects, byemulating natural infiltration and ET. They include a wide range of techniques such as biofiltration cells (also known as ‘raingardens’), infiltration trenches and swales. Modelling theirimpacts on ET and groundwater recharge is crucial for designing and assessing stormwatermanagement strategies that aim to restore catchment hydrology. Such modeling can informthe optimal spatial distribution of these systems, along with design configurations tomaximize infiltration or ET, depending on the objectives for the catchment. Various attemptsto represent these catchment-scale effects have been made via semi-distributed reservoir-1Quantifying the restoration of evap. and groundwater recharge from infilt. syst.
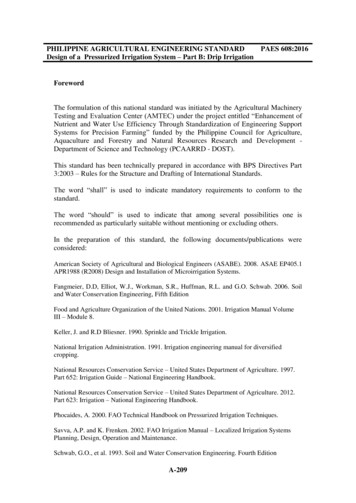
12nd International Conference on Urban Drainage, Porto Alegre/Brazil, 11-16 September 2011based models (Göbel et al. 2004; Shuster et al. 2007; Elliott et al. 2010).This approachstrongly relies on being able to represent the water balance of the systems, since the globalcontribution (to the catchment ET flux or subsurface flow) is a function of the contributionsby the individual systems.However, little information is available on the ‘total’ water budget of infiltration systems, i.e.one that quantifies water fluxes not only within the system itself but considers fluxes withinthe surrounding environment. Often, studies focus on the partitioning between ET, infiltrationand outflow (if any), without taking into account the fate of the exfiltrated water (HolmanDodds et al. 2003; Li et al. 2009; Palhegyi 2010). This omission may be critical in the case oflow conductivity soils, where the exfiltrated water is likely to be retained and evapotranspiredby surrounding vegetation (rather than seeping down to recharge the groundwater). Toinvestigate this idea, we conducted a field experiment to partition the filtered water from araingarden into ET and deep seepage. In addition to the monitoring of inflow and outflowfrom the raingarden, the analysis of moisture in the surrounding soils allows a betterunderstanding of the total water budget of the raingarden. This article presents the preliminaryresults from the experiment, showing that most of the water is exfiltrated in the shallowlayers, meaning that the evapotranspiration of much of the exfiltrated water is possible.METHODSExperimental set-upThe experimental site was a raingarden built in 2008 in a private property of Mount Evelyn(40 km from Melbourne, Australia). The infiltration system is one metre deep, made up of450 mm of loamy sand overlying a 450 mm drainage layer of scoria (a volcanic gravel with aporosity of around 50-60%), with two 50 mm transition layers (course sand and fine gravel) inbetween the loamy sand and scoria. Its area is 10.1 m2, with a length of 8.4 m and width of1.2 m. It thus represents 3.1 % of its 321 m2 impervious catchment area, but it also receivesoccasional overflow from a 5.5 m2 raingarden that drains a 28 m2 roof area. Its total perimeteris 19.2 m, with one side (8.4 m) of the system lined with a double layer of LDPE plastic toprevent water exfiltration towards the nearby swimming pool and house. It does not feature anunderdrain so that losses occur by ET and exfiltration only.The monitoring of the raingarden includes a tipping bucket rain gauge (Environdata RG20)and water level and overflow probes (Odyssey capacitance water level loggers) which wereinstalled in May 2008 to estimate the inflow, exfiltration and ET fluxes from the raingardenon a 5 min-time step. Additional sensors were installed in December 2010 and January 2011to estimate the impact of the raingarden on surrounding soils, i.e. to partition the amount ofa)b)Figure 1. a) Schematic of the experimental set-up involving three sets of five soil moistureprobes to investigate the influence of the raingarden on surrounding soils; b) Discretisation ofthe surrounding soil in layers to calculate exfiltration from the raingarden.Hamel et al.2
12nd International Conference on Urban Drainage, Porto Alegre/Brazil, 11-16 September 2011exfiltrated water between ET and deep infiltration. Moisture sensors (Campbell ScientificCS616) were thus installed in the surrounding soils in three sets of five buried at depths of 10,20, 32, 60 and 85cm (Figure 1a). Each of the three sets is representative of a given distancefrom the trench (namely 0.5 m, 3.5 m and 9 m), the furthest one being used as a reference (i.e.soil not impacted by the raingarden). Data are collected to a Campbell Scientific CR800datalogger and calibrated according to a laboratory-derived curve. Finally, to calculatepotential ET (PET) additional weather station components were added to record airtemperature and humidity (Campbell Scientific HMP45C), soil temperature (Pt 385 RTD) at10 and 40 cm deep, wind speed (03002-L RM Young) and solar radiation (CampbellScientific LP02). Data for the moisture sensors and the weather station are recorded at a 30minute time step.Hydraulic behaviour of the raingardenTo characterize the hydraulic behavior of the raingarden, a water balance was calculated asfollows, with values recorded on a monthly basis.Inflow. Inflow calculation was based on the volume of effective rain falling on the 321 m2catchment and the outflow from the small raingarden draining a 28 m2 roof area. Initial lossfrom the roof was set to 0.6 mm and the rain from events less than 0.6 mm was assumed to betotally evaporated after 5 hours of dry weather. The small raingarden outflow was modeledwith the MUSIC software (eWater CRC 2009), using a 6-minute time step and was (due to itslarge storage) found to contribute 0.07% of the total inflow to the main raingarden.Exfiltration. In order to separate ET from exfiltration, a semi-automatic filter was developedto measure night-time water level drawdown rates (from 7pm to 7am) for all dry periods fromJanuary to December 2009. The 205 measurements were grouped into 100 mm-thick layers(except for the first 500mm layer: Figure 1b). An average hydraulic conductivity Ki wascalculated for the surrounding soil layer by solving the following equation expressing themass balance for an infinitesimally narrow layer, being equal to the volume exfiltrated (withthe assumption that no ET occurs during night-time):!!"!!!" !ℎ !! (ℎ !!" )!"2where ! is the porosity of the layer in the raingarden; !!" and !!" the area (10.1 m2) andunlined perimeter (10.8 m), respectively, of the raingarden; ℎ is the water level (m); and !!the equivalent hydraulic conductivity (m s-1).To account for the dependency of Ki on soil moisture, a multiple linear stepwise backwardsregression was performed between the drawdown rates and antecedent moisture conditions.The independent variables included the H-hour antecedent mean water level (for H 3, 12, 24,72) and the D-day antecedent rainfall depth (for D 3, 7, 15, 30), both assumed to representthe moisture conditions, as well as the height (to reduce the effects of a layered representationof the soil). We stopped the backwards regression process when the R2 of the model waslower than 0.5 or when only two factors were left.Finally, to smooth the model output (i.e. avoid the break of slope between layers) weweighted the hydraulic conductivity such that the exfiltration rate is continuous betweenlayers, i.e.:!!"!!"!! ℎ! ℎ! !!" !!!! ℎ! ℎ! !!"22where !! ℎ is the weighted hydraulic conductivity (m s-1) function.The weighting function was chosen as a linear function of height such that the totalexfiltration over the layer is equal to that calculated with the non-weighted function, i.e.:3Quantifying the restoration of evap. and groundwater recharge from infilt. syst.
12nd International Conference on Urban Drainage, Porto Alegre/Brazil, 11-16 September 2011!!!!!!!! (ℎ) (!(ℎ ℎ!) !) !!!!!!!!"!!"!! ℎ ℎ !!" !ℎ !! ℎ !!" !ℎ22!!Evapotranspiration from the raingarden. As the water level in the raingarden rarely dropsbelow 0.5 m, ET from the raingarden was assumed to be equal to PET, set to the monthlyaverage value given by the Bureau of Meteorology (2010). While this approach is likely tooverestimate ET, it is justified by a sensitivity analysis showing the negligible contribution ofET to the total water budget (see Results). Only when the water level was lower than 0.5 mdid we introduce a water stress function, decreasing the ET by a factor of four, based on therate observed during the month of February 2009 when the hottest and driest conditionsoccurred. The ET was preferentially taken from the upper layers, i.e. the unsaturated zone inthe raingarden, as the product of PET and a water stress function:0 !" ! !!(! !! )!"# !" !! ! ! !" ! !!" !!!"# !" ! ! Where ! is the volumetric water content of the unsaturated upper layers of the raingarden;!! 0.1 the wilting point; ! 0.22 assumed to be the field capacity; and PET in mm/day (Dalyet al. 2009). Therefore, only the difference between PET and ET from the unsaturated zonewas extracted from the saturated zone.The performance of the model was assessed via the Nash-Suttcliffe efficiency.Surrounding soil moisture analysisTo characterize the impact of the raingarden on surrounding soil moisture, the drying ratesover 1, 3 and 8 days (provided no rain occurred during these periods) were derived from themoisture sensors data. All dry spells of at least 24 hours were analysed and an ANOVA wasperformed to compare the drying rate of a given sensor to its equivalent sensor (at the samedepth) at the other two distances from the raingarden. In addition, correlation analyses wereperformed between the drying rates and explanatory factors including the initial moisturecontent of the sensor, that of the sensors above and below (if any), the soil temperature andthe meteorological parameters (incoming solar radiation, wind, air temperature and humidity).At this stage, a total of 11 spells were filtered over the first three months of data. It is notedthat the data from the shallowest sensor (for each location) shows a rapid decrease in soilmoisture, making the calculation of the drying rate straightforward. However, deeper sensorswere sometimes affected by both the percolation from upper layers and the root uptake, whichmakes it more difficult to infer the drying rate. Events affected by such behaviour werediscarded in the present analysis (although will be incorporated into future analyses, when alonger time-series is available). This percolation affected the drying rates calculated over 1and 3 days;the 8-day average drying rate are less affected, with percolation negligible after thefirst 3-4 days. Unfortunately, few spells were long enough to calculate the 8-day averagedrying rate so the results presented at this stage focus only on the drying rates over 3 days(further data is currently being gathered and will be used to refine these calculations).Finally, to assess the actual ET from the surrounding soils, potential ET was calculated fromthe FAO-56 Penman-Monteith equation for a grass reference crop (assumed to be similar tothe lawn present on the site) with the data from the weather station. A water stress functionwas defined in a similar way to the above equation, with !! 0.3 and ! 0.2 derived fromthe literature (Li et al. 2001).Hamel et al.4
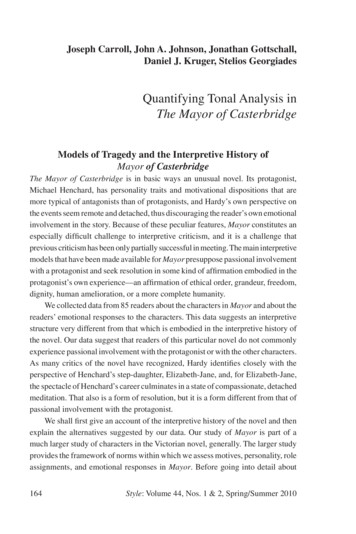
12nd International Conference on Urban Drainage, Porto Alegre/Brazil, 11-16 September 2011RESULTS AND DISCUSSIONSExfiltration ratesExfiltration rates, derived from water level data, and the inferred hydraulic conductivities(Ki), varied strongly with depth (Table 1, Figure 2a). There was also large temporalvariability in exfiltration rates, which was in part explained by antecedent conditions (Table2). The best predictor varied between soil layers: water level was found to have a strongereffect on deeper layers (where the transition from high to low conductivity occurs); averagewater level was found to be a better predictor for K600, K700 and K900, while the antecedentprecipitation over 30 days was found to better predict K800. This is not surprising, given thatrainfall will have most influence on the layers closest to the surface.Two hypotheses are proposed to explain the data variability and the lack of consistentpredictive factors. Firstly, the selected explanatory variables may not be representative as theyare only a surrogate for soil moisture. Since the exfiltration rate is linked to the soil hydraulicconductivity, which is itself a function of soil moisture, a direct measurement of soil moistureis likely to provide much more reliable predictions. Such data will become available shortlyfrom the recently-installed soil moisture probes. Secondly, we hypothesise that the exfiltrationrate is not only dependent on intrinsic soil properties, but also a function of the soil moisturein the shallow (near-surface) layers and the presence of a low permeability layer below this.As the [600;700] mm layer has a very low hydraulic conductivity (see Figure 2a), it is likelythat water from the shallow layers is prevented from seeping and instead flows towards theraingarden. This phenomenon only occurred during intense rain events and continued until theshallow layers reach field capacity. During this time, the measured exfiltration rate in thelayers below is the difference between exfiltration from deep layers and infiltration (back intothe raingarden) from the shallow layers above. This would explain the negative correlationbetween the measured infiltration rate in the upper layers (negative a2 and a1 values for rate800and rate900, respectively: Table 2) as the increase in the hydraulic conductivity is offset by thebackflow from the soil layers (Figure 2b).800700500600Height (mm)9001000Table 1. Drawdown rates from the water level data and inferred hydraulic conductivitiesDepth range (mm)[0;500] [500;600] [600;700] [700;800] [800;900] [900;1000]16836922114Sample size0.673.2962.597.290.3Mean exfilt. rate (mm/h) 0.200.160.593.0921.837.326.0St. dev (mm/h)0.110.341.6631.549.045.5Ki (mm/h)a)020406080100120140b)Exfiltration rate (mm/h)Figure 2. Hydraulic conductivity inferred from the exfiltration rates for 100 mm-thick layers(a) and schematic of the implications on a potential backflow from shallow layers (b)5Quantifying the restoration of evap. and groundwater recharge from infilt. syst.
12nd International Conference on Urban Drainage, Porto Alegre/Brazil, 11-16 September 2011Table 2. Summary of the results from the backwards stepwise regression analysis (factorsincluded in the analysis were mean water level, antecedent level over 3, 12, 24 and 72 hours,and antecedent rain over 1, 7, 15 and 30 days); a1, a2 and b are the regression coefficientsBest predictorsR2a1a2brate6001. Height0.74- ‐0.0760.076/2. Antecedent Level 3 hrate7001. Height0.580.0887- ‐0.02- ‐40.52. Antecedent Level 72 h1. Antecedent Rain 30 d0.530.512- ‐0.26188rate8002. Antecedent Level 72 hrate9001. Antecedent Level 72h0.73- ‐0.403- ‐1.023622. Antecedent Rain 3dWater balanceOver the 22 months of analysis, ET loss from the trench alone constituted 3% of the influentvolume, consistent with studies on biofiltration cells (Holman-Dodds et al. 2003). While somestudies have suggested much greater losses (Hatt et al. 2009), they have not explicitlymeasured or modelled ET. Interestingly, the model predicted a total exfiltration volume largerthan the inflow volume, sometimes by up to 50%. This finding corroborates the backflowtheory explained above, where a significant volume of water from the shallow layers reinfiltrates the raingarden. However, uncertainties related to the exfiltration rates cannot beignored and could also account for this difference between inflow and exfiltration. Themonthly N-S efficiency averaged 0.5 during 2009, but negative values were found for half ofthe months in 2010 (i.e. during the validation period, when no exfiltration rate was measured).Further analyses are in progress to explain the difference in exfiltration rates during 2009 and2010 results.However, we note that the Nash-Suttcliffe efficiency measures the dynamic behaviour of theraingarden and should thus not be a criterion to reject completely the model. Specifically, ananalysis of its uncertainties makes it possible to obtain reliable estimates of deep infiltration.Since the exfiltration rates of the layers below 600 mm are very low, the confidence intervalfor the amount of water exfiltrated in deep layers is relatively small (the 95% confidenceinterval for the 600 mm-exfiltration rates is [0; 1.85] mm/h). Therefore, we can observe that10 % of the treated water will directly infiltrate to deep layers, with a maximum range of [0;30%]. This means that the majority of the filtered flow is exfiltrated into shallow layers (lessthan 0.4 m-deep), a depth which corresponds to the root zone depth observed during fieldwork (in accordance with typical values for grass, Fox et al. 1953). As a result, this water isavailable for ET and only the excess water will slowly percolate to deeper layers.Statistical analyses of dry spells and total water budgetDrying rates. The drying rates measured from the three sets of sensors are reported in Table 4.As expected, the deepest sensors from Set 1 are always at saturation and show no significantvariation over time. Also, the slow drying rate from the 0.85 m-deep reference sensor (Set 3)Table 2. Average water balance of the raingarden; ET is from the raingarden only; theexfiltration volume does not account for the potential backflow from surrounding soilsRain (mm)Inflow (m3)ET (m3)Exfiltration (m3) 600 mm 600 %1002.710.387.0Hamel et al.6
12nd International Conference on Urban Drainage, Porto Alegre/Brazil, 11-16 September 2011Table 3. Drying rates (mm/h) over three days at the five depths for each set of sensors (Sets 1and 2 are 0.5 m and 3.5 m from the raingarden, respectively; Set 3 is the reference .7Depth(m)0.320.41.34.30.6 0.2 0.21.20.85 0.21.01.7is consistent with the range of hydraulic conductivities expected at that depth, which providesconfidence in the measured values. Interestingly, the drying rates at shallow depth (0.1 m)show significantly different values (ANOVA p 0.005), ranging from 6 mm/h for thereference set to 16 mm/h for the sensor from Set 1. Given the very low conductivity at 0.4 mdepth, the high drying rate measured next to the trench may be explained by a lateral flowback into the trench, which corroborates the backflow phenomenon discussed above.Finally, we note that the limited period of data for the soil moisture precludes any conclusionon the behavior of Set 2 (i.e. if it is more similar to Set 1 or to Set 3). While the results showsignificant differences between the drying rates, it is too early to deduce the lateral influenceof the raingarden on surrounding soils. These results will determine the influence area of theraingarden which may present increased ET losses.ET from surrounding soil. The calculation of PET over the study period confirmed the lowvalues expected from the wet weather, since it average 2.5 mm/day (about twenty times lowerthan the drying rates). Furthermore, sensors indicated that the average water content over theroot zone did not drop below ! such that the plants did not experience water stress. Hence,actual ET was equal to PET for all locations, with no noticeable influence from theraingarden. These results are substantiated by the correlation analyses, showing that dryingrates were not significantly influenced by meteorological variables (thus ET was not a keydriver of the observed drying rate).Therefore, the ET loss from the soils surrounding the raingarden was not different from thatof the reference point (already at its maximal PET) and as a consequence, all exfiltrated watereffectively recharged groundwater. To put these results in perspective, it is noted that theyrely on: i) the specific vegetation (only comprised of grass in the surrounding area so that notree could have withdrawn larger amounts of water); ii) the climatic conditions, which wereunusually wet for over the first two months of data, meaning that the vegetation did not sufferwater stress during this initial period of soil moisture monitoring.CONCLUSIONS AND FUTURE RESEARCHWater balance of the Rangeview raingarden. A methodology was proposed that allows thecalculation of the total water budget from an infiltration system. In the particular case ofheavy clay soils, it showed that the traditional approach to calculate a system’s water balance(focusing on the ET from the raingarden only) is likely to underestimate the total ET. Wehave shown that more than 70% of the exfiltrated water is released into the shallow soillayers, where further ET is likely. As percolation occurs at a very slow rate (less than 1mm/h), the soil water is available for plant uptake. However, the limited period of soilmoisture data available for this study does not indicate such an enhancement of ET. As theplants did not experience a water stress, ET near the raingarden was equal to actualevapotranspiration similar to that in the reference area 9 m from the raingarden. In any case,7Quantifying the restoration of evap. and groundwater recharge from infilt. syst.
12nd International Conference on Urban Drainage, Porto Alegre/Brazil, 11-16 September 2011the ET was negligible compared to seepage. This implies that during the studied period,virtually all the exfiltrated water has recharged groundwater. Moreover, given the unusuallywet weather, the lateral extent reached by the exfiltrated water in the shallow layers cannot beascertained from the first months of data.Contribution and further research. In addition to the analysis of further months of data,several improvements to the proposed model are in progress. Firstly, the raingardenexfiltration model will be tested with a new statistical approach (information theoreticapproach) to identifying and assessing the optimal models for predicting exfiltration rates. Inaddition, the model will be developed using the directly-measured soil moisture andexfiltration rates. This is expected to improve the efficiency of the model which is currentlybased on surrogate measures of soil moisture (antecedent precipitation and water level in theraingarden). In addition, a soil water model is being developed to directly calculate ET fromthe soil moisture profile in the surroundings of the raingarden. This model will be validatedby measurements by ET flux chambers scheduled for late April.The final results of this study will have significant implications for the design of infiltrationsystems. Specifically, the assessment of their potential contribution to ET and groundwaterrecharge will be improved and will inform catchment scale stormwater management strategieswhich aim to restore pre-development hydrology.ACKNOWLEDGEMENTSThe authors wish to thank the Cities as Water Supply Catchments program and its fundingpartners for their financial support to the doctoral project of the senior author. The researchand construction of the raingarden were also assisted by funding from the Victorian WaterTrust and Melbourne Water.REFERENCESBureau of Meteorology (2010)."http://www.bom.gov.au/jsp/ncc/climate averages/evapotranspiration/index.jsp."Daly, E. et al. (2009). "A possible mechanism for soil moisture bimodality in humid land environments."Geophys. Res. Lett. 36(7): L07402.Elliott, A. H. et al. (2010). "Model application to assess effects of urbanisation and distributed flow controls onerosion potential and baseflow hydraulic habitat." Urban Water Journal 7(2): 91 - 107.eWater CRC (2009). Model for urban stormwater improvement conceptualisation (MUSIC) Version 4. Canberra.Fox, R. L. et al. (1953). "Influence of Certain Soil-Proftle Characteristics upon the Distribution of Roots ofGrasses." Agronomy Journal 45(12): 583-589.Göbel, P. et al. (2004). "Near-natural stormwater management and its effects on the water budget andgroundwater surface in urban areas taking account of the hydrogeological conditions." Journal ofHydrology 299(3-4): 267-283.Hatt, B. E. et al. (2009). "Hydrologic and pollutant removal performance of stormwater biofiltration systems atthe field scale." Journal of Hydrology 365(3-4): 310-321.Holman-Dodds, J. K. et al. (2003). "Evaluation of hydrologic benefits of infiltration based urban storm watermanagement." Journal of the American Water Resources Association 39(1): 205-215.Li, H. et al. (2009). "Mitigation of Impervious Surface Hydrology Using Bioretention in North Carolina andMaryland." Journal of Hydrologic Engineering 14(4): 407-415.Li, K. Y. et al. (2001). "An exponential root-water-uptake model with water stress compensation." Journal ofHydrology 252(1-4): 189-204.Palhegyi, G. E. (2010). "Modeling and Sizing Bioretention Using Flow Duration Control." Journal of HydrologicEngineering 15(6): 417-425.Paul, M. J. and J. L. Meyer (2001). "Streams in the urban landscape." Annual Review of Ecology andSystematics 32(1): 333-365.Shuster, W. D. et al. (2007). "Prospects for enhanced groundwater recharge via infltration of urban storm waterrunoff: A case study." Journal of Soil and Water Conservation 62(3): 129-137.Hamel et al.8
12nd International Conference on Urban Drainage, Porto Alegre/Brazil, 11-16 September 2011 3 Quantifying the restoration of evap. and groundwater recharge from infilt. syst. exfiltrated water between ET and deep infiltration. Moisture sensors (Campbell Scientific CS616) were thus installed in the surrounding soils in three sets of five buried at depths of 10,