Transcription
Texas Department of BankingExecutive Summary2021INSTITUTE FOR ORGANIZATIONAL EXCELLENCETHE UNIVERSITY OF TEXAS AT AUSTINREPORT ID: 451
Texas Department of Banking 2021Executive SummaryTable of ContentsIntroduction. 1The Survey . 2Employee Engagement . 3People . 4Constructs . 5Areas of Strength and Concern. 6Climate . 7Focus Forward . 8Appendix A: Demographic Items . A1Appendix B: Primary Items. B1Appendix C: Additional Items. C1Appendix D: Engagement Items . D1Appendix E: Constructs and Related Items. E1Appendix F: Survey Customization Sheet. F1Institute for Organizational ExcellenceThe University of Texas at Austin1925 San Jacinto Blvd., D3500Austin, Texas 787120EMPLOYEE ENGAGEMENTINSTITUTE FOR ORGANIZATIONAL Phone (512) 471-9831Fax (512) 471-9600
Texas Department of Banking 2021IntroductionTHANK YOU for your participation in the Survey of Employee Engagement (SEE). We trust thatyou will find this information helpful in your leadership planning and organizational developmentefforts. The SEE is specifically focused on the key drivers relative to the ability to engageemployees towards successfully fulfilling the vision and mission of the organization.Inside this report, you will find many tools to assist you in understanding the engagement of youremployees. Your first indication of engagement will be the response rate of your employees. Fromthere, we share with you the overall score for your organization, averaging all survey items. Youwill also find a breakdown of the levels of engagement found among your employees. We haveprovided demographic information about the employees surveyed as well as what percent areleaving or retiring in the near future. Then, this report contains a breakdown of the scoring foreach construct we surveyed, highlighting areas of strength and areas of concern. Finally, we haveprovided Focus Forward action items throughout the report and a timeline suggesting how tomove forward with what you have learned from the survey results.Your report represents aggregate data, but some organizations will want further information. Forexample, the SEE makes it possible to see results broken down by demographic groupings. Wewould enjoy hearing how you've used the data, and what you liked and disliked about the SEEexperience. We are here to help you engage your employees in achieving your vision andmission.Noel LanduytAssociate DirectorInstitute for Organizational ExcellenceOrganization ProfileSurvey AdministrationCollection Period:11/15/2021 through 12/03/2021Texas Department of BankingOrganizational Leadership:Charles Cooper, CommissionerBenchmark Categories:Size 3: Organizations with 101 to 300 employeesMission 8 : RegulatoryEMPLOYEE ENGAGEMENTINSTITUTE FOR ORGANIZATIONAL EXCELLENCESurvey Liaison:Lori WrightDirector of Human Resources2601 N. Lamar Blvd.Austin, TX 78705(512) 475-1345lori.wright@dob.texas.gov1
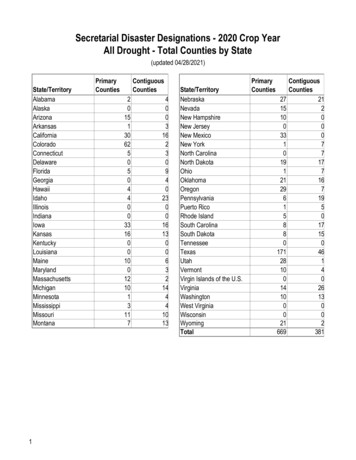
Texas Department of Banking 2021The SurveyPrimary ItemsThe Survey of mployee Engagement (SEE) consists of a series of 48 primary itemsused to assess essential and fundamenta aspects of how the o:rganization functions.The items aeon a 5- point scale from Strongly Disagree (1) to Strongly Agree (5)P 1riirnaryItemsDemographic ItemsAlso included on the SEE instrument are a series of items to ascertain the demographyof the respondents.ConstructsSimilar items are ;grouped together. and their scores are averaged to produce tv,elveconstruct measures. These constJructs c-apture the concepts most utilized by leadershipand drive organizational performance and engagem,:mt.D'StrategicWarkeroup5 pe,rvisionmmarkplaceConstructsCommunitvInf orrna ti onSystemsBlPaylmernalComm nicatia nBenijitsEmplo eeD ve:lopment JobSa isfac::tionagEmployeeEn a em entOverall Score2KeyScores6T e Overall Score is an average of all surv y i ems. and r pr sents lhe overall core forthe organization. It is a broad ind icator for comparison purposes with other entities.Levels of Employee EngagementTwelve items crossing several srnvey constructs have been selected to assess thelevel of engagement (high. moderate. or low) among individual employees.BreakoutCategoriesOrganizations can use breakout categoriesto get a cross-sectional look at specificfunctional or geographic areas. Yourorganization had a total of 6 breakoutcategories.EMPLOYEE ENGAGEMENTINSTITUTE FOR ORGANIZATIONAL EXCELLENCE10AdditionalItemsOrganizations can customize their surveywith up to 20 additional items. These itemscan target issues specific to theorganization. Your organization added 10additional items.2
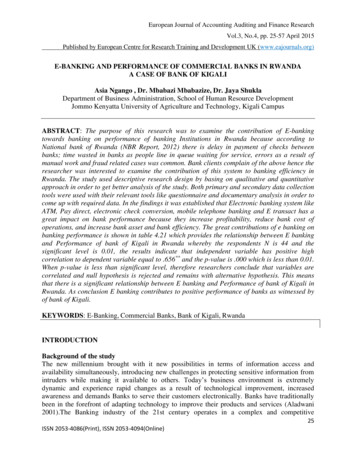
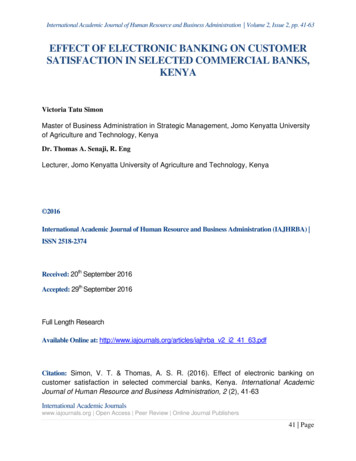
Texas Department of Banking 2021Employee Engagement91%Down 5.5%Response RateThe response rate to the survey is your first indication of the level ofemployee engagement in your organization. Of the 166 employeesinvited to take the survey, 151 responded for a response rate of 91%.As a general rule, rates higher than 50% suggest soundness, whilerates lower than 30% may indicate problems. At 91%, your responserate is considered high. High rates mean that employees have aninvestment in the organization and are willing to contribute towardsmaking improvements within the workplace. With this level ofengagement, employees have high expectations from leadership toact upon the survey results.350Overall ScoreThe overall score is a broad indicator forcomparison purposes with other entities. Scoresabove 350 are desirable, and when scores dipbelow 300, there should be cause for concern.Scores above 400 are the product of a highlyengaged workforce. Your Overall Score fromlast time was 408.Overall Score: 412Levels of Employee Engagement32%Twelve items crossing several survey constructs have been selectedto assess the level of engagement among individual employees. Forthis organization, 32% of employees are Highly Engaged, 34% areEngaged, 31% are Moderately Engaged, and 3% are Disengaged.34%31%3%Highly Engaged employees are willing to go above and beyond intheir employment. Engaged employees are more present in theworkplace and show an effort to help out. Moderately Engagedemployees are physically present, but put minimal effort towardsaccomplishing the job. Disengaged employees are disinterested intheir jobs and may be actively working against their coworkers.For comparison purposes, according to nationwide polling data,about 30% of employees are Highly Engaged or Engaged, 50% areModerately Engaged, and 20% are Disengaged. While thesenumbers may seem intimidating, they offer a starting point fordiscussions on how to further engage employees. Focus on buildingtrust, encouraging the expression of ideas, and providing employeeswith the resources, guidance, and training they need to do their bestwork.EMPLOYEE ENGAGEMENTINSTITUTE FOR ORGANIZATIONAL EXCELLENCE3
Texas Department of Banking 2021PeopleExamining demographic data is an important aspect of determining the level of consensus andshared viewpoints across the organization. A diverse workforce helps ensure that different ideasare understood, and that those served see the organization as representative of the community.Gender, race/ethnicity, and age are just a few ways to measure diversity. While percentages canvary among different organizations, extreme imbalances should be a cause for concern.Race/EthnicityAfrican Am/BlackIYEARS OF SERVICEWith this Organization5.3%WhiteAsianNative Am, Pac IslPrefer not toanswerPrefer to selfdescribe72.8%I 2.0%I 2.6%-15.2%I 2.0%0%25%--50%75%100%Age (in years)16-2930-3940-4950-5960 Prefer not toanswer16.6%FOCUS FORWARD» 21.2%7%19.9%25%50%75%100%MalePrefer not toanswerPrefer to selfdescribeI 1.3%25%50%75%EMPLOYEE ENGAGEMENTINSTITUTE FOR ORGANIZATIONAL EXCELLENCECAN RETIREThis percentage of respondentsindicated that they are or will beeligible for retirement within twoyears.58.3%I 6.0%0%032.5%INTEND TO LEAVEUnderstand why people are leavingyour organization by examiningretention factors such as workingconditions, market competitiveness,or upcoming retirement.18%GenderFemale20% New Hires (0-2 years)31% Experienced (3-10 years)36% Very Experienced (11 years)13% Prefer not to answerEach figure represents about 1.7 employees.18.5% 11.9% 11.9%0%iiiiiiiiiiiiiiiiii iiiiiiiiiiiiiiiiiiiiiiiiiiii iiiiiiiiiiiiiiiiiiiiiiiiiiiiiiiii iiiiiiiiiii100%4
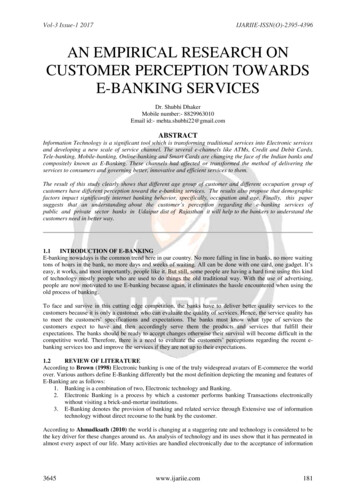
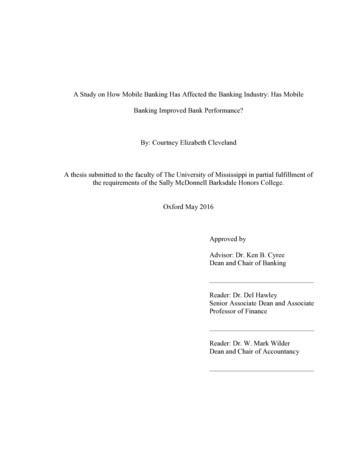
Texas Department of Banking 2021ConstructsSimilar items are grouped together and their scoresare averaged and multiplied by 100 to produce 12construct measures. These constructs capture theconcepts most utilized by leadership and driveorganizational performance and engagement.Each construct is displayed below with itscorresponding score. Constructs have been codedbelow to highlight the organization's areas ofstrength and concern. The three highest are green,the three lowest are red, and all others are yellow.Scores typically range from 300 to 400, and 350 isa tipping point between positive and negativeperceptions. The lowest score for a construct is100, while the highest is 500.FOCUS ORWARD » Every organization faces differentchallenges depending on workingconditions, resources, and jobcharacteristics. On the next page, wehighlight the constructs that are relativestrengths and concerns for yourorganization. While it is important toexamine areas of concern, this is also anopportunity to recognize and celebrateareas that employees have judged to bestrengths. All organizations start in adifferent place, and there is always roomfor improvement within each area.Construct ace431Community411Information Systems420Internal Communication409Pay334Benefits405Employee Development407Job Satisfaction410Employee Engagement421100150EMPLOYEE ENGAGEMENTINSTITUTE FOR ORGANIZATIONAL EXCELLENCE200250,3003504004505005
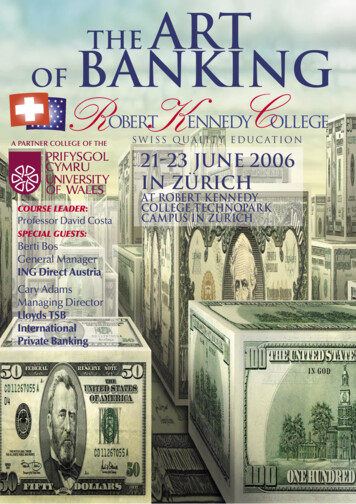
Texas Department of Banking 2021Constructs Over TimeOne of the benefits of continuing to participate inthe survey is that over time data shows howemployees' views have changed as a result ofimplementing efforts suggested by previous surveyresults.Positive changes indicate that employees perceivethe issue as having improved since the previoussurvey.Negative changes indicate that the employeesperceive that the issue has worsened since theprevious survey. Negative changes of greater than40 points and having 8 or more negative constructchanges should be a source of concern for theorganization and should be discussed withemployees and organizaitonal leadership.Has ChangeOccured?Variation in scores from year to year isnormal, even when nothing has changed.Analyzing trend data requires a bringingpatterns into focus, digging deeper intodata, and asking questions about issuessurrounding the workplace.Pay close attention to changes of morethan 15 points in either direction. Werethere any new policies or organizationalchanges that might have affected thescores? Were these areas a point offocus for your change initiatives?Constructs Scores Over mmunity12Information Systems26Internal Communication14Pay-24Benefits-9Employee Development-1Job Satisfaction0Employee Engagement7-40-30EMPLOYEE ENGAGEMENTINSTITUTE FOR ORGANIZATIONAL EXCELLENCE-20-100102030406
Texas Department of Banking 2021Areas of Strength and ConcernAreas of StrengthStrategicScore: 431The strategic construct captures employees’ perceptions of their role in theorganization and the organization’s mission, vision, and strategic plan. Higher scoressuggest that employees understand their role in the organization and consider theorganization’s reputation to be positive.WorkplaceScore: 431The workplace construct captures employees’ perceptions of the total workatmosphere, the degree to which they consider it safe, and the overall feel. Higherscores suggest that employees see the setting as satisfactory, safe and that adequatetools and resources are available.Employee EngagementScore: 421The employee engagement construct captures the degree to which employees arewilling to go above and beyond, feel committed to the organization and are presentwhile working. Higher scores suggest that employees feel their ideas count, their workimpacts the organization and their well-being and development are valued.Areas of ConcernPayScore: 334The pay construct captures employees’ perceptions about how well thecompensation package offered by the organization holds up when compared tosimilar jobs in other organizations. Lower scores suggest that pay is a centralconcern or reason for discontent and is not comparable to similar organizations.BenefitsScore: 405The benefits construct captures employees’ perceptions about how the benefitspackage compares to packages at similar organizations and how flexible it is.Lower scores suggest that employees perceive benefits as less than needed orunfair in comparison to similar jobs in the community.Employee DevelopmentScore: 407The employee development construct captures employees’ perceptions aboutthe priority given to their personal and job growth needs. Lower scores suggestthat employees feel stymied in their education and growth in job competence.0EMPLOYEE ENGAGEMENTINSTITUTE -() ORGANIZATIONAL EXCELLENCE7
Texas Department of Banking 2021ClimateThe climate in which employees work does, to a large extent, determine the efficiency andeffectiveness of an organization. The appropriate climate is a combination of a safe, nonharassing environment with ethical abiding employees who treat each other with fairness andrespect. Moreover, it is an organization with proactive management that communicates and hasthe capability to make thoughtful decisions. Below are the percentages of employees whomarked disagree or strongly disagree for each of the 6 climate items.9.3%3.3%believe the information from thissurvey will go unused.feel there aren't enough opportunitiesto give supervisor feedback.Conducting the survey createsmomentum and interest inorganizational improvement, so it'scritical that leadership acts upon thedata and keeps employees informedof changes as they occur.Leadership skills should be evaluatedand sharpened on a regular basis.Consider implementing 360 DegreeLeadership Evaluations sosupervisors can get feedback fromtheir boss, peers, and direct reports.3.3%2.0%feel workplace harassment is notadequately addressed.feel that upper management shouldcommunicate better.While no amount of harassment isdesirable within an organization,percentages above 5% would benefitfrom a serious look at workplaceculture and the policies for dealingwith harassment.Upper management should makeefforts to be visible and accessible,as well as utilize intranet/internetsites, email, and social media asappropriate to keep employeesinformed.0.7%0.7%feel they are not treated fairly in theworkplace.feel there are issues with ethics inthe workplace.Favoritism can negatively affectmorale and cause resentment amongemployees. When possible, ensureresponsibilities and opportunities arebeing shared evenly andappropriately.An ethical climate is the foundation ofbuilding trust within an organization.Reinforce the importance of ethicalbehavior to employees, and ensurethere are appropriate channels tohandle ethical violations.EMPLOYEE ENGAGEMENTINSTITUTE FOR ORGANIZATIONAL EXCELLENCE8
Texas Department of Banking 2021FOCUS FORWARD After the survey data has been compiled, the results are reru med appro:K11 mately one to two months afterdata collection stops. Survey results are pFovided in several[ formats to provide maximum flexibilirty ininterpretii ng ·t he data and sharing the data with the entire organiz.ation. The quick turnaro.u ind in reportii ngallows for immediate ac:tio upon the results whHe they are still current.Survey Results ReceivedJAN2022ecutive Summaries, Da.ta.R:eports. and Excel data areprovided for the organizationas a whole and for breakoutcategories. Any of t: ese fom,atscan be used alone or incombi natiion to create richi1n format" on on whichemployees can base their ideasforchamiae.FEB2022intemal comparisons.PowerPoint presentationspmv,iding data along withillustrations perti1nent to theoi-ga.n iizationc Have employeesparticipate in srnal work unitgroups to review reports as theyare distributed.APR2022Move Forward with ChangeHave t he Change Team compilethe priority change topics andOCT2023Foe sFurther data.breakdowns andcustom reports are available.We also offer leadershipassessments, employee pulseand exit surveys, an.d oustomersatisfact!ion surveys. Consultationt!ime for presentations and focusgroups is avaHable as wellPlease contact us at any time"AUG2022Employee Engagement again todocument the effectiveness ofyour change efforts.e?. ·Desijgnate the Change Teamcomposed of a diagonal sUtceacross the organization thatwm guide he effort ReVii ewJUN2022employees informed o f changes.ResurveyEngage Employees in C angethe organization's strengthsand brainstorm on now to bestaddress weaknesses. Provideemployees wit:lil ommentcards to express their ideas.action points. and present themto the executive staff. Discussthe administrative protocols forimplementing the changes.Determine the plan of action, seta reasonable timeline, and keepAdminister the Survey ofReview the data and summarieswith the executive staff. anddevelop a plan tor circullati.--gthe data to all employees.Several types of benchmarkscore-s provide irelevant externalcomparison::., and breakdowncategories can be used to makeMAR2022Share with All EmployeesShare results by creatingreports, newsletters, orReview Survey DataEMPLOYEE ENGAGEMENTINSTITUTE FOR ORGANIZATIONAL EXCELLENCESharpen Yourwww.survey;utexas.edu9
Texas Department of Banking 2021Demographic ItemsSurvey respondent information reports the response rate and frequency information for alldemographic variables that were asked of participants. Response Rate is a good indicator ofemployees' willingness to engage in efforts to improve the organization. Scope of Participation isa gauge to see whether or not employees by demographic characteristics participated in thesurvey.Response RateYour response rate is the percentage of surveys distributed divided by the number of validsurveys received. For category reports, we only report the response rate for the organization asa whole.What is a good response rate?If your organization sampled employees, the answer must take into consideration size, samplingstrategy, variance, and error tolerance. When all employees are surveyed (census), a generalrule for organizations of at least 500, is that a 30% rate is a low, but an acceptable level ofresponse. In general, response rates of greater than 50% (regardless of number of employees)indicate a strong level of participation.What about non-respondents?First, you should review the scope of participation discussed in the following paragraph. Second,you need to ascertain whether or not a more focused effort is needed to determine why somegroups did not respond.Scope of ParticipationRespondent information is used as a gauge of the scope of participation. For example, thepercentages of male and female respondents should roughly mirror your organization's gendercomposition. This should be true for the other demographic categories. If not, consider whetheror not additional efforts need to be made to engage those low participating categories. It isimportant to note the following: 0If less than five respondents selected a demographic variable, "Less Than Five" and "NotAvailable" is reported to protect the respondents' anonymity.Participants have the option to skip items or select prefer not to answer. Both of these nonresponses are combined to give a total "Prefer not to answer" count.EMPLOYEE ENGAGEMENTINSTITUTE FOR ORGANIZATIONAL EXCELLENCEA1
Texas Department of Banking 2021Demographic ItemsTotal Respondents: 151Surveys Distributed: 166Response Rate: 90.96%Numberof SurveyRespondentsPercentof SurveyRespondentsLess than 5Less than 58Less than 59826Less than 511Not AvailableNot Available5.30%Not Available64.90%17.22%Not Available7.28%Female :Male :Prefer not to answer :4988932.45%58.28%5.96%Prefer to self-describe:Less than 5Not AvailableLess than 20,001 : 20,001 to 30,000 :Less than 5Less than 5Not AvailableNot Available 30,001 to 40,000 : 40,001 to 50,000 : 50,001 to 60,000 : 60,001 to 70,000 : 70,001 to 80,000 : 80,001 to 90,000 :More than 90,000 :Less than 55152310763Not Available3.31%9.93%15.23%6.62%4.64%41.72%Prefer not to answer:2617.22%Full-time :Part-time :Prefer not to answer:141Less than 5993.38%Not Available5.96%My highest education levelDid not earn high school diploma or equivalent:High school diploma or equivalent:Some college:Associate's Degree:Bachelor's Degree:Master's Degree:Doctoral Degree:Prefer not to answer:I amMy annual salary (before taxes)I work0EMPLOYEE ENGAGEMENTINSTITUTE FOR ORGANIZATIONAL EXCELLENCEA2
Texas Department of Banking 2021Demographic ItemsTotal Respondents: 151Surveys Distributed: 166Response Rate: 90.96%Numberof SurveyRespondentsPercentof SurveyRespondents16-29:30-39:40-49:50-59:60 :Prefer not to 9.87%Less than 23%11.92%16 :Prefer not to answer:371924.50%12.58%Yes:3422.52%No:Prefer not to answer:902759.60%17.88%My race/ethnic identification (Check all that apply)African American or Black:White:81105.30%72.85%Less than 5Less than 523Less than 5Not AvailableNot Available15.23%Not AvailableYes:2113.91%No:Prefer not to answer:1131774.83%11.26%My age (in years)Years of service with this organizationAre you of Hispanic, Latino/a/x, or of Spanish origin?Asian:Native American or Pacific Islander:Prefer not to answer:Prefer to self-describe:I am currently in a supervisory role.0EMPLOYEE ENGAGEMENTINSTITUTE FOR ORGANIZATIONAL EXCELLENCEA3
Texas Department of Banking 2021Demographic ItemsTotal Respondents: 151Surveys Distributed: 166Response Rate: 90.96%Numberof SurveyRespondentsPercentof 68%39.74%12.58%Yes:12482.12%No:Prefer not to er not to answer:1912.58%None of the time :Some of the time :10376.62%24.50%Most of the time :All the time :Prefer not to answer:6135840.40%23.18%5.30%I received a promotion during the past two years.Yes:No:Prefer not to answer:I received a merit increase during the past two years.Yes:No:Prefer not to answer:I plan to be working for this organization in one year.I am eligible for retirement within the next two years.I currently remote work0EMPLOYEE ENGAGEMENTINSTITUTE FOR ORGANIZATIONAL EXCELLENCEA4
Texas Department of Banking 2021Primary ItemsFor the primary items (numbered 1-48), participants were asked to indicate how they agreed witheach positively phrased statement. If participants did not have information or the item did notapply, they were to select don't know/not applicable.Each primary item is returned with the item text and two types of reported numerical data,response data and benchmark data. The following definitions correspond to survey items:Response Data Score is calculated by averaging all item responses on a five point scale ranging from5 Strongly Agree to 1 Strongly Disagree. If the participant selected Don't Know/NotApplicable, their response is considered a valid response, but it is not used in thecalculation of the score.Standard Deviation calculates the level of agreement. Large deviations indicate greaterlevels of disagreement. For this report, you can expect standard deviations to be between.7 and 1.10.Total Respondents is the number of valid responses including Don't Know/Not Applicable.If everyone did not answer every item, the number of respondents for an item is less thanthe number of respondents reported in your response rate.Respondents is the number of participants who selected each item (strongly agree, agree,etc.).Percentage is the number of participants who selected each item (strongly agree, agree,etc.) divided by the total number of valid responses.Percent Agreement is the number of participants who agreed with the item (stronglyagree or agree) divided by the total number of valid responses.Benchmark Data Past Score is your organization's score reported from the previous iteration, if available.Similar Mission is the average score from organizations that share a similar mission toyour organization.Similar Size is the average score from organizations that are a similar size to yourorganization.All Organizations is the average score from all organizations.Organizational Categories are benchmarked against the organization as a whole.Interpreting DataAny interpretation of data must be done in context of the organizational setting andenvironmental factors impacting the organization. Regardless of the averages, scores range fromareas of strength to areas of concern. In general, most scores are between 3.00 and 4.00.Scores below a 3.25 are of concern because they indicate general dissatisfaction. Scores above3.75 indicate positive perceptions. When available, over time data provides previous scores fromand benchmark data comparative scores. In general (because various factors and statistical testwould be needed to confirm), scores that have changed or differ by .2 may be significant.0EMPLOYEE ENGAGEMENTINSTITUTE FOR ORGANIZATIONAL EXCELLENCEB1
Texas Department of Banking 2021Primary Items. 95% Agreement1. My work group cooperates to get the job done. 95% AgreementStronglyStronglyDon'tResponse: Agree Agree Neutral Disagree Disagree Know/NARespondents:75683212 l: I 11 ::::::l: I :l: I ::::::1:::::::1 :l: I1.32% :Percentage:.II 49.67% II 45.03%II 1.99%II 1.32% II 0.66% I. I . w2. In my work group, my opinions and ideas count.90% Agreement-II 57 II 79 II 9 II 4 II 0 II 2Percentage: 37.75% 52.32% 5.96% 2.65%IIIIII IIII 0.00% II 1.32%Respondents:3. My work group regularly uses performance data to improve thequality of our work.64% AgreementStronglyResponse: Agree AgreeStronglyDon'tNeutral Disagree Disagree Know/NARespondents:3363338111 1:::::::1 :l: I II ::::::1:::::::1 :l: I ::II:: Percentage: 22.15% 42.28% 22.15% 5.37%0.67%7.38%. .I. IIIIII11. .II. .4. In my work group, there is a real feeling of teamwork.89% Agreement-Respondents:557913211 l I 11 1 1 l: I l I l I Percentage:0.66%.II 36.42% II 52.32%II 8.61%II 1.32% II 0.66% I. I .EMPLOYEE ENGAGEMENTINSTITUTE FOR ORGANIZATIONAL EXCELLENCETotal Respondents:151BENCHMARKSPast Score:4.46Similar Mission:Similar Size:4.364.34All Orgs:4.32SCORE:Std. Dev.:4.270.69Total Respondents:BENCHMARKSPast Score:151Similar Mission:Similar Size:All Orgs:4.174.104.094.2564% AgreementSCORE:3.86Std. Dev.:Total Respondents:BENCHMARKSPast Score:0.87149Similar Mission:Similar Size:All Orgs:3.793.653.703.6589% AgreementStronglyStronglyDon'tResponse: Agree Agree Neutral Disagree Disagree Know/NA04.440.6790% AgreementStronglyStronglyDon'tResponse: Agree Agree Neutral Disagree Disagree Know/NA wSCORE:Std. Dev.:SCORE:Std. Dev.:Total Respondents:BENCHMARKSPast Score:Similar Mission:Similar Size:All Orgs:4.230.721514.184.013.973.99B2
Texas Department of Banking 2021Primary Items95% Agreement5. Our organization is known for the quality of work we provide. 95% AgreementStronglyStronglyDon'tResponse: Agree Agree Neutral Disagree Disagree Know/NAIRespondents:II 81 II 61 II 7 II 0I Percentage:II 54.00% II 40.67%II 4.67%II 0.00% ,111100.00%I0.67% I1I97% AgreementStronglyStronglyDon'tResponse: Agree Agree Neutral Disagree Disagree Know/NA ,1111010.00%0.66%7. My organization develops services to match the needs of ourcustomers/clients.79% AgreementStronglyResponse: Agree AgreeRespondents:4079StronglyDon'tNeutral Disagree Disagree Know/NA18Percentage: 26.49% 52.32% 11.92%31101.99%0.66%6.62%8. Our organization communicates effectively with the public.-83% AgreementStronglyResponse: Agree AgreeIRespondents:II 42 II 83I Percentage:II 27.81% II 54.97%AVStronglyDon'tNeutral Disagree Disagree Know/NA17311.26%1.99%EMPLOYEE ENGAGEM! :TIONAL EXCELLENCEINSTITUTE FOR ORGAII 6 I0.00% II 3.97% I04.500.59Total Respondents:150BENCHMARKSPast Score:4.49Similar Mission:Similar Size:4.114.15All Orgs:4.1097% Agreement6. I know how my work impacts others in the organization.IRespondents:II 75 II 71 II 4 II 0I Percentage:II 49.67% II 47.02%II 2.65%II 0.00%SCORE:Std. Dev.:SCORE:Std. Dev.:4.470.55Total Respondents:BENCHMARKSPast Score:151Similar Mission:Similar Size:All Orgs:4.364.354.334.3279% AgreementSCORE:4.09Std. Dev.:Total
Texas Department of Banking Executive Summary 2021 REPORT ID: 451. EMPLOYEE ENGAGEMENT INSTITUTE FOR ORGANIZATIONAL EXCELLENCE Texas Department of Banking 2021 . The University of Texas at Austin orgexcel@utexas.edu 1925 San Jacinto Blvd., D3500 Phone (512) 471-9831 Austin, Texas 78712 Fax (512) 471-9600 0 .