Transcription
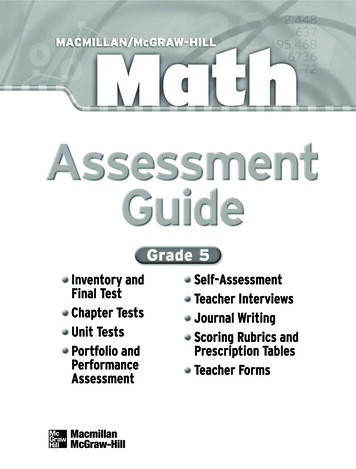
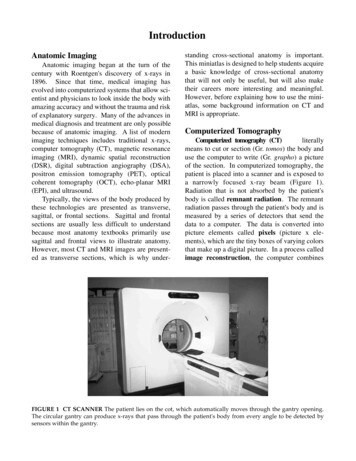
IntroductionAnatomic ImagingAnatomic imaging began at the turn of thecentury with Roentgen's discovery of x-rays in1896. Since that time, medical imaging hasevolved into computerized systems that allow scientist and physicians to look inside the body withamazing accuracy and without the trauma and riskof explanatory surgery. Many of the advances inmedical diagnosis and treatment are only possiblebecause of anatomic imaging. A list of modernimaging techniques includes traditional x-rays,computer tomography (CT), magnetic resonanceimaging (MRI), dynamic spatial reconstruction(DSR), digital subtraction angiography (DSA),positron emission tomography (PET), opticalcoherent tomography (OCT), echo-planar MRI(EPI), and ultrasound.Typically, the views of the body produced bythese technologies are presented as transverse,sagittal, or frontal sections. Sagittal and frontalsections are usually less difficult to understandbecause most anatomy textbooks primarily usesagittal and frontal views to illustrate anatomy.However, most CT and MRI images are presented as transverse sections, which is why under-standing cross-sectional anatomy is important.This miniatlas is designed to help students acquirea basic knowledge of cross-sectional anatomythat will not only be useful, but will also maketheir careers more interesting and meaningful.However, before explaining how to use the miniatlas, some background information on CT andMRI is appropriate.Computerized TomographyComputerized tomography (CT)literallymeans to cut or section (Gr. tomos) the body anduse the computer to write (Gr. grapho) a pictureof the section. In computerized tomography, thepatient is placed into a scanner and is exposed toa narrowly focused x-ray beam (Figure 1).Radiation that is not absorbed by the patient'sbody is called remnant radiation. The remnantradiation passes through the patient's body and ismeasured by a series of detectors that send thedata to a computer. The data is converted intopicture elements called pixels (picture x elements), which are the tiny boxes of varying colorsthat make up a digital picture. In a process calledimage reconstruction, the computer combinesFIGURE 1 CT SCANNER The patient lies on the cot, which automatically moves through the gantry opening.The circular gantry can produce x-rays that pass through the patient's body from every angle to be detected bysensors within the gantry.
2the pixels to form an image. Each image is like asingle slice from a loaf of bread. After eachimage is made, the patient is moved slightly andanother image is taken, producing additionalslices through the body.On the average, it takes over 262,000 pixels toform a single CT image, which is like a complexmosaic formed by arranging and connectingtogether small pieces of glass or stone. The computer can arrange the pixels to form transverse,sagittal, or frontal images of the body.The amount of radiation absorbed by differenttissues determines the appearance of the tissues inCT images. The denser the tissue, the greater isthe amount of radiation absorbed by the tissue.Consequently, less remnant radiation passesthrough denser tissues than through less dense tissues. The computer uses the amount of remnantradiation that is detected by the sensors as a basisfor coloring the tissues. Dense tissues, such asbone, appear white. Air, which is not dense compared to tissues, is easily penetrated by x-rays andappears black. Thus, air-filled structures, such asthe lungs, appear black. Fat, muscle, and organsthat fall between the densities of bone and airappear as varying shades of gray (Table 1).In order to better see certain hollow organs,such as blood vessels, a contrast medium can beplaced in the organ. A contrast medium is adense liquid that prevents the passage of remnantradiation and appears white in a CT image (seeTable 1). The size and shape of hollow organs canbe determined in CT images because a liquid contrast medium assumes the shape of the organs it iscontained within. For example, iodinated contrast medium is injected into blood vessels, theurinary bladder, or ureters, and barium sulfate isgiven orally or rectally to enhance the gastrointestinal tract.The newest generation of CT scanners areTABLE 1 APPEARANCE OF DIFFERENT TISSUES IN CT AND MRI IMAGESTissueCT ImageWhiteT1 MRI ImageBlackT2 MRI ImagesBlackBoneMuscleGrayGrayDark grayBrainWhite matterGray matterDark grayGrayGrayDark grayDark grayGrayFatDark grayto blackWhiteGrayCerebrospinal fluid eContrast mediaWhiteWhiteNot usedAir-filled structures such asthe lungs, stomach, and colonBlackBlackBlackBloodFlowingNonflowing*Only if iodinated contrast media is present; otherwise appears gray.
3able to produce an image so fast that physiological motions, such as respiratory or cardiac movements, do not blur the image. For this reason, CTis used for studies of the chest, abdomen, pelvis,and soft tissues of the neck.Magnetic Resonance ImagingTo make a magnetic resonance image(MRI), the patient is placed into a scanner thatproduces a very powerful magnetic field, whichaffects the nuclei of the atoms in the patient'sbody. Many atomic nuclei, including the protonsthat form the nuclei of hydrogen atoms, rotate orspin about, much like tiny tops or gyroscopes.Because a moving charge creates a magnetic fieldaround itself, the hydrogen protons are like littlebar magnets. Normally, the "axes" of the hydrogen proton "magnets" are oriented in many different directions. The magnetic field produced bythe scanner causes the hydrogen protons in thepatient's body to align in the same direction, inmuch the same way that the needle of a compassaligns with the magnetic north pole.After the protons are aligned, a radiofrequency (RF) pulse is used to establish a secondmagnetic field that is typically at a ninety degreeangle to the first magnetic field. The second magnetic field causes the hydrogen protons to "tipover" in relation to the first magnetic field. Theenergy in the RF pulse also raises the energy levelof the hydrogen protons. When the RF signal isturned off, the hydrogen protons are said to relax,which means they realign with the first magneticfield. As they relax, the hydrogen protons releasethe energy acquired from the RF pulse and returnto their previous lower energy level by giving offenergy that can be detected by sensors in the scanner. As with CT technology, the data collected bythe sensors is used to form pixels, and throughimage reconstruction, the computer can formtransverse, sagittal, or frontal sections of thepatient's body.The process just described is called magneticresonance imaging because it requires magneticfields and the resonance of the hydrogen protons.To use an analogy, each hydrogen proton is like atuning fork. When energy is applied to a tuningfork by striking the tuning fork, it releases theenergy by producing sound waves. If many tuning forks that can produce the same sound wavesare struck at the same time, then they all vibratetogether at the same sound frequency and are saidto be in resonance. When the RF pulse is appliedto the hydrogen protons, they are all excited to thesame higher energy level and are in resonance.When the RF pulse ends, the hydrogen protons release an energy signal as they realign withthe first magnetic field. The time required for theexcited hydrogen protons to realign with the firstmagnetic field is called the relaxation time. Thereturn to the unexcited state exhibits two relaxation times called T1 and T2. The energy signalreleased from the hydrogen protons during thefirst second is T1, and the signal after one secondis T2. The signals received by the computer forT1 and T2 are used to create different shades ofgray for different types of tissues (see Table 1).Magnetic resonance imaging detects the presence of hydrogen protons, and not other atoms,because the RF pulse used causes the resonanceof only hydrogen protons. The nuclei of otheratoms have different resonance frequencies, muchlike different tuning forks produced differentsounds. The use of hydrogen protons in MRI isnot by accident. Over 75 percent of the humanbody is water and each water molecule containstwo hydrogen protons. In addition, many organicmolecules such as carbohydrates, lipids, and proteins contain abundant hydrogen. The number ofhydrogen protons in a tissue, and the relationshipof the hydrogen protons to surrounding atoms,determines the different energy signals recordedfor different tissues when the hydrogen protonsrelax.General Features of the MiniatlasThe miniatlas consists of 25 photographs oftransverse sections through a cadaver. The number of sections has been kept to the minimum necessary to show major anatomical features. Thelevel of each section is indicated in a level orientation figure, and a numbered key is used to identify structures on each photograph. A systemic
4description of the features of each cadaver sectionis also provided. In addition, there are CT andMRI pictures that match as closely as possible thecadaver sections. Any structures seen in a CT orMRI, but not seen in a cadaver section, are brieflydescribed. At the end of the atlas there are CT andMRI pictures that illustrate the use of these technologies for detecting pathologies.How to Use The MiniatlasIn typical undergraduate anatomy courses, thebody is studied from a systemic approach. A system is a group of structures that have one or morecommon functions. Examples are the digestive,circulatory, nervous, respiratory, and skeletal systems.Most cross-sectional anatomy atlases assumethat the reader already knows the parts of eachsystem, and understands the three-dimensionalrelationship of the parts within a system to eachother. Therefore, when a section is made throughthe body, the emphasis is on the relationshipbetween the parts of different systems within thatparticular section. However, without an understanding of the systems, this approach is quiteconfusing to beginning students.This miniatlas of human cross-sectionalanatomy is designed to be used at the same timethat the systems are being learned. The parts ofeach system are described by system in a SystemicDescriptions section. Thus, it is possible to concentrate on one system at a time. Furthermore,the parts of a system seen at one level are relatedto the parts seen in sections at other levels. Forexample, starting with a section through the oralcavity, the systemic description section describesthe parts of the digestive system seen at this level,such as the tongue and the parotid salivary glands.In succeeding sections, the systemic descriptionfor the digestive system describes the new structures encountered and their relationship to othersections. Thus, the oral cavity joins the pharynx(throat), which is connected by the esophagus tothe stomach.In order to effectively present a systemicapproach, more than a verbal description is needed. High quality photographs and illustrations ofeach system from a sagittal or frontal view arealso required, because they show the superior toinferior relationships between the parts of a system. To assist with understanding head and neckanatomy, a sagittal and frontal view of the headand neck are presented on pages 6 and 7 of thisintroduction. Additional illustrations and photographs are provided in the third edition ofAnatomy and Physiology by Seeley, Stephens,and Tate (SST).The recommended procedure for using theminiatlas is to read and understand the anatomy ofa system using an introductory anatomy and physiology text. In the systemic descriptions in theminiatlas, the parts of a system are followed bynumbers, which indicate the location of the partson the cadaver section. In addition, it may be useful to refer to an introductory anatomy and physiology text to see the structures from a frontal orsagittal view. For example, Figure 2 refers to asagittal view of the brain in Anatomy andPhysiology by Seeley, Stephens, and Tate.Next, relate what is seen in the frontal orsagittal view to what is seen in the transversecadaver section. The approximate location of thecut on the frontal or sagittal section can be determined by using the level orientation diagram provided for each section and by noting what partsare cut in the cadaver section. For example, theorientation diagram for Section 1 indicates a cutthrough the superior part of the braincase, and thesystemic description for the nervous systemdescribes a cut through the cerebrum, corpus callosum, and lateral ventricles. The location of thecut is shown as a black line in Figure 2.A ruler was used to draw the location of thecut on the illustration. You may want to straighten out a paper clip and lay it on the illustration atthe location of the cut. Thoughtful considerationof the cross-sections in the miniatlas and the illustrations in the textbook will result in a threedimensional understanding of each system.Although this atlas can be used to study onlyone system at a time, as you study a particularsystem you probably will note some features ofthe other systems. For example, you probablywill already have studied the skeletal system
5before you study the nervous system. Examinethe cross-sections and identify the bones and partsof bones because they are easily seen. Then, asyou study additional systems, use the bones as"landmarks" to guide you through the sections. Inaddition, begin to relate the parts of one system toanother. For example, while studying the digestive system you might note that the esophagus isposterior to the trachea and anterior to thedescending aorta.After you understand a system on the cadaversections, take some time to examine the CT andMRI images. These technologies produce amazingly good pictures of the inside of the body, andwith your new knowledge of cross-sectionalanatomy, you will be able to identify the majorparts of the body. Also examine the CT and MRIsections at the end of the atlas to discover howthey can reveal pathologies within the humanbody.FIGURE 2 SAGITTAL VIEW OF THE BRAIN Taken frm Anatomy and Physiology by Seeley, Stephens, andTate. The black line indicates the level of Cadaver Section 1.
6FIGURE 3 SAGITTAL SECTION OF THE HEAD Reprinted with permission from England, M.A. andWakely, J. 1991. Color Atlas of the Brain and Spinal Cord.1.2.3.4.5.6.7.8.AtlasAxisBase of occipital boneBody of sphenoid boneCerebellumLeft cerebral hemisphereCervical vertebraeCorpus callosum9.10.11.12.13.14.15.Posterior ridge of the sellaturcicaFalx cerebriForamen magnumFourth ventriclePituitary glandSella turcicaHypothalamus16.17.18.19.20.21.22.23.Medulla oblongataMidbrainNoseOral cavityOropharynxPonsSpinal cordThalamus
7FIGURE 4 FRONTAL SECTION OF THE HEAD AND NECK Posterior view showing the cerebrum and cerebellum surrounding the brainstem (midbrain, pons, and medulla oblongata). Reprinted with permission fromEngland, M.A. and Wakely, J. 1991. Color Atlas of the Brain and Spinal Cord.1.2.3.4.5.6.7.8.9.10.11.AtlasAxisCaudate nucleusCerebellumDura materEarFalx cerebriFirst cervical nerve rootGlossopharyngeal and vagusnerve rootsHippocampus (a cerebralgyrus)Internal rnal jugular veinLateral geniculate bodyLateral ventricleMedial geniculate bodyMIddle cerebellar pedunclePosterior neck musclesParietal lobePetrous part of temporal bonePonsPosterior cranial fossaSigmoid sinusSpinal cordAccessory nerve root25.26.27.28.29.30.31.32.33.34.35.Neck muscleSuperior sagittal sinusMidbrainPonsTemporal lobeTentorium cerebelliThalamusThird cervical vertebraeThird ventricleVertebral arteryVestibulocochlear nerve
standing cross-sectional anatomy is important. This miniatlas is designed to help students acquire a basic knowledge of cross-sectional anatomy that will not only be useful, but will also make their careers more interesting and meaningful. However, before explaining how to use the mini-atlas, some background information on CTand MRI is appropriate.