Transcription
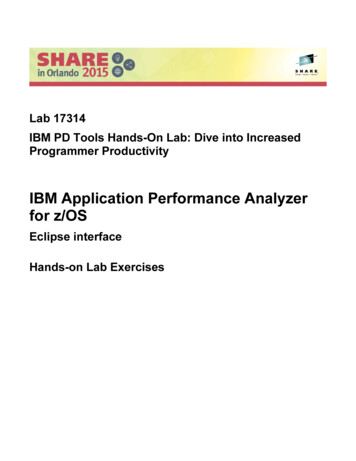
Lab 17314IBM PD Tools Hands-On Lab: Dive into IncreasedProgrammer ProductivityIBM Application Performance Analyzerfor z/OSEclipse interfaceHands-on Lab Exercises
IBM Application Performance Analyzer for z/OS V13Lab Exercises Copyright International Business Machines Corporation, 2015. All rights reserved.This document is intended for IBM internal use only. The contents of the document may be discussed withexisting and/or potential customers. The document itself, however, may not be distributed outside ofIBM.
ContentsPage2OverviewLab 1:Getting started with the Application Performance Analyzer perspectiveLab 2:Analyzing the performance of an application511Page 1IBM Application Performance Analyzer for z/OS lab exercises
OverviewApplication Performance AnalyzerIBM Application Performance Analyzer for z/OS is a tool that helps you perform applicationperformance tuning for applications running on z/OS systems.Application performance tuning is the process of minimizing the amount of time and system resourcesthat your application uses when it run. By system resources, it is typically referring to CPU time, and IOoperations (such as reading and writing to files or databases).When should you perform application performance tuning?Most often, you will do application tuning when you have noticed a problem. For example, onlinetransactions are running too long, and users are complaining about long response times. Or maybe a batchjob that runs every day starts to run longer than usual, and does not complete in its scheduled timewindow.It is probably most typical to do application performance tuning when you notice that productionapplications have problems, that is slow response times or batch jobs running too long. And the focus ofthe tuning effort should be to fix performance bottlenecks.But it can also be advantageous to do performance tuning earlier in the application life cycle, duringsystem testing. At this stage, you might be able to identify potential problems before they get toproduction. You can ensure that new applications meet your performance goals, and that changes that youhave made will not have an adverse performance impact.So who does performance tuning? There might be a lot of people who have roles in the application tuningprocess. And each can have a different perspective on the problem. An application developer might bemore focused on the performance of a single application, or a set of applications. He or she might beinterested in questions like, “Will a change make the program run slower?”. A Database Administratormight approach the issue from the perspective of how the database management system performs, andmight be more interested in questions like “Can the database performance be improved?”. And a systemsprogrammer might approach it from the perspective of the entire system, rather than individualapplications, and might have interest in questions such as “Why is the entire system running slowly?”. Asthis chart implies, all of these people have overlapping interests. Questions like “Can the application bechanged to run faster?” and “Can the job be changed to use less CPU and I/O” can be of interest to all.This is often best resolved through a collaborative effort.APA’s focus is on the application tuning process. There are other monitors, Omegamon for example, thatare designed to provide information across multiple applications or for an entire system. APA is designedto help you understand the detailed performance characteristics of a single application.Some of the main features of Application Performance Analyzer are: APA can collect detailed performance information about an application while it runs. After it hasobserved an application running, it processes the collected information, and presents it informatted displays and reports. Most people use APA by accessing it through its online interfacefrom TSO. How does APA help you tune your application? The most important thing that APA does is tohelp you answer the question: “Where is the application spending its time?” For example, is itspending most of its time, using CPU cycles, reading or writing to files, or waiting on otherPage 2IBM Application Performance Analyzer for z/OS lab exercises
resources. And specifically, which programs or modules are causing the CPU or wait time. Basedon the answer, you are better equipped to answer the question: “Can a change be made to theapplication or the system to make it run faster?”Here is how it works. First, you request an observation session. The easiest way to do it is to usethe online interface to tell APA to monitor your application while it runs. You can either monitoran application that is running right now, or schedule an observation session or sessions at sometime in the future. During an observation session, APA collects performance information while theapplication runs, and stores the data in one or more measurement data sets. The observationrequest itself is stored in a file called the checkpoint file.APA collects performance information using a sampling technique. When APA’s observationsession begins, it takes one sample. That means that APA takes something like a snapshot of whatthe application is doing at one moment in time. It determines whether the application is activelyusing the processor or waiting for system resources, and it gets detailed information about theprogram, and even the instruction that is either using CPU time or waiting. APA retains thedetailed information for that sample, and then waits for a fixed interval of time. Then it takesanother sample, to find out what the application is doing at that moment, and collects information.For example, in this chart during the first two samples, the application was executing instructionsin program A. During the third sample, it was executing instructions in a system module. Duringthe next three samples, it was waiting for an I/O operation to complete. At any point in time, anapplication can only be in one of three states. It can be executing instructions in a program, whichmeans it is using CPU time. It can be waiting for a system resource, such as for a file I/Ooperation to complete. Or, it can be waiting because the system CPU is busy servicing otherprocesses. Over time, APA will collect a statistically significant set of samples. And whenaggregated, it gives you detailed information about where the application spends most of its time.When you are using a monitor to collect performance information about an application, there issometimes a concern about how much overhead the monitor has. First, be aware that APA runs inits own address space, so most of APA’s processing does not increase the resource usage of theapplication being monitored. Of course, APA does use some CPU cycles to do its work, althoughmost typically it will have no measurable impact on the application. However, APA reportsexactly how much CPU time it uses. System overhead from a single APA session is typicallyinsignificant and does not skew measurement statistics. But if it is still a concern, you can controlAPA’s sampling rate.After an APA observation session has completed, the information is presented to you usinganalysis reports. You can view and print these reports. Most people view the reports directly usingthe APA online interface in TSO. Or you can print reports to SYSOUT, or even generate PDF filesthat you can download to your workstation and print from there. APA generates its reports byaggregating data from the measurement data sets. Sample file data can also be written to a file inXML format and viewed in an XML reader.You can view a wide range of performance reports. Here are just a few. There are reports thatdescribe CPU usage, and these reports are broken down by program or module, and you can evendrill right down to the program statements that use the most CPU time. There are similar reportsfor wait time. Using these reports, you can identify which programs or modules caused the mostwait time, and drill right down to the program statements. For DB2 applications, there are reportscontaining various metrics, broken down by SQL statement, by the plan, by the thread, and so on.For CICS applications, the information is broken down by transaction, by task, by program, andPage 3IBM Application Performance Analyzer for z/OS lab exercises
much more. For IMS applications, there are reports broken down by CPU time and by call servicetime. And there are reports that provide information about disk usage and storage.One of the best features of APA is that you can drill down to program statement level, to identifyexactly which statements caused the most CPU time and wait time. APA can perform this sourcemapping for the programs using the IBM compilers that is indicated on the slide. They includeCOBOL, PLI, C, C , Java, and Assembler. To enable source mapping in APA, sourceinformation must be saved when your programs are compiled. Depending on the compiler, sourceinformation can be saved in the form of compiler listings, SYSDEBUG files, LANGX files, orassembler ADATA files.When you request an observation session, the entry is stored in the checkpoint file. The checkpointentry contains information about the session, and is updated as the session starts, and completes.In a SYSPLEX environment, the checkpoint file can be on shared DASD. That way, you canrequest an observation session from one LPAR for an application that is running on anotherLPAR. Also, information in the checkpoint file is retained across IPLs. So you can request anobservation session to run at some future time, and the request is retained even if the system isIPLed.Sampling data from observation sessions are stored in measurement data sets. Measurement datasets are allocated automatically by APA when an observation session starts. The names of the filesare controlled by the person who installs APA. If you delete an observation session, themeasurement data sets are also deleted automatically.This workbookThis workbook contains instructions for lab exercises that are designed to give you hands-on experiencefor the eclipse interface of IBM Application Performance Analyzer for z/OS.ReferenceProduct manuals and other information about IBM Application Performance Analyzer for z/OS, and otherIBM problem determination tools, are available on the Web at tPage 4IBM Application Performance Analyzer for z/OS lab exercises
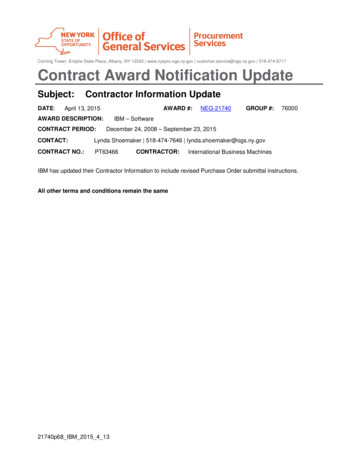
Lab Exercise 1Getting started with the Application Performance AnalyzerperspectiveIn this exercise you will: Open the Application Performance Analyzer perspective in the Eclipse workbench. See the simple process of downloading reports from the host. Learn how to display help information for Application Performance Analyzer. Map source listing to see the lines of code that are suspect to performance.1. Before you begin, you must have the Eclipse interface open on your workstation. If you aren’t sure how toopen it, please contact your instructor.In eclipse, a perspective is a set of views (windows), menus, and options that provide a set of functions. TheFile Manager interface is a perspective. Before you can use File Manager, you need to open it’s perspective.2. Opening the Application Performance Analyzer perspective.a. From the menu bar near the top of the eclipse workbench, select Window Open Perspective Application Performance Analyzer.i. Note: If “Application Performance Analyzer” is not shown as a selection, then the ApplicationPerformance Analyzer perspective is already open and you can proceed to the next step.Page 5IBM Application Performance Analyzer for z/OS lab exercises
The Application Performance Analyzer perspective is displayed. Note: the contents of the SystemsInformation view may be different or even blank on your system.RTclick3. Notice that ReqNum 0084 was highlighted and expanded then a right mouse click reveals a pop-up windowfor downloading reports to your workstation.4. You can display help information to assist with various features of Application Performance Analyzer.a. To open the help dialog, select Help Help Contents.b. The Help dialog is displayed. To expand the Application Performance Analyzer help topics, click theplus ( ) next to IBM Application Performance Analyzer for z/OS User’s Guide.Page 6IBM Application Performance Analyzer for z/OS lab exercises
Under IBM Application Performance Analyzer for z/OS User’s Guide, you can expand the UsingAPA section which covers several topics.c. You should now have a good understanding how to display general help information.d. Close the help dialog: click the X (close) icon in the upper right corner of the help window.Page 7IBM Application Performance Analyzer for z/OS lab exercises
5. You can also display a list of keyboard commands.a. In the eclipse workbench Select Help Key Assist.b. A list of keyboard commands is displayed.6. Note: As you work through the exercises, you may accidentally close or hide a view (a window) or otherparts of the Application Performance Analyzer perspective. Remember that if that happens, you can easilyreset the perspective to its default views. Try it now, so you know how to perform the reset: From the menu, select Window Reset perspective. The perspective is reset. The default views are displayed in their default positions and with theirdefault sizes.7. Now that the Application Performance Analyzer perspective is open, and you know where to find help, youare ready to start using Application Performance Analyzer in the following exercises.Page 8IBM Application Performance Analyzer for z/OS lab exercises
Note: In the next exercise you will be reviewing reports generated from a batch application. The APAobservation was set-up to start when a specific batch application appeared active in an initiator. Theobservation included all steps for one CPU minute and collected 10,000 samples. The GUI APA made arequest to the host to download all the reports to the workstation. Observations can be set-up for batch,online, etc. and can specify the rate of sampling, when to begin and on what step. Threshold observations canbe used too. The next lab will focus on the reports that are generated.You have completed this exercise.Page 9IBM Application Performance Analyzer for z/OS lab exercises
Lab Exercise 2Analyzing the performance of an applicationIn this exercise you will: See the CAZ0 report of reports which contain the following reporting areas:a. S - Statistics/Storageb. C - CPU Usage Analysisc. D - DASD I/O Analysisd. W - CPU WAIT Analysise. G - Coupling Facilityf. J – Java Measurement Each category can be drilled down into sub categories. You will see the program source mapping against the reports. The program source mapping will provide indictors for the category and the source the program spentthe most time in the lines highlighted.Introduction to Application Performance Analyzer ReportsOverview of reports.Overview of categories.Overview of source mapping and reporting.Page 10IBM Application Performance Analyzer for z/OS lab exercises
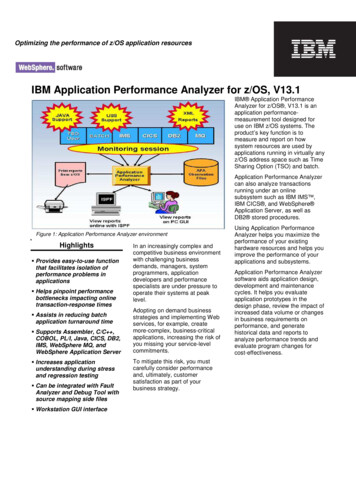
1. In the Systems Information Tab, under the z/OS system that you will use during this exercise, selectApplication Performance Analyzer for z/OS ESYSMVS CAZ02. Here’s an example of a typical APA Observations List (CAZ0) – Local. The notes below point out colorcoding and status states.Page 11IBM Application Performance Analyzer for z/OS lab exercises
3. We already set-up an observation in APA. Once the specific batch job runs, reports are available.a. We discussed how in the GUI APA you can download reports from the host. This is a typical pop-upscreen showing the progress of the download.b. The job we observed had multiple steps. Our concern is in step 8. Below, you can see the ReqNum is0084. The owner, jobname and date/time are also available. ReqNum 0092 is the multi-step reference.Page 12IBM Application Performance Analyzer for z/OS lab exercises
4. Details (0092) tab shows General observation information.5. Reports (0092) shows the breakdown of the report categories.Page 13IBM Application Performance Analyzer for z/OS lab exercises
6. Reports (0092) shows the breakdown of the report categories and sub-categories for Statistics/Storage.7. Reports (0092) shows the breakdown of the report categories and sub-categories for CPU Usage Analysis.Page 14IBM Application Performance Analyzer for z/OS lab exercises
8. Reports (0092) shows the breakdown of the report categories and sub-categories for DASD I/O Analysis.9. Reports (0092) shows the breakdown of the report categories and sub-categories for CPU WAIT Analysis.Page 15IBM Application Performance Analyzer for z/OS lab exercises
10. Reports (0092) shows the breakdown of the report categories and sub-categories for Coupling Facility.11. Reports (0092) shows the breakdown of the report categories and sub-categories for Java Measurement.Page 16IBM Application Performance Analyzer for z/OS lab exercises
12. Returning to the Statistics/Storage report categories and then clicking on the S01 report 13. The S01: Measurement Profile is displayed and, by the way, is a good place to start your analysis.a. In the upper right hand of the S01 report there is a full screen button. You can simply left mouse buttonclick the full screen and then use the page up/down buttons or the scrolling slide bar to navigate thereports. The blocks on the left side present the measurement information gathered and the blocks onthe right side contain a list of related reports. You can simply select a report and left mouse click it todrill down into the associated report. Let’s scroll all the way to the bottom of the S01 report to seewhat’s available and associated.b. The Overall CPU Activity gives you APA’s analysis of where the application spent time:i. CPU Active.ii. WAIT.iii. QUEUED.Page 17IBM Application Performance Analyzer for z/OS lab exercises
c. With the S01 report filling the screen, use the mouse to hold and scroll the page.d. Notice much of the time is in application modulesPage 18IBM Application Performance Analyzer for z/OS lab exercises
e. After scrolling, the complete section on CPU Modes is available.Page 19IBM Application Performance Analyzer for z/OS lab exercises
f. And the last page of the S01 report is displayed.Page 20IBM Application Performance Analyzer for z/OS lab exercises
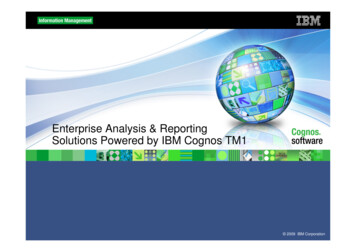
14. Open the W03 report and expand all the names with the “plus” icon. Right click the SAM1V CSECT.Then right click the Source Program Mapping.ExpandAll15. Source for the program is displayed on the W03 report now, showing which statements caused the most waittime.Page 21IBM Application Performance Analyzer for z/OS lab exercises
16. The C01 report and source mapping shows the statements that caused the most CPU consumption.17. C08 and source mapping provide referred attribution reporting.Page 22IBM Application Performance Analyzer for z/OS lab exercises
Tip: If Application Performance Analyzer has captured new abends since you opened a fault history file, youcan refresh it. In the Systems Information view, right-click the Fault History file and select Reload historyfile from host.18. You have completed this exercise.Page 23IBM Application Performance Analyzer for z/OS lab exercises
SummaryCongratulations, you have completed the exercises and have familiarized yourself with the ApplicationPerformance Analyzer eclipse interface.In these two labs: You opened the APA perspective. You reviewed the report download process. You learned to get HELP screens and pop-ups. You learned the layout of the CAZ0 report. You learned abut six of the report categories. You learned how to drill down into sub-categories of reports. You learned about the displaying the W03, C01, & C08 reports with source mapping.If you have any questions about Application Performance Analyzer, please contact the instructor.Page 24IBM Application Performance Analyzer for z/OS lab exercises
Copyright IBM Corporation 2015. All rights reserved.The information contained in these materials is provided forinformational purposes only, and is provided AS IS without warranty ofany kind, express or implied. IBM shall not be responsible for anydamages arising out of the use of, or otherwise related to, thesematerials. Nothing contained in these materials is intended to, norshall have the effect of, creating any warranties or representationsfrom IBM or its suppliers or licensors, or altering the terms andconditions of the applicable license agreement governing the use ofIBM software. References in these materials to IBM products,programs, or services do not imply that they will be available in allcountries in which IBM operates.IBM, the IBM logo, and other IBM products and services aretrademarks of the International Business Machines Corporation, in theUnited States, other countries or both. Other company, product, orservice names may be trademarks or service marks of others.Page 25IBM Application Performance Analyzer for z/OS lab exercises
Application Performance Analyzer IBM Application Performance Analyzer for z/OS is a tool that helps you perform application performance tuning for applications running on z/OS systems. Application performance tuning is the process of minimizing the amount of time and system resources that your application uses when it run.