Transcription
Electronic Supplementary Material (ESI) for Reaction Chemistry & Engineering.This journal is The Royal Society of Chemistry 2017Advanced reactor engineering with 3D printing for the continuous-flow synthesis of silvernanoparticles.Obinna Okafor,a Andreas Weilhard,a,b Jesum Alves Fernandes,b Erno Karjalainen,a Ruth Goodridgea and VictorSans*a,baFacultybGSKof Engineering, University of Nottingham, University Park, NG7 2RD, Nottingham, UKCarbon Neutral Laboratory, University of Nottingham, Nottingham, NG8 2GA, UKSUPPLEMENTARY INFORMATIONContents1Chemical reagents employed.22Design and fabrication of mCOBR.23Chemical stability of fabrication cured resin .34Residence time distribution studies in the designed mCOBR .44.1Reactor modelling .55mCOBR for silver nanoparticle synthesis .66TEM images and Particle size distribution studies.87UV-Vis spectra of Ag nanoparticles from a regenerated reactor.108References .10
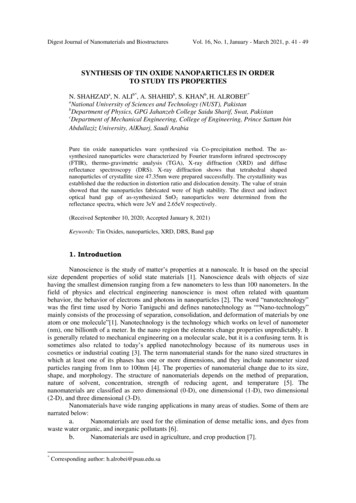
1Chemical reagents employedAll chemicals and solvents employed in this work were purchased from commercial suppliers andemployed without further purification. The resin employed to fabricate the reactors is commerciallyavailable Formlabs Clear FLGPCL02. Acetonitrile, iso-propanol, sodium borohydride (98%) and silvernitrate were purchased from VWR ANALYTICAL. Polyvinylpyrrolidone (PVP) with an average weightof 10000 was purchased from Sigma-Aldrich.2Design and fabrication of mCOBRTwo flow reactors (tubular and mini Continuous oscillatory baffled reactor) devices have beenfabricated by Vat polymerisation technique of Additive manufacturing. This demonstrates theusefulness of AM in fabricating intricate complex structures which are difficult to achieve in othermanufacturing process. CAD models of the TR and mOBR devices, pictured in Figure S 1A, weredesigned on CREO parametric, converted to .STL and fabricated using Form 2, FormlabsStereolithography platform. Off-the-shelf CLEAR FLGPCL02 obtained from formlabs were used infabricating the reactors, Figure S 1B. With fine polishing and spraying with lacquer post-processing, atransparent device can be achieved. The TR and mCOBR devices are designed with volumes of 2.7mland 2.5ml respectively at a layer setting of 100 micron, although a higher resolution of 25microns canbe achieved on the platform. A cross-section of the fabricated 2.5mm diameter reactor was obtainedand measured, Figure S 1C, having a minimal deviation of 0.13mm from the actual model. Themeasured RMS surface roughness at 100 microns print setting was 2.9 µm using a Zygo NewView 8300 coherence scanning interferometer.ABCFigure S 1: AM fabricated/ 3D printed mini Continuous oscillatory baffled reactor device have fine polishing and spraying withLacquer.
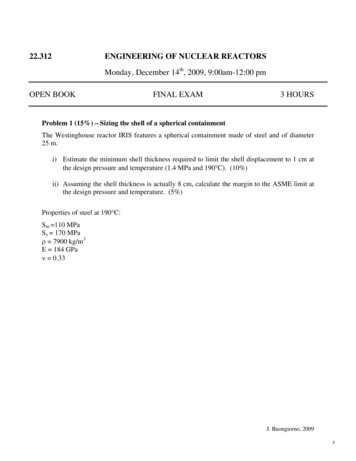
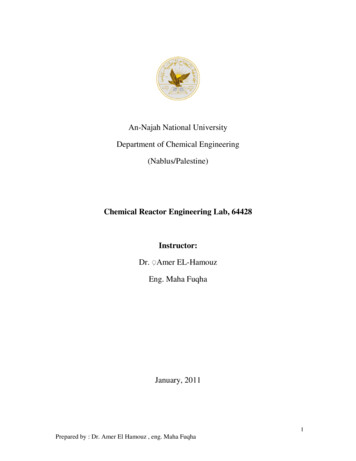
Figure S 2: Using Form 2 AM plaform, which provides a large build platform, multiple reactors can be fabricatedsimultaneously. The tubular and mCOBR is pictured just after fabrication with the support structure still in place.3Chemical stability of fabrication cured resinThe samples were soaked in either isopropanol (i-PrOH), ethanol (EtOH), water and acetonitrile(MeCN) at room temperature for 24 hours. Afterwards, the samples were filtered out from the solventand dried at 50 C under high vacuum overnight.Thermogravimetric analysis (TGA) was conducted under nitrogen atmosphere with PerkinElmer TGA4000. The samples were stabilized in the starting temperature of 30 C for 5 minutes and then heatedto 900 C with the rate of 10 C/min.Infrared (IR) spectra were measured with Bruker Alpha-spectrometer using 24 scans with resolutionof 4 cm-1.Differential scanning calorimetry was done with a TA Q200-instrument under nitrogen atmosphere.The samples were ground in a mortar into a fine powder prior to measurement. The thermal historyof the samples was normalized by heating the samples first to 180 C and cooling them to -50 C. Thesamples were then heated from -50 C to 180 C. The curves from the second heating scans arereported. The heating and cooling rates were 10 C/min in all cases.The TGA-results display a slight change in the thermal decomposition behavior of the samples (FigureS3 A). All samples decompose in two steps (Figure S3 B). According to the manufacturer, the resinconsists of methacrylates and polymethcrylates. Thus first mass loss starting at 200 C can beattributed to partial loss of the side groups and the second one at 400 C to depolymerization of thepolymer.1 Water increases the relative importance of the second decomposition step, which can beattributed to partial hydrolysis of the side groups. The decrease in thermal stability causes by organicsolvents could be due to extraction of stabilizers from the resin. However, all changes are minor andthe IR-spectra are indistinguishable (Figure S3 C), indicating that the bulk of the material remainsessentially the same.
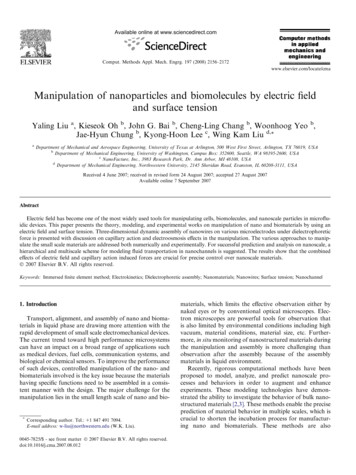
Figure S 3: A) TGA-curves for the resins. B) Derivatives of the TGA-curves. Data has been vertically shifted for clarity. C) IRspectra of the solvent soaked pieces of resin. The curves have been vertically shifted for clarity.4Residence time distribution studies in the designed mCOBRResidence time distribution aided the comparison of the flow condition in the TR and mCOBR. Thesetup comprises of: Two syringe pumps, one responsible for the oscillatory conditions while the otherfor the net flow of the fluid through the reactor; A Rheodyne valve, which injects a pulse of inertcoloured tracer through the reactor, UV-Vis spectrometer and light source which produce theabsorbance spectra of the tracer with change in time. This way the axial dispersion of the tracer in theTR and mCOBR is measured.Figure S 4 Rig setup for residence time distribution studies. Comprising of two tricontinent syringe pumps, mCOBR, UV-Visspectrometer, Rheodyne valve and Light source
Figure S 5 Schematic of the design of the oscillatory system employing an immiscible viscous fluid.Using this technique and by applying eqn 1-4, the E(t) curve, the mean residence time (tm) and thevariance can be obtained from the experimental curves.2𝐶𝑡𝐸(𝑡) 𝐶 𝑑𝑡𝑡0 𝑡𝑚 𝑡 . 𝐸(𝑡)𝑑𝑡0 (𝑡 ‒ 𝑡𝜎2 𝑚)2. 𝐶(𝑡)𝑑𝑡0 𝐶(𝑡)𝑑𝑡0Mixing performance in flow systems of varying configurations can be compared by using thenormalised RTD function E(θ) and the dimensionless time θ:𝐸(𝜃) 𝑡𝑚. 𝐸(𝑡)𝜃 𝑡𝑡𝑚
4.1Reactor modellingThe dispersion model satisfactorily describes flows that do not deviate largely from plug flow.2From Fick’s Law, molecular diffusion in the x-direction can be expressed mathematically as: 𝐶 2𝐶 𝐷 𝑡 𝑥2Where D is the axial or longitudinal dispersion coefficient, which characterises the degree ofback mixing in the flow. In dimensionless form, the differential equation of the dispersionmodel is as follows: 𝐶𝐷 2𝐶 𝐶 ‒ 𝜃𝑢𝐿 𝑧2 𝑧( )𝐷,Where the dimensionless group, 𝑢𝐿 the vessel dispersion number represents the extent ofaxial dispersion. The inverse of the dimensionless group is quantified by the Peclet number,Pe, where u is the fluid velocity, and L is the length of the reactor. For ideal mixed flow, thePeclet number is 0 and infinity for an ideal plug-flow.𝐷1 0𝑢𝐿 𝑃𝑒𝐷1 𝑢𝐿 𝑃𝑒( )Minimal dispersion, therefore plug-flowLarge dispersion, therefore mixed flow“Open” boundary conditions, is achieved if the flow is undisturbed at the inlet and outlet ofthe vessel. In this case the D is same at the boundaries. In the “closed” case, there is a changein flow pattern at the boundaries. The inlet to the reactor is an idealised plug flow, whichtransforms to a dispersed flow in the reactor and back to plug flow at the reactor exit. Themathematical solution for “open” boundary conditions is given by:1 𝑃𝑒𝐸(𝜃) 𝑒2 𝜋𝜃5‒ 𝑃𝑒(1 ‒ 𝜃)24𝜃mCOBR for silver nanoparticle synthesisA 0.25 mM solution of AgNO3 in CH3CN, and another with 0.75 mM of NaBH4 and 0.75 g PVP inCH3CN were pumped with two HPLC pumps (Gilson 305 and Gilson 307) into the preparedreactors with a total flow of 2 mL min-1. Oscillation (0.1 mm and 40 Hz) was induced with aTricontinent C3000 programmable syringe pump equipped with a 5 mL. The oscillation wasgenerated with an immiscible silicon oil to prevent back mixing of the reagents. A mCOBR anda tubular reactor were employed to generate the nanoparticles. All experiments wereperformed at room temperature. The formation of the Ag-NPs was monitored by UV-Vis at theoutlet of the reactor as a function of time. A back pressure regulator (BPR) was employed tomaintain the system under controlled pressure (4 bar). This was done to ensure the HPLCpumps worked adequately. All experiments were run for 100 min. TEM samples were collectedafter 10 min and 90 min. The synthesized Ag-NP solution was collected in a Duran flask.TEM samples were prepared by diluting a drop of the freshly collected reaction mixture inacetone. A drop of the diluted reaction mixture was dropped onto a carbon-coated coppergrid. The so prepared samples were measured in a JEOL 2000FX operated at 200kV.
Figure S 6 Rig setup for Ag-NP synthesis. Comprising of two HPLC pumps, mCOBR, a syringe pump for fluid oscillation, UV-Visspectrometer, light source and a back-pressure regulator.
6TEM images and Particle size distribution studiesFigure S 7 TEM-images at the beginning; tubular (left); mCOBR (right)Figure S 8 Fouling in AM fabricated/3D printed mCOBR and tubular reactors. Fouling is much reduced using optimisedconditions in the mCOBR compared to the tubular reactor. Left: Tubular reactor. Centre: mCOBR run under oscillatoryconditions. Right: mCOBR run at un-optimised oscillatory conditions.
Figure S 9 Non uniform and/or spherical Ag-NP produced in tubular reactor. White bar corresponds to 20 nm.Baffled reactor without oscillation:Reaction conditions and analytics are performed as described in the general procedure, thus nooscillation is induced.Figure S 10 Ag-NPs obtained in a baffled reactor without oscillation. Left: Picture corresponding to the sample obtained in thereactor without oscillation (left) and under mCOBR conditions (right). Centre: TEM image of the Ag-NP obtained under nonoscillatory conditions. Right: Histogram of the Ag-NPs synthesised under non-oscillatory conditions.
7UV-Vis spectra of Ag nanoparticles from a regenerated reactorFigure S 11 UV-Vis of Ag-NPs synthesised in a mCOBR washed with aqua regia (red), compared to that of a solution synthesisedwith a fresh mCOBR (black).8References1. Lai, J. H. Macromolecules 1984, 17, 1010-1012.2. O. Levenspiel, Chemical reaction engineering, 3 edn., John Wiley and Sons (WIE), New York,1999.
Tricontinent C3000 programmable syringe pump equipped with a 5 mL. The oscillation was generated with an immiscible silicon oil to prevent back mixing of the reagents. A mCOBR and a tubular reactor were employed to generate the nanoparticles. All experiments were performed at room temperature.