Transcription
JBoss Performance TuningBill MeyerJBoss Sr. Solutions Architectbill@redhat.com
JVM Memory Tuning
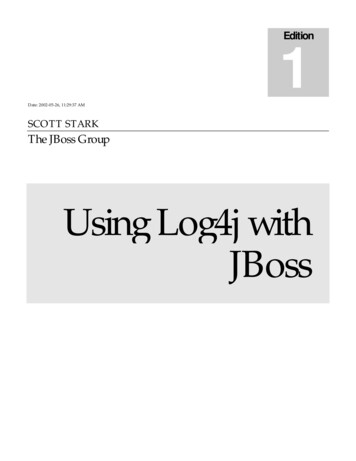
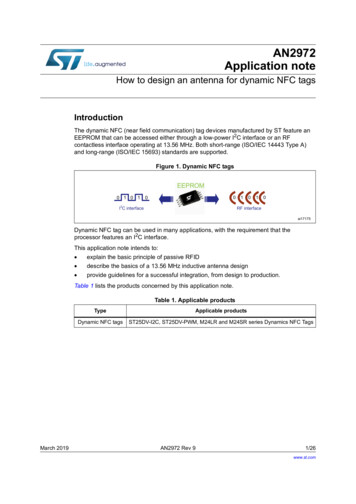
JVM HeapTotal JVM HeapMajor CollectionYoung GenerationOld Generation Young generation Objects are initially allocated in eden One survivor space is empty at any time,and serves as the destination of any liveobjects in eden and the other survivor spaceduring the next copying collection. Objects are copied between survivor spacesuntil they are old enough to be tenured(copied to the tenured generation).SurvivorSpace 1EdenSurvivorSpace 0MinorCollectionTenured Old/Tenured generation PermanentWhere objects are moved to that survive the1st major garbage collectionPermanent Where metadata describing classes andmethods reside. Also used for String pools
Two Types of Collections Minor Collection Occurs when the Young Generation is full Low impact on performance (smaller, targeted area)Major Collection Involves scanning the entire Java heap MANY objects to look at Cause of most performance bottlenecks
JVM Tuning – Basic Steps1. Tune the JVM heap size2. Tune the Young/Tenured Generation Ratio3. Tune the correct garbage collector algorithm
Step 1 – Tune the JVM Heap Size To tune the JVM Identify the appropriate maximum heap size for the applicationand then set initial heap size to match Use the (-Xms) and (-Xmx) arguments For J2SE 5.0 and above, initial and max heap size is based onhardware specs (# of cpu cores and memory)
Step 1 – Tune the JVM Heap SizeMax Heap Size Set the max heap size Simply monitor application under load (jstat, jvisualvm, JBossOperations Network, etc.) Add 25-30% to the peak heap size for buffer Added buffer will help reduce the frequency of garbagecollection Leave room for other running applications!
Step 1 – Tune the JVM Heap SizeInitial Heap Size Set the initial heap size For non-development Set it to be the same as the maximum heap size. Increases predictability and avoids the need to allocate memory toexpand the heap.For development Somewhere between default and max heap size is fine.
Step 2 - Tune the Young/TenuredGeneration Ratio Choose a correct ratio between Young and Tenuredbased on application characteristics Large # of short-lived objects Large # of long-lived objects Increase size of Tenured GenerationExamples- pools, caches, data that lives for the life of theapplicationFor most applications Increase size of Young GenerationOptimal size is 1/3 to ½ of the heapMust also tune the Survivor Space size!
Monitor Garbage Collections in realtime Use the jstat utility with the –gcutil argument jstat –gcutil –h5 pid 2sOutputs stats on garbage collection for a running Java Virtual MachineColumnDescriptionS0Survivor space 0 utilization as a percentage of the space's current capacity.S1Survivor space 1 utilization as a percentage of the space's current capacity.EEden space utilization as a percentage of the space's current capacity.OOld space utilization as a percentage of the space's current capacity.PPermanent space utilization as a percentage of the space's current capacity.YGCNumber of young generation GC events.YGCTYoung generation garbage collection time.FGCNumber of full GC events.FGCTFull garbage collection time.GCTTotal garbage collection docs/share/jstat.html#gcutil option10
Young vs. Tenured Example Two approaches- ratio vs. sizeRatio Example: -XX:NewRatio 3 Means ratio between tenured and young is 3:1 That is tenured occupies 3/4th the total heap eden survivor spaces occupies the other 1/4th total heapSize Example: -XX:NewSize & -XX:MaxNewSize Bind the young (new) generation size from below and above. Setting these equal to one another fixes the Young generation(just like -Xms and –Xmx fixes the heap size). Allows for finer tuning than the integral multiples allowed byNewRatio.
Default JBoss JVM Arguments EAP5/EAP6 VM Arguments: -XX: UseCompressedOops -Xms1303m -Xmx1303m -XX:MaxPermSize 256m -Djava.net.preferIPv4Stack true -Dsun.rmi.dgc.client.gcInterval 3600000 -Dsun.rmi.dgc.server.gcInterval 3600000
Step 3 - Tune the GC Algorithm Garbage collection Eligibility a mechanism provided by Java Virtual Machine to reclaim heapspace from objects, which are eligible for Garbage collection.if an object is not reachable from any live threadsany static references.In other words, an object becomes eligible for Garbagecollection if all its references are null.Choosing the correct Garbage collector algorithm playsan important role in application performance,responsiveness, and throughput.There are several garbage collectors available
Step 3 - Tune the GC AlgorithmSelecting the Serial Collector Serial collector (-XX: UseSerialGC) Performs garbage collector using a single thread which stops otherJVM threads Ideal for smaller applications ( 100MB data set); not recommendedfor production deploymentsUse when Application runs on a single processor No pause time requirements
Step 3 - Tune the GC AlgorithmSelecting the Parallel Collector Parallel collector (-XX: UseParallelGC) Performs minor collections and major (J2SE 5.0) in parallel.(Optionally) Enable parallel compaction ( UseParallelOldGC). Ideal for multiprocessor machines and applications requiring highthroughput. Also good for applications which fragmented Java heaps, allocatinglarge-size objects at different timelines.Default parallel collector runs a collection thread per processorcore. Can be overridden with (-XX:ParallelGCThreads #). Use when Peak application performance is 1st priority Either no pause time requirements or one second are ok
Step 3 - Tune the GC AlgorithmSelecting the Concurrent Collector Concurrent collector (-XX: UseConcMarkSweepGC) Performs most of its work concurrently using a single garbagecollector thread that runs with the application threadssimultaneously.Best when used with fast processor machines and applications witha strict service-level agreement.Can be the best choice, also for applications using a large set oflong-lived objects live HttpSessions.Use when Application response time is more important than overallthroughput Garbage collections must be kept 1 second
JVM Resource Tuning
Tuning Resource Pools Application server resource pools Improves performance by pooling resources that are expensive to create Improves security by setting limits to the number of resources that can existat a time eg., limit the number of worker threads for web requestsEAP6 uses several resource pools to manage different kind ofservices eg., maintain open database connections so they are available when requestedDefault configuration for all resource pools to handle generic use casesFor mission-critical applications, identify the appropriate number ofresources to be assigned to your pools.Tunable resource pools JDBC connection pool EJB pool used by Stateless EJBs and MDBsWeb server pool of threads
Tuning JDBC pools Creating JDBC connections isvery slow! Use JDBC pools to cache openconnections for use-on-demand. Closed connections are simplyreturned to the pool and reused infuture requestsTo determine the proper sizing,you need to monitor yourconnection usage. min-pool-size Specifies a minimum number of connections to keepopen prefill Used to pre-create connections on startup; use withcaution This can produce a performance hit, especially if yourconnections are costly to acquire. blocking-timeout-millis Used to minimize how long requests block waiting fora connection idle-timeout-minutes Indicates how long a connection may be idle beforebeing closed datasource jndi-name "java:jboss/datasources/ExampleDS” pool-name "ExampleDS" enabled "true" use-java-context "true" connection-url jdbc:h2:mem:test;DB CLOSE DELAY -1 /connection-url driver h2 /driver security user-name sa /user-name password sa /password /security timeout blocking-timeout-millis 30000 /blocking-timeout-millis idle-timeout-minutes 30 /idle-timeout-minutes /timeout pool min-pool-size 15 /min-pool-size max-pool-size 25 /max-pool-size prefill true /prefill /pool /datasource
Monitor the JDBC pool size Use the CLI to look at the runtime stats for your datasourceInterested in these statistics ActiveCount - displays the amount of connections which arecurrently activeMaxUsedCount - the peak connections used by the application [standalone@localhost:9999 /] /subsystem datasources/data-source ExampleDS/statistics pool:read-resource(include-runtime true){"outcome" "success","result" {"ActiveCount" "15","AvailableCount" "24","AverageBlockingTime" "0","AverageCreationTime" "11","CreatedCount" "15","DestroyedCount" "0","MaxCreationTime" "161","MaxUsedCount" "1","MaxWaitTime" "0","TimedOut" "0","TotalBlockingTime" "0","TotalCreationTime" "166”},"response-headers" {"process-state" "reload-required”}}
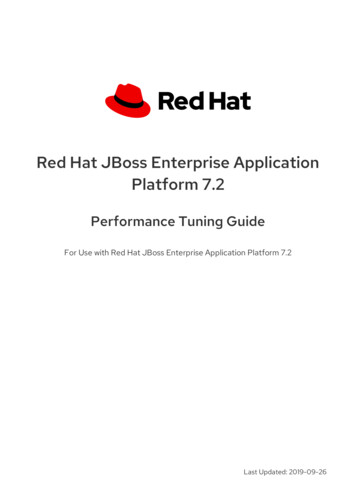
Monitor the JDBC pool size Or the Web Console (with special URL!)
Adjust the JDBC pool size Set max-pool-size to be 25% greater MaxUsedCount. Pools will shrink automatically, provided that you have set idle-timeoutminutes . Watch the server logs for exceptions- 13:42:12,424 ERROR [stderr] (http-executor-threads - 4) Caused by:javax.resource.ResourceException: IJ000655: No managed connectionsavailable within configured blocking timeout (30000 [ms]) 13:42:12,427 ERROR [stderr] (http-executor-threads – ionUse JBoss Operations Network to monitor pool sizes for you!
Tuning EJB Pools Like JDBC pools, EJB pools are used to cachepreviously created EJBs EJB creation and destruction can be expensiveoperations Reduces overheard of reinitializing beans everytimethey are neededTwo pools provided- Stateless EJB pool MDB pool
Tuning EJB Pools A typical EJB pool configuration looks like the following: pools bean-instance-pools strict-max-pool name "slsb-strict-max-pool” max-pool-size "20”instance-acquisition-timeout "5”instance-acquisition-timeout-unit "MINUTES" / strict-max-pool name "mdb-strict-max-pool” max-pool-size "20”instance-acquisition-timeout "5”instance-acquisition-timeout-unit "MINUTES" / /bean-instance-pools /pools strict-max-pools are pools with a maximum upper limitOnce max limit is reached Requests will block waiting for a new beanOr until the acquisition timeout is reached
Tuning Web PoolsStep 1Define a new Thread Pool that will be used to service HTTPrequests: subsystem xmlns "urn:jboss:domain:threads:1.1" bounded-queue-thread-pool name "http-executor" core-threads count "10" per-cpu "20" / queue-length count "10" per-cpu "20" / max-threads count "10" per-cpu "20" / keepalive-time time "10" unit "seconds" / /bounded-queue-thread-pool /subsystem
Tuning Web PoolsStep 2For the HTTP connector, specify the Thread Pool using theexecutor attribute: subsystem xmlns "urn:jboss:domain:web:1.1” default-virtual-server "default-host"native "false" connector name "http" protocol "HTTP/1.1" scheme "http”socket-binding "http" enabled "true" enable-lookups "false”executor "http-executor" max-connections "200" max-post-size "2048”max-save-post-size "4096" proxy-name "proxy" proxy-port "8081”redirect-port "8" secure "false" / virtual-server name "default-host” enable-welcome-root "true" alias name "localhost" / alias name "example.com" / /virtual-server /subsystem
Tuning Web Pools Tune the core-threads and max-threads attributes. Set too low App server may not have enough threads to handle all of therequests Requests will sit idle waiting for another request thread to free up.Set too high Consume a good chunk of memory Your system will spend too much time-context switching
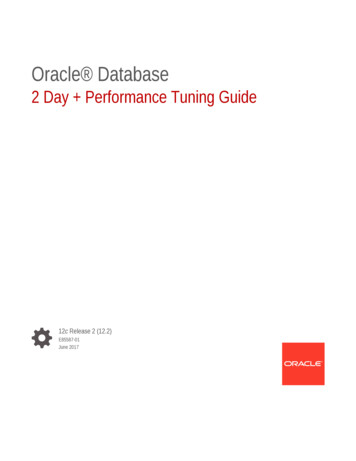
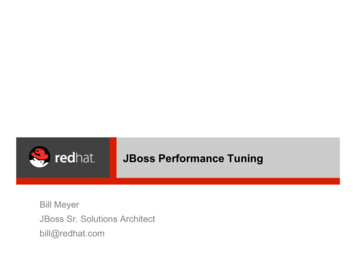
Tuning Web Pools Use jvisualvm to seethread statesGood Running threads Sleeping threads Suspicious Wait Too many executorthreads and not enoughwork?Consuming resourcesunnecessarily
Log Performance Tuning Disable console logging root-logger level name "INFO" / handlers !— handler name "CONSOLE" / -- handler name "FILE" / /handlers /root-logger
Log Performance Tuning Adjust verbosity as needed logger category ”com.arjuna" level name ”ERROR" / /logger logger category ”org.hibernate" level name "WARN" / /logger
Log Performance Tuning Log patterns can influence the performance of yourapplications EAP6 default pattern-formatter pattern "%d{HH:mm:ss,SSS} %-5p [%c] (%t) %s%E%n" /
Log Performance Tuning Simply adding the %l flag pattern-formatterpattern "%l %d{HH:mm:ss,SSS} %-5p [%c] (%t) %s%E%n" / Adds class and line number infoo ormBoottime(ConfigAdminAdd.java:73) 19:16:52,862 INFO[org.jboss.as.configadmin](ServerService Thread Pool -- 26) JBAS016200: Activating ConfigAdmin Subsystem Great for development, horrible for production!
Log Performance Tuning Other high-overhead flags to avoid %C – outputs the caller class information %M - outputs the method where logging was emitted %F - outputs the filename where the logging request wasissued)
Questions?
JBoss Performance Tuning . JVM Memory Tuning . Young Generation Old Generation Young generation Objects are initially allocated in eden . Involves scanning the entire Java heap MANY objects to look at Cause of most performance bottlenecks Two Types of Collections . 1.