Transcription
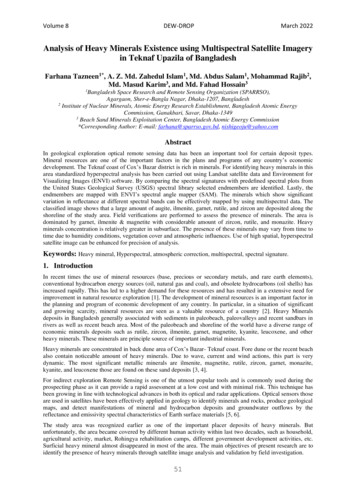
Volume 8DEW-DROPMarch 2022Analysis of Heavy Minerals Existence using Multispectral Satellite Imageryin Teknaf Upazila of BangladeshFarhana Tazneen1*, A. Z. Md. Zahedul Islam1, Md. Abdus Salam1, Mohammad Rajib2,Md. Masud Karim3, and Md. Fahad Hossain31Bangladesh Space Research and Remote Sensing Organization (SPARRSO),Agargaon, Sher-e-Bangla Nagar, Dhaka-1207, Bangladesh2Institute of Nuclear Minerals, Atomic Energy Research Establishment, Bangladesh Atomic EnergyCommission, Ganakbari, Savar, Dhaka-13493Beach Sand Minerals Exploitation Center, Bangladesh Atomic Energy Commission*Corresponding Author: E-mail: farhana@sparrso.gov.bd, nishigeoju@yahoo.comAbstractIn geological exploration optical remote sensing data has been an important tool for certain deposit types.Mineral resources are one of the important factors in the plans and programs of any country’s economicdevelopment. The Teknaf coast of Cox’s Bazar district is rich in minerals. For identifying heavy minerals in thisarea standardized hyperspectral analysis has been carried out using Landsat satellite data and Environment forVisualizing Images (ENVI) software. By comparing the spectral signatures with predefined spectral plots fromthe United States Geological Survey (USGS) spectral library selected endmembers are identified. Lastly, theendmembers are mapped with ENVI’s spectral angle mapper (SAM). The minerals which show significantvariation in reflectance at different spectral bands can be effectively mapped by using multispectral data. Theclassified image shows that a large amount of augite, ilmenite, garnet, rutile, and zircon are deposited along theshoreline of the study area. Field verifications are performed to assess the presence of minerals. The area isdominated by garnet, ilmenite & magnetite with considerable amount of zircon, rutile, and monazite. Heavyminerals concentration is relatively greater in subsurface. The presence of these minerals may vary from time totime due to humidity conditions, vegetation cover and atmospheric influences. Use of high spatial, hyperspectralsatellite image can be enhanced for precision of analysis.Keywords: Heavy mineral, Hyperspectral, atmospheric correction, multispectral, spectral signature.1. IntroductionIn recent times the use of mineral resources (base, precious or secondary metals, and rare earth elements),conventional hydrocarbon energy sources (oil, natural gas and coal), and obsolete hydrocarbons (oil shells) hasincreased rapidly. This has led to a higher demand for these resources and has resulted in a extensive need forimprovement in natural resource exploration [1]. The development of mineral resources is an important factor inthe planning and program of economic development of any country. In particular, in a situation of significantand growing scarcity, mineral resources are seen as a valuable resource of a country [2]. Heavy Mineralsdeposits in Bangladesh generally associated with sediments in paleobeach, paleovalleys and recent sandbars inrivers as well as recent beach area. Most of the paleobeach and shoreline of the world have a diverse range ofeconomic minerals deposits such as rutile, zircon, ilmenite, garnet, magnetite, kyanite, leucoxene, and otherheavy minerals. These minerals are principle source of important industrial minerals.Heavy minerals are concentrated in back dune area of Cox’s Bazar- Teknaf coast. Fore dune or the recent beachalso contain noticeable amount of heavy minerals. Due to wave, current and wind actions, this part is verydynamic. The most significant metallic minerals are ilmenite, magnetite, rutile, zircon, garnet, monazite,kyanite, and leucoxene those are found on these sand deposits [3, 4].For indirect exploration Remote Sensing is one of the utmost popular tools and is commonly used during theprospecting phase as it can provide a rapid assessment at a low cost and with minimal risk. This technique hasbeen growing in line with technological advances in both its optical and radar applications. Optical sensors thoseare used in satellites have been effectively applied in geology to identify minerals and rocks, produce geologicalmaps, and detect manifestations of mineral and hydrocarbon deposits and groundwater outflows by thereflectance and emissivity spectral characteristics of Earth surface materials [5, 6].The study area was recognized earlier as one of the important placer deposits of heavy minerals. Butunfortunately, the area became covered by different human activity within last two decades, such as household,agricultural activity, market, Rohingya rehabilitation camps, different government development activities, etc.Surficial heavy mineral almost disappeared in most of the area. The main objectives of present research are toidentify the presence of heavy minerals through satellite image analysis and validation by field investigation.51
Volume 8TAZNEEN ET AL.March 20222. Study AreaPart of Shilkhali and Lombori union of Teknaf upazilla under Cox’sBazar district (Figure 1) has been selected as study areas which wererich in heavy minerals as found in previous studies. The beachformation of Cox's Bazar-Teknaf area is a recent geological featureand has been formed on the wide and regionally extending gentleslope of the Shelf. Sediments deposited in these beach, are widelycontrolled by moderate ocean current dynamics. The black heavymineral deposits, occurring as placer in the beach area, are mostlylenticular in shape. The deposits do exist both in the back dunes andin the fore dunes [7].3. Methodology and Data UsedFigure 2 shows the methodological framework of the presentresearch study. ENVI 6.4 version with the ArcGIS has been used formapping heavy minerals from satellite imagery. For this purposeLandsat 8 OLI image of November 2020, January 2021, and April2021 (Table 1) has been collected from the websitehttps://earthexplorer.usgs.gov.Figure 1: Location map of the study areaSatelliteSensorLandsat 8OLITable 1: List of data used in the StudyPath/RowAcquisition Date23 November 2020135/4630 January 202104 April 2021Resolution30 MFirst, the fast line-of-sight atmospheric analysis of spectral hypercubes (FLAASH) an atmospheric correctionmodeling tool is used to remove the atmospheric effects due to the presence of water vapor, aerosols, dustparticles, etc. from satellite data. The reflectance calibration of the Landsat OLI data is performed with prelaunch gains and offsets calculated for Landsat sensors [8]. After obtaining suitable calibration parameters of theLandsat data, the model compensates for the atmospheric effects and retrieves the spectral reflectance from themultispectral radiance images. Finally, the preprocessed data is subjected to hourglass spectral analysis, whichhas the following steps [9, 10].Satellite ImageStudy Area SelectionRadiometric CorrectionFast Line-of-sight Atmospheric Analysis of Spectral HypercubeSpectral Hourglass AnalysisSpectral Signature AnalysisOutput GenerationFigure 2: Flow Chart of the working methodology.3.1 Minimum noise fraction transformationTo determine the inherent dimensionality of image data, to segregate noise in the data, and to reduce thecomputational requirements for subsequent processing ENVI’s minimum noise fraction (MNF) transformationis used [11]. The advantages of MNF transformation over principal component analysis to reduce thedimensionality of hyperspectral imagery stated as Che-Ming Chen [12]. This transformation is applied to theatmospherically corrected and calibrated data and it generates seven MNF-transformed bands which can beviewed and analyzed.52
Volume 8DEW-DROPMarch 20223.2 Pixel purity indexTo finding the most spectrally pure pixels in images ENVI’s pixel purity index (PPI) is the best way [13,14]. Byseparating the most spectrally pure pixels it performs the spectral redundancy of data. The PPI reduces thenumber of pixels to be analysed in a data set and leads us to attain the spectrally unique target minerals orendmembers. The PPI generates an image in which pixel values correspond to the number of times that a pixelin the input data was recorded as extreme. This research work is carried out with the PPI analysis on the MNFbands with 1000 iterations and a threshold value of 3. The generated PPI image can be viewed and analyzed forlocating the endmembers in an image.3.3 n-Dimensional VisualizerIt is an interactive tool to locate, identify, and cluster the purest pixels and the most extreme spectral responses(endmembers) in a dataset in n-dimensional space. The generated pixel clouds can be rotated and visualized indifferent directions and angles. The visualizer helps to identify and isolate the target endmembers present in thedata from the main clusters. The selected endmembers are verified by comparing and analyzing their spectralsignatures with existing spectral reflectance data from USGS spectral libraries.3.4 Mapping of minerals using spectral angle mapperSpectral Angle Mapper (SAM) is a physically-based spectral classification that uses an n-D angle to matchpixels to reference spectra. The algorithm determines the spectral similarity between two spectra by calculatingthe angle between the spectra and treating them as vectors in a space with dimensionality equal to the number ofbands. This technique, when used on calibrated reflectance data, is relatively insensitive to illumination andalbedo effects. Endmember spectra can be directly extracted directly from an image as region of interest (ROI)mean spectra. SAM compares the angle between the endmember spectrum vector and each pixel vector in n-Dspace. Smaller angles represent closer matches to the reference spectrum. Pixels further away than the specifiedmaximum angle threshold in radians are not classified. USGS spectral library is used as reference spectrum.4. Results & DiscussionThe generated data space of the MNF transformation can be divided into two parts; one part is associated withlarge eigenvalues and coherent Eigen images. The other part is a complementary part with near-unityeigenvalues. Among the seven transformed MNF bands, the last two bands have the least information and aredominated by noise. They are omitted from further processing. Due to the application of the MNFtransformation, the redundancy and noise in the data are eliminated and more-interpretable images are obtained.This operation was done for both study sites Shilkhali and Lombori of Teknaf.November2020January2021April 2021Figure 3: Distribution of Heavy minerals in Shilkhali area reveal through spectral analysis of Landsat 8OLI images of November 2020, January 2021and April 2021.The PPI image (not shown) also helps to identify the target endmembers. The brighter pixels of the PPItransformed image represent the most spectrally extreme pixels. To identify and locate the endmembers, the dataclouds were visualized through the n-D Visualizer. In the visualizer, four separate clusters of pixels are seen inaddition to the main cluster. The separate clusters may represent abundant mineral resources along the studyarea.The spectral signatures of the obtained endmembers are very similar to the spectral signatures of rutile zircon,ilmenite, garnet, and augite. Finally, the endmembers are mapped with the SAM method. SAM is an automated53
Volume 8TAZNEEN ET AL.March 2022method for comparing image spectra to individual spectra or a spectral library [15]. It is also a per-pixelmapping method, which attempts to determine whether one or more target endmembers are abundant withineach pixel in a hyperspectral (or multispectral) image based on the spectral similarity between the training(reference) pixel and target (unknown) spectra. The algorithm determines the similarity between two spectra bycalculating the spectral angle between them, treating them as vectors in n-D space, where n is the number ofbands. Smaller angles represent closer matches to the reference spectrum [10].Figures 3, and 4 show the SAM-classified image representing the distribution of the heavy minerals along withthe study areas. The classified images show that a large amount of augite with zircon, rutile, and garnet aredeposited in the Shilkhali and Lombori study area. Ilmenite is also deposited in the Lombori area. Imageanalysis also reveals the seasonal impact on the presence of minerals.January 2021April 2021Figure 4: Distribution of Heavy minerals in Lombori, Teknaf area reveal through spectral analysis ofLandsat 8 OLI image of January 2021 and April 2021.4.1 Field ValidationField verification of mineral resources has been performed to assess the accuracy of classification. The surveyencompasses both the back dune and fore dune area along the coast of the study area. Total 38 surface sampleswere collected (18 samples from Shilkhali and 20 samples from Lombori) for further investigation in thelaboratory. Sampling points were selected as a random pattern and the GPS coordinate of each sample aziteFigure 5: different heavy minerals identified during microscopic analysis.54
Volume 8SampleIDSL 1SL 2SL 3SL 4SL 5SL 6SL 7SL 8SL 9SL 10SL 11SL 12SL 13SL 14SL 15SL 16SL 17SL 18DEW-DROPTable 2: Individual Mineral percentage in raw sand (Shilkhali, Teknaf)OpaqueTotal Heavy(Ilmenite GarnetZirconRutileMonazitemineral 50.030.04March 36.159.6312.506.357.5810.277.942.942.88Table 3: Individual Mineral percentage in raw sand (Lombori, Teknaf).OpaqueSampleTotal Heavy(Ilmenite GarnetZirconRutileMonaziteOthersIDmineral %Magnetite)TK 122.256.722.941.110.090.0611.32TK 280.5931.4410.916.610.730.3630.54TK 36.212.191.120.300.080.042.49TK 415.716.043.260.480.160.085.70TK 535.169.099.091.160.180.1415.51TK 614.595.602.990.370.130.075.43TK 718.136.763.430.650.100.037.16TK 89.903.401.640.640.120.104.00TK 929.499.944.141.500.130.1713.62TK 108.603.090.940.260.040.034.24TK 119.713.011.230.440.050.034.94TK 1215.005.452.450.740.080.026.25TK 134.451.350.850.210.020.022.00TK 143.651.430.570.210.020.021.40TK 153.761.250.790.440.040.031.90TK 1620.017.474.001.210.160.127.04TK 1715.865.372.050.530.090.087.74TK 1876.2123.6212.0810.720.480.7328.58TK 1921.476.364.421.160.300.199.03TK 208.202.961.940.500.170.062.57Each sample was undergone oven-dry until all of the moisture was released. Dry samples were passed throughthe elimination process of unwanted material like a tree root, marine organism shell, etc. Then, samples werewashed with fresh water using a sieve mesh size of 55µm ensuring any sand grain is not removed by water. Allsamples were subjected to bromoform separation (CHBr3 with specific gravity 2.89). Separated heavy mineralswere investigated under an optical polarized microscope (Optima ML9000) by applying the grain countingtechnique (Figure 5). Temporary slides were prepared for this analysis to identify individual minerals based ontheir optical properties. According to the standard procedure, mineral grains were counted from 10 views foreach slide (i.e. samples) with at least 100 grains in each view, which leaves a total minimum of 1000 grains foreach sample. Adjusting with the specific gravity, the concentration of identified minerals was calculated asweight percentage (Table 2 and 3).55
Volume 8TAZNEEN ET AL.March 2022The accuracy of image classification and the mapping of mineral deposits can be assessed by comparing theheavy mineral contents of the sediment sample and the type of classified pixel corresponding to the location ofthe sample.From laboratory analysis, it is seen that average quantity of heavy minerals in Shilkhali area is 18.987% andLombori area is 20.947 %. At Shilkhali, maximum abundance of heavy minerals (46.01%) was found in sampleno SL-6 and at Lombori, maximum abundance of heavy minerals (80.59%) was found in sample no TK-2. Allthe samples were collected from surface of the deposits where heavy minerals concentration is generally low.Heavy minerals concentration is relatively greater in subsurface (up to 5 ft depth). In mineralogical point ofview, the area is dominated by garnet, ilmenite & magnetite with considerable amount of zircon, rutile,monazite and also presence of some other unidentified heavy minerals.Presence of heavy minerals on surface of the deposits is not prominent due to human activity and vegetationcover. However, subsurface condition of heavy minerals may remain unchanged compared to previouslyidentify heavy minerals deposits along back dune area. But fore dune area, i.e. near shore line is variablebecause it experiences successive erosion and deposition and this area is directly attached with Ocean currentdynamics of the Bay of Bengal.5. Conclusion and RecommendationRemote sensing is a useful tool in mapping the mineral resources along with coastal areas. In this study, thepotential use of multispectral Landsat data for mapping heavy-mineral resources has been demonstrated. Theminerals which show significant variation in reflectance at different spectral bands can be effectively mapped byusing multispectral data. The classified image shows that a large amount of augite is deposited along theshoreline of the study area. Ilmenite garnet, rutile, and zircon are also deposited along the coast. It is veryhelpful to identify and locate the abundance of minerals, which leads to the eco-friendly and sustainableexploitation of minerals resources along the study area. It also emphasizes the ability and application of Landsatdata to investigate potential mineral resources. Field validation supports the presence of ilmenite garnet, rutile,and zircon but augite in the study area. It is also clear that the identification of minerals from satellite image istime sensitive. Presence of these mineral may vary time to time due to moisture condition, vegetation cover andatmospheric effects. Multispectral satellite images have limitations because of their low band numbers.Hyperspectral images have special advantages in mineralogical applications. For more accurate resultshyperspectral imagery has to be used. To minimize the effect of mixed pixels and extract better information useof high spatial resolution image is highly recommended for future work. Collection of spectral signature fromthe field using spectro-radiometer will enhance the accuracy of the research.AcknowledgementsThe author is thankful to Beach Sand Mineral Exploitation Center (BSMEC), Cox’s Bazar of BangladeshAtomic Energy Commission (BAEC) for working as a collaborative partner in this research work.References[1] Hede, A., N., H., 2016. Development and Application of Geobotanical Remote Sensing Methods for MineralExploration in Thick Vegetation Areas, Ph. D Dissertation (Unpublished), Graduate School ofEngineering, Kyoto University.[2] Faruque, A. A., 2018. Bangladesh: Legal Framework on Mineral Exploration, Springer-Verlag GmbHGermany, part of Springer Nature 2018, G. Tiess et al. (eds.), Encyclopedia of Mineral and Energy[3] Kabir, M.Z., Deeba, F., Rasul, M.G., Majumder, R.K., Khalil, M.I. and Islam, M.S., 2018. Heavy MineralDistribution and Geochemical Studies of Coastal Sedimentsat Sonadia Island, Bangladesh, Journal ofNuclear Science. Policy, https://doi.org/10.1007/978-3-642-40871-7 151-1.[4] Deeba, F., Kabir, M.Z., Zaman, M.M., Rajib, M. and Rana, S.M., 2009. Difference in Grain SizeDistribution Among Heavy Minerals of Cox’s Bazar, Barchara, Patuartek and Teknaf Fore DuneDeposit, Proceed. of Int. Confer. on Geosci. for Glob. Dev., 26-31 October, 2009, Dhaka, Bangladesh,24-27.[5] Koide, K., & Koike, K. (2012). Applying vegetation indices to detect high water table zones in humid warmtemperate regions using satellite remote sensing. International Journal of Applied Earth Observationand Geoinformation, 19, 88–103. http://doi.org/10.1016/j.jag.2012.03.017[6] Sabins, F. F., 1999. Remote sensing for mineral exploration. Ore Geology Reviews, 8 (99)00007-456
Volume 8DEW-DROPMarch 2022[7] Chowdhury, M.I. and Sarker, M.N., 2014. Delineation of the Surface Pattern of Heavy Mineral Deposit ofTulatoli Paleo Dune Within Teknaf Beach Strip of Cox’s Bazar District with Radiometric Survey.Nuclear science and applications, Vol. 2 3. No. 1&2.[8] MARKHAM, B.L. and BARKER, J.L., 1986, Landsat MSS and TM post-calibration dynamic ranges,exoatmospheric reflectances and at-satellite temperatures. EOSAT Landsat technical notes, pp. 3–8.[9] Gazi, M. Y., Tafhim, K. T., Ahmed, M. K. and Islam, M. A., 2019. Investigation of Heavy-Mineral DepositsUsing Multispectral Satellite Imagery in the Eastern Coastal Margin of Bangladesh, Journal of EarthSciences Malaysia (ESMY), ISSN: 2521-5043 (online)[10] Chandrasekar, N., Sheik Mujabar, P. & Rajamanickam G.V., 2011. Investigation of heavy-mineral depositsusing multispectral satellite data, International Journal of Remote Sensing, 32:23, 8641-8655, DOI:10.1080/01431161.2010.545448[11] Boardman, J.W. and KRUSE, F.A., 1994. Automated spectral analysis: a geologic example using AVIRISdata, north Grapevine Mountains, Nevada. In Proceedings of Tenth Thematic Conference on GeologicRemote Sensing, 9–12 May 1994, San Antonio, TX (Ann Arbor MI: Environmental Research Instituteof Michigan), pp. I-407–I-418[12] Che, Ming Chen., 2000. Comparison of principal components analysis and minimum noise fractiontransformation for reducing the dimensionality of hyperspectral imagery. Geographical Research, 33,pp. 163–178.[13] Boardman, J.W., 1993. Automating spectral unmixing of AVIRIS data using convex geometry concepts. In4th JPL Airborne Geoscience Workshop, Washington, DC (Pasadena, CA: Jet Propulsion Laboratory),pp. 11–14.[14] Boardman, J.W., Kruse, F.A. and green, R.O., 1995. Mapping target signatures via partial unmixing ofAVIRIS data. In Summaries of the 5th Annual JPL Airborne Geoscience Workshop, 23–26 January1995, Pasadena, CA (Pasadena: Jet Propulsion Laboratory), pp. 23–26.[15] Boardman, J.W. and HUNTINGTON, J.F., 1996. Mineral mapping with 1995 AVIRIS data. In Summariesof the Sixth Annual JPL Airborne Research Science Workshop (JPL Publication 96-4), vol. 1, pp. 9–11(Pasadena, CA: Jet Propulsion Laboratory).57
are used in satellites have been effectively applied in geology to identify minerals and rocks, produce geological . and cluster the purest pixels and the most extreme spectral responses (endmembers) in a dataset in n-dimensional space. The generated pixel clouds can be rotated and visualized in . Distribution of Heavy minerals in Shilkhali .