Transcription
Received: 25 October 2021 Revised: 29 March 2022 Accepted: 1 April 2022DOI: 10.1111/ele.14012LETTERGlobally, tree fecundity exceeds productivity gradientsValentin Journé1 Robert Andrus2 Marie- Claire Aravena3 Davide Ascoli4 Roberta Berretti4 Daniel Berveiller5 Michal Bogdziewicz6 Thomas Boivin7 Raul Bonal8 Thomas Caignard9 Rafael Calama10 Jesús Julio Camarero11 121713Chia- Hao Chang- Yang Benoit Courbaud Francois Courbet Thomas Curt 141575Adrian J. Das Evangelia Daskalakou Hendrik Davi Nicolas Delpierre 916Sylvain Delzon Michael Dietze Sergio Donoso Calderon3 Laurent Dormont17 Josep Maria Espelta18 Timothy J. Fahey19 William Farfan- Rios20 Catherine A. Gehring21 Gregory S. Gilbert22 Georg Gratzer23 Cathryn H. Greenberg24 Qinfeng Guo25 Andrew Hacket- Pain26 Arndt Hampe9 Qingmin Han27 Janneke Hille Ris Lambers28 Kazuhiko Hoshizaki29 Ines Ibanez30 Jill F. Johnstone31 Daisuke Kabeya27 Roland Kays32 Thomas Kitzberger33 Johannes M. H. Knops34 Richard K. Kobe35 Georges Kunstler1 3637Jonathan G. A. Lageard Jalene M. LaMontagne Theodor Leininger38 Jean- Marc Limousin39 James A. Lutz40 Diana Macias41 Eliot J. B. McIntire42 Christopher M. Moore43 Emily Moran44 Renzo Motta4 Jonathan A. Myers45 Thomas A. Nagel46 Kyotaro Noguchi47 Jean- Marc Ourcival39 Robert Parmenter48 Ian S. Pearse49 Ignacio M. Perez- Ramos50 Lukasz Piechnik51 John Poulsen52 Renata Poulton- Kamakura52 Tong Qiu52 Miranda D. Redmond53 Chantal D. Reid52 Kyle C. Rodman54 Francisco Rodriguez- Sanchez55 Javier D. Sanguinetti56 C. Lane Scher52 Harald Schmidt Van Marle3 Barbara Seget51 Shubhi Sharma52 Miles Silman57 Michael A. Steele58 Nathan L. Stephenson14 Jacob N. Straub59 Jennifer J. Swenson52 Margaret Swift52 Peter A. Thomas60 Maria Uriarte61 62263Giorgio Vacchiano Thomas T. Veblen Amy V. Whipple Thomas G. Whitham63 Boyd Wright64 S. Joseph Wright65 Kai Zhu22 Jess K. Zimmerman66 Roman Zlotin67 Magdalena Zywiec51 James S. Clark1,521Universite Grenoble Alpes, Institut National de Recherche pour Agriculture, Alimentation et Environnement (INRAE), Laboratoire EcoSystemes et Societes EnMontagne (LESSEM), St. Martin- d’Heres, France2Department of Geography, University of Colorado Boulder, Boulder, Colorado, USA3Universidad de Chile, Facultad de Ciencias Forestales y de la Conservacion de la Naturaleza (FCFCN), Santiago, Chile4Department of Agriculture, Forest and Food Sciences, University of Torino, Grugliasco, TO, Italy5Universite Paris- Saclay, Centre national de la recherche scientifique, AgroParisTech, Ecologie Systematique et Evolution, Orsay, France6Department of Systematic Zoology, Faculty of Biology, Adam Mickiewicz University, Poznan, Poland7Institut National de Recherche pour Agriculture, Alimentation et Environnement (INRAE), Ecologie des Forets Mediterranennes, Avignon, France8Department of Biodiversity, Ecology and Evolution, Complutense University of Madrid, Madrid, SpainEcology Letters. 2022;00:1–12.wileyonlinelibrary.com/journal/ele 2022 John Wiley & Sons Ltd. 1
2GLOBALLY, TREE FECUNDITY EXCEEDS PRODUCTIVITY GRADIENTS9Universite Bordeaux, Institut National de Recherche pour Agriculture, Alimentation et Environnement (INRAE), Biodiversity, Genes, and Communities(BIOGECO), Pessac, France10Centro de Investigacion Forestal (INIA- CSIC), Madrid, Spain11Instituto Pirenaico de Ecologla, Consejo Superior de Investigaciones Cientificas (IPE- CSIC), Zaragoza, Spain12Department of Biological Sciences, National Sun Yat- s en University, Kaohsiung, Taiwan13Aix Marseille universite, Institut National de Recherche pour Agriculture, Alimentation et Environnement (IN- R AE), Aix- en- P rovence, France14USGS Western Ecological Research Center, Three Rivers, California, USA15Institute of Mediterranean and Forest Ecosystems, HellenicAgricultural Organization DEMETER , Athens, Greece16Earth and Environment, Boston University, Boston, Massachusetts, USA17Centre d’Ecologie Fonctionnelle et Evolutive (CEFE), Centre National de la Recherche Scientifique (CNRS), Montpellier, France18Centre de Recerca Ecologica i Aplicacions Forestals (CREAF), Bellaterra, Catalunya, Spain19Natural Resources, Cornell University, Ithaca, New York, USA20Center for Conservation and Sustainable Development, Washington University in Saint Louis, Missouri Botanical Garden, St. Louis, Missouri, USA21Department of Biological Sciences and Center for Adaptive Western Landscapes, University of Northern Arizona, Flagstaff, Arizona, USA22Department of Environmental Studies, University of California, Santa Cruz, California, USA23University of Natural Resources and Life Sciences and Institute of Forest Ecology, Wien, Austria24Bent Creek Experimental Forest, USDA Forest Service, Asheville, North Carolina, USA25Eastern Forest Environmental Threat Assessment Center, USDA Forest Service, Southern Research Station, Asheville, North Carolina, USA26Department of Geography and Planning, School of Environmental Sciences, University of Liverpool, Liverpool, UK27Department of Plant Ecology Forestry and Forest Products Research Institute (FFPRI), Tsukuba, Ibaraki, Japan28Department of Environmental Systems Science, ETH Zurich, Switzerland29Department of Biological Environment, Akita Prefectural University, Akita, Japan30School for Environment and Sustainability, University of Michigan, Ann Arbor, Michigan, USA31Institute of Arctic Biology, University of Alaska, Fairbanks, Alaska, USA32Department of Forestry and Environmental Resources, NC State University, Raleigh, North Carolina, USA33Department of Ecology, Instituto de Investigaciones en Biodiversidad y Medioambiente (Consejo Nacional de Investigaciones Cientificas y Tecnicas - Universidad Nacional del Comahue), Bariloche, Argentina34Health and Environmental Sciences Department, Xian Jiaotong- Liverpool University, Suzhou, China35Department of Plant Biology, Program in Ecology, Evolutionary Biology, and Behavior, Michigan State University, East Lansing, Michigan, USA36Department of Natural Sciences, Manchester Metropolitan University, Manchester, UK37Department of Biological Sciences, DePaul University, Chicago, Illinois, USA38USDA, Forest Service, Southern Research Station, Stoneville, Mississippi, USA39CEFE, Univ Montpellier, CNRS, EPHE, IRD, Montpellier, France40Department of Wildland Resources, and the Ecology Center, Utah State University, Logan, Utah, USA41Department of Biology, University of New Mexico, Albuquerque, New Mexico, USA42Pacific Forestry Centre, Victoria, British Columbia, Canada43Department of Biology, Colby College, Waterville, Maine, USA4445School of Natural Sciences, UC Merced, Merced, California, USADepartment of Biology, Washington University in St. Louis, St. Louis, Missouri, USA4647Department of forestry and renewable forest resources, Biotechnical Faculty, University of Ljubljana, Ljubljana, SloveniaTohoku Research Center, Forestry and Forest Products Research Institute, Morioka, Iwate, Japan48Valles Caldera National Preserve, National Park Service, Jemez Springs, New Mexico, USA49Fort Collins Science Center, Fort Collins, Colorado, USA50Inst. de Recursos Naturales y Agrobiologia de Sevilla, Consejo Superior de Investigaciones Cientificas (IRNAS- CSIC), Seville, Andalucia, Spain51W. Szafer Institute of Botany, Polish Academy of Sciences, Krakow, Poland52Nicholas School of the Environment, Duke University, Durham, North Carolina, USA53Department of Forest and Rangeland Stewardship, Colorado State University, Fort Collins, Colorado, USA5455Department of Forest and Wildlife Ecology, University of Wisconsin- Madison, Madison, Wisconsin, USADepartment of Biologia Vegetal y Ecologia, Universidad de Sevilla, Sevilla, Spain56Bilogo Dpto. Conservacin y Manejo Parque Nacional Lanin Elordi y Perito Moreno 8370, San Marten de los Andes, Argentina57Department of Biology, Wake Forest University, Winston- Salem, North Carolina, USA58Department of Biology, Wilkes University, Wilkes- Barre, Pennsylvania, USA59Department of Environmental Science and Ecology, State University of New York- Brockport, Brockport, New York, USA60School of Life Sciences, Keele University, Staffordshire, UK61Department of Ecology, Evolution and Environmental Biology, Columbia University, New York, New York, USA62Department of Agricultural and Environmental Sciences - Production, Territory, Agroenergy (DISAA), University of Milan, Milano, Italy63Department of Biological Sciences, Northern Arizona University, Flagstaff, Arizona, USA64Botany, School of Environmental and Rural Science, University of New England, Armidale, New South Wales, Australia
JOURNÉ et al.65 3Smithsonian Tropical Research Institute, Balboa, Republic of Panama66Department of Environmental Sciences, University of Puerto Rico, Rio Piedras, Puerto Rico, USA67Geography Department and Russian and East European Institute, Bloomington, Indiana, USACorrespondenceJames S. Clark, Nicholas School of theEnvironment, Duke University, Durham,NC, USA.Email: jimclark@duke.eduFunding informationBelmont Forum, Grant/Award Number:1854976; Programme d’Investissementd’Avenir, Grant/Award Number:18- MPGA- 0 004; National ScienceFoundation, Grant/Award Number: DEB- 1754443; NASA, Grant/Award Number:AIST16- 0 052 and AIST18- 0 063Editor: Daniel McGlinnAbstractLack of tree fecundity data across climatic gradients precludes the analysis ofhow seed supply contributes to global variation in forest regeneration and bioticinteractions responsible for biodiversity. A global synthesis of raw seedproductiondata shows a 250- fold increase in seed abundance from cold- dry to warm- wetclimates, driven primarily by a 100- fold increase in seed production for a given treesize. The modest (threefold) increase in forest productivity across the same climategradient cannot explain the magnitudes of these trends. The increase in seeds pertree can arise from adaptive evolution driven by intense species interactions orfrom the direct effects of a warm, moist climate on tree fecundity. Either way, themassive differences in seed supply ramify through food webs potentially explaininga disproportionate role for species interactions in the wet tropics.K EY WOR DSclimate, competition, forest regeneration, seed consumption, species interactions, tree fecundityI N T RODUC T IONUnderstanding how tree fecundity contributes to globalbiodiversity and ecosystem function requires estimatesof latitudinal trends in seed production. At the community scale, tree fecundity determines the density of competing offspring and the diets of consumers and seeddispersers that depend on seeds and seedlings (Corlett,2013; Mokany et al., 2014; Terborgh, 1986). Diversity,stem density and growth and mortality rates all showimportant trends with latitude (Chu et al., 2019; Lewiset al., 2004; Locosselli et al., 2020; Phillips & Gentry,1994; Stephenson & Van Mantgem, 2005). Fecundityestimates are now available in North America (Clarket al., 2021; Sharma et al., 2021), but unlike growth andmortality rates (Brienen et al., 2020; Stephenson & VanMantgem, 2005), fecundity estimates have not beencompiled from the tropics. At the global scale, a meta- analysis of 18 seedtrap studies in temperate and tropicalforests did not find a relationship between seedrain density (seeds per area) and latitude, but the same study suggested that seed mass density might decline with latitude(Moles et al., 2009). If the density of seed mass per areais higher in the tropics than in the temperate zone, doeshigh seed mass density in the tropics come from the factthat tropical trees are simply larger and/or embedded inmore productive communities, as assumed in DynamicGlobal Vegetation Models (DGVMs) (Fisher et al., 2018;Hanbury- Brown et al., 2022; Krinner et al., 2005; Sitchet al., 2003)? Alternatively, does high seed mass densityin the tropics result from greater seed production for agiven tree size? Understanding global trends requiresestimates of seed production at both the individual treeand the per area scales. We present a new synthesis thatallows us to quantify the fecundity gradient on a globalscale and determine that the fecundity gradient is amplified in warm/moist climates beyond what can be explained by tree size or NPP.The global meta- analysis that found a possible trendin seed mass multiplied the number of seeds counted intraps by the average seed size for all plant species thatwere observed at the same latitude (Moles et al., 2009).The authors recognised the approximate nature of theseestimates given the seven- order of magnitude range ofseed sizes used to obtain the latitude means. In addition to uncertain seed size, counts from seed traps varywidely depending on precise placement of seed traps relative to locations of trees. Where reproduction is counteddirectly on trees, studies typically report on one to a fewspecies from one to a few sites, and not seed productionfor all trees in measured plots, as would be needed toplace fecundity on a per area basis. Recent compilationsof year- to- year mast production recognise additionalchallenges posed by divergent methods, some yielding arange of indices at the individual or stand scale on relativised or ordinal scales (LaMontagne et al., 2020; Pearseet al., 2020). Unlike previous meta- analyses, we analyseraw data referenced to an individual tree- year, that is,the seed production by each tree in each year, includingall trees on inventory plots. By estimating seed production at the tree- year scale (Clark et al., 2019), we quantifyboth the trends in individual production and in the seedproduction per area.The indicators that we evaluate allow us to determineboth the gradient in seed productivity of communitiesand how the gradient in seed productivity is influenced
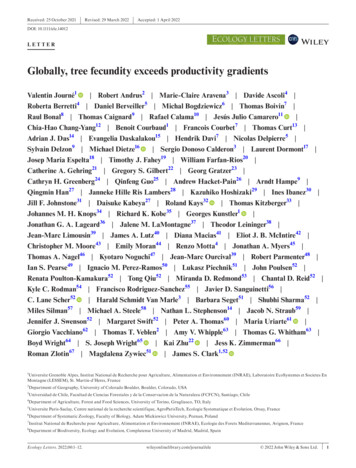
4 GLOBALLY, TREE FECUNDITY EXCEEDS PRODUCTIVITY GRADIENTSby individual tree responses. Individual fecundity couldvary due to climate through alternative allocation priorities (Figure 1a). Because reproductive effort depends onboth seed sizes and numbers (Westoby et al., 1992), andreproductive effort varies with tree size (Qiu et al., 2021),individual standardised production (ISP) is defined hererelative to tree basal area,ISPij ̂f ijs gsbasal areai,(1)(g m 2 year 1). ISP depends on the mass of a seed gs produced by species s and the estimate of mean seed producf ijs for tree i at location j that accounts for the effectstion ̂of shading by neighbours, and the variation and uncertainty in seed production each year, fijs,t (see Methods:Uncertainty in ISP and CSP, Equation (4)). ISP is standardised by tree size to isolate the fecundity differencesthat are unrelated to size. If seed production is determinedsolely by tree size, as assumed in most ecological models(reviewed in Qiu et al., 2021), then climate effects on treesize still come through the effects of climate on past growth,which, in turn, affects tree size and thus stand structure;even if trees are larger in the wet tropics, ISP could still beconstant across the climate gradient because ISP is standardised for size. Departures from this constant responseare possible if trees allocate proportionately more or less tofecundity in warm/moist climates (Figure 1).While ISPij can show how individual allocationchanges with climate, community seed production, CSPj,quantifies seed production per area of forest, the startingpoint both for stand regeneration and the interactionsbetween seeds, seedlings, consumers and dispersers. [Wehereafter omit subscripts to reduce clutter.] Like NPP,CSP is a community property, defined as the seed production summed over all trees on a plot and divided byplot area (g ha 1 yr 1, Methods, Equation 5). CSP mightscale as a fraction of NPP, as suggested by some empirical evidence (Vacchiano et al., 2018) and assumed inDGVMs (Fisher et al., 2018; Hanbury- Brown et al., 2022).NPP scaling predicts high CSP in warm/moist climateswhere NPP is high (Del Grosso et al., 2008) (Figure 1b).It is also possible that intense competition selects for allocation to growth and defences that enhance survival. Ifso, CSP is expected to show a flatter response to climatethan the NPP response to climate (‘ growth/defence’ inFigure 1).Alternatively, fecundity responses could be amplifiedbeyond what could be explained by the effects of climate on size or NPP (‘ fecundity’ in Figure 1). Thereare at least two potential causes for fecundity amplification, including (i) reproductive allocation can respondto favourable climates because reproduction is unconstrained by the structural and hydraulic constraintsthat limit growth responses (King et al., 2009; Kochet al., 2004), and (ii) intense species interactions in thewet tropics amplify selection for reproduction to offsethigh losses to consumers and enhance the benefits offrugivory (Terborgh, 1986; Harms et al., 2000; Hille RisLambers et al., 2002; Schemske et al., 2009; Levi et al.,2019; Hargreaves et al., 2019).Large data sets are needed to estimate climate effectsdue to wide variation in seed production. For a given tree,large crop years often exceed intervening years by ordersof magnitude (Koenig, 2021; LaMontagne et al., 2020;Mendoza et al., 2018; Vacchiano et al., 2018). Variationbetween trees also varies by orders of magnitude (Clarket al., 2004; Minor & Kobe, 2019). Seed production further responds to spatio- temporal variation in habitatF I G U R E 1 (a) Individual seed productivity (ISP, seed mass per tree basal area) might not vary with latitudinal climate gradients, in whichcase community seed productivity (CSP, seed mass production per forest area) depends on variation in tree size. Alternatively, responsescould depend on net primary productivity (NPP), increasing if allocation in warm climates shifts preferentially to fecundity or decreasing ifallocation in warm climates shifts to growth and defences. (b) Proportionate differences in fecundity hypothesised for the three scenarios in(a) shown as differences from the climate gradient in NPP. The NPP scaling scenario means that NPP and CSP follow the same proportionatetrajectory (green line)
JOURNÉ et al.and climate (Bogdziewicz, Fernández- Martínez, et al.,2020; Caignard et al., 2017), including local competition(Clark et al., 2014, 2019). The many sources of variationmeans that biogeographic trends can only be identifiedfrom broad coverage and large sample sizes, while accounting for individual tree condition, local habitat andclimate (Qiu et al., 2021).This synthesis extends the Masting Inference andForecasting (MASTIF) network (Clark et al., 2021;Sharma et al., 2021) to quantify the climate controls onseed production globally and the extent to which seedproduction trends go beyond what can be explained bythe effects of tree size and productivity. Data include12 M observations from 147K mature trees and 251 inventory plots (Figure 2). We summarise climate trendswith mean annual temperature and moisture surplus.Model fitting allows for the effects of individual condition and local habitat variation by including tree diameter, shade class and soil cation exchange capacity(CEC), a widely used indicator of soil fertility (Hazelton& Murphy, 2007; Hengl et al., 2017), all of which affectseed production (Materials and Methods).M AT E R I A L A N D M ET HOD SFecundity dataThis study uses crop count (CC, on trees) and seedtrap(ST) data (Figure 3) from the MASTIF project. Most observations (99%) come from longitudinal studies, whereall trees on a plot (ST) or individual trees (CC) are observed repeatedly. Other CC observations (1%) are obtained opportunistically through the iNaturalist projectMASTIF (Clark et al., 2019). All observations provideestimates of ISP, including those on isolated trees. CSPrequires seed production from a known area and comesfrom inventory plots (Table S1). Data include 12,053,732FIGURE 2Table S1. 5tree- year observations from 748 species and 146,744 mature individuals.As in all observational studies, geographic coverage isnot uniform. The majority of sites are temperate (98%),while most observations (tree- years, 80%), trees (58%)and species (74%) are tropical. Sample sizes are includedin Table S1. Sample locations are shown in Figure 2 anddetailed in Figure S1 and Table S1. To assure that results are not dominated by any one site, we show thatthe same trends dominate when the largest tropical site,Barro Colorado Island (BCI), is removed from the analysis (Figure S4).For both CC and ST data types, an observation references a tree- year (a fecundity estimate for one treein one year). A CC observation includes the number offruiting structures counted (e.g. individual seeds, conesand fruits) and an estimate of the fraction of the totalcrop represented by the count (see Model Inference withMASTIF). Where structures bear more than one seed,numbers are scaled by seeds per structure. For example,Fagus capsules bear two seeds per capsule, and Pinuscones bear from 10 to 200 seeds per cone, dependingon species. Seed mass and number of seeds per fruiting structure were taken as an average for the species,obtained from collections in our laboratories, supplemented with the TRY Plant Trait Database (Kattgeet al., 2020). A seedtrap (ST) observation includes countsand locations for seed traps on an inventory plot whereeach tree is measured and mapped. The uncertainty ina tree- year estimate depends on the crop- fraction estimate for CC observations and on the redistribution kernel for ST observations. A beta- binomial distribution forCC data combines uncertainty in the count and in thecrop- fraction estimate. For ST observations, the redistribution model (‘dispersal kernel’) quantifies transportto seed traps, a categorical (multinomial) distributionallows for uncertain seed identification, and a Poissonlikelihood allows for variable counts. These data modelsMASTIF data summary, with symbol size proportional to observations. The distribution of data is detailed in Figure S1 and in
6 F I G U R E 3 The MASTIF model simplified from Clark et al.(2019) to emphasise variables and parameters discussed in the text.A biophysical model for change in fecundity 𝜓 i,t of tree i in yeart (a tree- year) is driven by individual tree condition and climateand habitat variables in design vector xi,t with correspondingcoefficients 𝛽. Maturation status incorporates tree diameter di,t.The hierarchical state- space model includes process error variance𝜎 2 and observation error in two data types. A crop count ci,t has abeta- binomial distribution that includes observation error throughthe estimated crop fraction. A set of seed traps provides a vectorof counts yt y1,t , , yn,t that together provide information on treei through a dispersal kernel. There is conditional independence infecundity values between trees and within trees over time, taken upby stochastic treatment of 𝜓 i,t. There is an additional subscript forlocation j that is suppressed here to reduce clutter. The full modelincludes additional elements (see section Model Inference withMASTIF)link to a common process model for individual fecundity(Figure 3). Stochastic treatment of fecundity absorbsdependence between observation types, between treesand within trees over time. The full model is detailed inClark et al. (2019) and summarised in the section ModelInference with MASTIF.Environmental and individual covariatesPredictors for a given tree- year include diameter,crown class, climate, soil and terrain covariates (TableS2). Linear and quadratic terms for diameter allow forchanges in fecundity with tree size (Qiu et al., 2021). Thecrown class assigned to each tree ranges from 1 (fullsun) to 5 (full shade), following the protocol used in theNational Ecological Observation Network (NEON) andthe USDA Forest Inventory and Analysis (FIA) program.Climate variables include norms and annual anomalies for temperature ( C) from the previous year, andmoisture surplus (summed monthly precipitation minusevapotranspiration, mm) from the previous and current years. To allow for changes in moisture access withtree size, we included the interaction between moisturesurplus and tree diameter. Climate variables were derived from CHELSA (Karger et al., 2017), TerraClimate(Abatzoglou et al., 2018) and local climate monitoringGLOBALLY, TREE FECUNDITY EXCEEDS PRODUCTIVITY GRADIENTSdata where available. TerraClimate provides monthlybut spatially coarse resolution (Abatzoglou et al., 2018)through 2020. CHELSA provides high spatial resolution(1 km) but CHELSA is not available after 2016. We usedregression to project CHELSA climate forward based onTerraClimate, followed by calibration to local weatherdata where available. Details are available in Clark et al.(2021).Cation exchange capacity (CEC), an indicator of soilfertility (Hazelton & Murphy, 2007), was obtained fromsoilGrid250 (Hengl et al., 2017) and used as the weightedmean from three soil depths, namely 0– 5, 5– 15 and 15– 30 cm, where weights are the reported uncertainty values. Slope and aspect were obtained from the globaldigital elevation model from the NASA shuttle radartopography mission (Farr et al., 2007) and, for latitudesabove 61 , from the USGS National Elevation Dataset(Gesch et al., 2002). Both products have 30- m resolution.The covariates for slope and aspect (u1, u2, u3) constitutea length- 3 vector, u sin(s )j j,1uj uj,2 sin(sj ) sin(aj ) , u sin(s ) cos(a )jj j,3(2)for slope sj, where aspect aj is taken in radians. These threeterms are included as elements of the design vector xij,t(Clark, 1990b).Model inference with MASTIFThe MASTIF model is a (hierarchical) state- space,auto- regressive model that accommodates dependencebetween trees and within trees over years through a jointanalysis detailed in Clark et al. (2019). For each tree iat location j and year t , there is a mean fecundity esf ij,t ̂𝜌ij,t 𝜓̂ i,t that is the product of conditionaltimate ̂𝜌ij,t, which isfecundity 𝜓̂ and maturation probability ̂the probability that an individual is in the mature state,zij,t 1. The model for conditional fecundity is given by(w)log 𝜓 ij,t x ij,t 𝛽 (x) 𝛽 i 𝛾 g [i],t 𝜀i,t, where xij,t is the design vector holding climate, soils, local crowding andindividual attributes (Table S2), 𝛽 (x) are fixed- effects co(w)efficients, 𝛽 i is the random effect for tree i , 𝛾 g[i]j,t areyear effects that are random across groups g and fixedfor year t , and 𝜀ij,t is Gaussian error. To approximate thescale of potential synchronicity of masting species, thegroup membership g[i] for tree i is assigned by speciesecoregion (Clark et al., 2019), using the WWF ecoregionclassification (Olson et al., 2001). The principal elementsof the model are summarised as a directed acyclic graph(DAG) in Figure 3.Conditional log fecundity 𝜓 is censored at zero toallow for the immature state and for failed seed crops inmature individuals,
JOURNÉ et al.{fij,t (zij,t 1) 0𝜓 ij,t 1.𝜓 ij,t 𝜓 ij,t 1(3)This censoring means that seed production requiresthe potential to produce at least one seed; the Tobit modeluses this censoring to allow for discrete zero observationsfor otherwise continuous response variables (Tobin, 1985).For ISP, fecundity is multiplied by mass per seed and standardised for tree basal area (Equation 1). For CSP, seedmass is summed over trees on an inventory plot and divided by plot area. The uncertainty for both quantities isgiven in the section Uncertainty in ISP and CSP.The posterior distribution includes parameters andlatent variables for maturation state and tree- yearseed production. Posterior simulation uses direct sampling and Metropolis and Hamiltonian Markov Chain(HMC) updates within Gibbs. Model structure andmethodology were implemented with R (version 4.0, RCore Team, 2020) and the R package Mast Inferenceand Forecasting (MASTIF), detailed in Clark et al.(2019).Uncertainty in ISP and CSPMean productivity estimates for an individual, ISP, incorporate year- to- year uncertainty for that tree. Meanproductivity estimates for the community, CSP, incorporate tree- to- tree uncertainty for the inventory plot. Weincluded only trees 7 cm in diameter, that is, at leastas large as the smallest measured size in inventory data.Individual fecundity for species s at location j is evaluated as ̂t wijs,t f ijs,t, t wijs,t̂f ijs (4)where the weight wijs,t is the inverse of the predictive co 1efficient of variation for the estimate, wijs,t CVijs,t. TheCV is used rather than the predictive standard deviation,because the mean tends to scale with the variance suchthat a standard deviation weight would have the undesirable property of down- weighting the important large values while up- weighting the less important low values. ISPcombines fecundity from Equation (4) with seed mass andtree basal area in Equation (1).Community seed production is evaluated from the individual meansCSPj njAj ̂is wijs f ijs, is wijs(5)where Aj is plot area, nj is the number of trees and wijs isthe inverse of the coefficient of variation given by the 7root mean predictive variance divided by the predictive mean for tree ijs. Because CSP requires plot area,only trees on inventory plots are included in the CSPanalysis. Variation in ISP and CSP values were compared across temperature and moisture surplus usingregression.Net primary productionWe extracted net primary production (NPP) from theModerate Resolution Imaging Spectroradiometer(MODIS) product MOD17 at 500 m resolution(MOD17A3HGFv006, Running et al., 2004). We mergedyearly CSP estimates with NPP from matching siteyears, which are available from 2000 to 2020. Becauseseed production data span the interval 1959 to 2020, weused the location- specific mean NPP values for the limited number of earlier years. Because MODIS NPP isinfluenced by cloud cover, we compared MODIS NPPvalues with NPP values from DGVMs in the S3 experiment of the TRENDY project (Sitch et al.
James S. Clark, Nicholas School of the Environment, Duke University, Durham, NC, USA. Email: jimclark@duke.edu Funding information Belmont Forum, Grant/Award Number: 1854976; Programme d'Investissement d'Avenir, Grant/Award Number: 8-1 MPGA- 000; 4oNnene cal Si i cat Foundation, Grant/Award Number: DEB- 1754443; NASA, Grant/Award Number: