Transcription
Cleanrooms:Classification versus Monitoring;Considerations of Removal EfficiencySetting Alerts and Actions
Agenda Classification versus Monitoring What affects Particle Concentration in a cleanroom What can be readily controlled to affect concentration What are the current trends and dialog that will likelychange historic mainstays of cleanroom design Setting ALERT and ACTION levels for best effect2
ConclusionTwo key thoughts:1. Know and control sources of contamination2. Understand how the area/room removes contamination3
Sources of contaminationSources:In-filtrationFiltered airMachinesProcessesMaterialsPeople- How many- Gowning level and execution4
Removal Efficiency Quantity of filtered airQuality of filtered airTurbulenceImpact of convectionCleaning routines5
WWW.ASHRAE.ORGUSD 151.00(as PDF)
Measuring Particles: 2 intentionsClassificationMonitoring12
DifferencesClassificationMonitoringFrequency6 months or annual;a formal studyDaily, weekly, monthlyor continuousNumber of positionsBy formulaBy need for dataSample volumeBy formulaBy need for dataPass/Fail criteriaBy table;one “class limit” valueBy need for trend infoor control; oftenALERT and ACTIONReporting formatBy standardIn form needed forrapid understandingDistribution of countsin a room or zoneUniform orhomogeneousUnique at eachsample position13
DifferencesFocus of assessmentClassificationMonitoringRoom or ZoneEach sample position14
Measuring Particles: 2 intentionsClassification15
Classification Standards for Airborne ParticlesGeneral Cleanroom Airborne Particle Monitoring Standards– before 199916
Classification Standards for Airborne ParticlesGeneral Cleanroom Airborne Particle Monitoring Standards–ISO 14644-1 Classification of air cleanliness–ISO 14644-2 Specifications for testing andmonitoring to prove continuedcompliance with ISO 14644-1–1999ISO 14644-3 Guidance on instrumentation tobe used for testing forcompliance with ISO 14644-1ISO 1464417
Classification Standard: ISO 14644-1General Standard for all IndustriesElectronics Semiconductor Flat Panel Circuit Board Optical MEMS/NanomachinesLife Sciences Pharmaceutical Biotechnology Medical Devices Hospitals/PharmaciesAerospace Launch Vehicles Satellites Commercial/Military AircraftLaboratories Analytical Laboratories UniversitiesOther Nuclear Photographic, X-ray films Automobile PaintingOtherLaboratoryElectronicsAerospaceLife Sciences18
Classification Standard:ISO 14644-1:1999Purpose Defines cleanroom classes Establishes minimum sampling volume– Purpose: Gather a sample volume with theoreticallyat least 20 particles for a statistically valid sample Establishes minimum number of points to classify area,based on statistical criteria– Gather a representative sample of the total air volume from astatistically valid number of locations19
Classification Standard: ISO 14644-1:1999LimitsClassNumber of Particles per Cubic Meter by Micrometer Size0.1 µmFS 209EClass 1000.3 µm0.5 µm1 µm5 µmISO 1102ISO 210024104ISO 31,000237102358ISO 410,0002,3701,02035283ISO 5100,00023,70010,2003,520832291,000,000 237,000102,00035,2008,320293ISO 7352,00083,2002,930ISO 83,520,000832,00029,30035,200,000 8,320,000293,000ISO 6FS 209EClass 10,000FS 209EClass 100,0000.2 µmISO 920
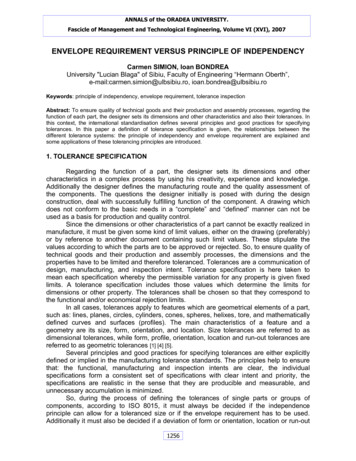
Revised Table for ISO Classes;Classification Limits: ISO 14644-1:2015Number of Particles per Cubic Meter by Micrometer SizeISO0.1 µm0.2 µm0.3 µm0.5 µm1 µm5 5100,00023,70010,2003,5208321,000,000 520,000832,00029,30035,200,000 8,320,000293,0006921
Revisions to ISO 14644-1( December 2015 )
Major change #1:Minimum number of samplelocations
Revisions to ISO 14644-1Method of determining minimum number ofsample positions– Previously determined by taking the Square Root(SQRT) of measurement area (in square meters)– Replaced with stated number of minimum samplepositions as a look-up chart– Will mean a modest increase in the number ofsample points in almost all cases24
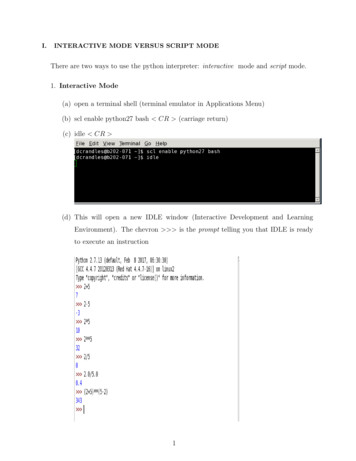
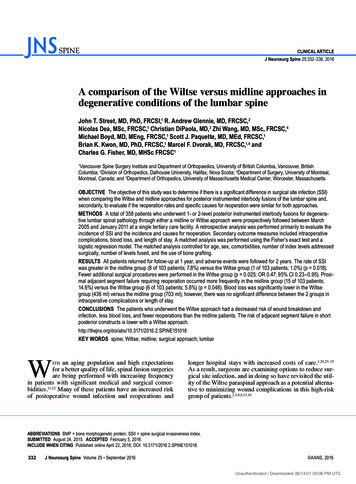
Table A.1 — Sample locations related to cleanroom areaA.4.1 Establishment ofsampling locationsDerive the minimum numberof sampling locations, NL,from Table A.1.Table A.1 provides thenumber of sample locationsrelated to the area of eachcleanroom or clean zone tobe classified and provides atleast 95 % confidence thatat least 90 % of all locationsdo not exceed the classlimits.Area of cleanroom (m2) lessthan or equal toMinimum number of samplelocations to be tested 563626100027 1000See Equation A.125
Major change #2:Specific Calibration Method( ISO 21501-4:1997 )
ISO 21501-4:Additional Tests Basic calibrationSize calibrationFalse count rateSampling Flow RateSampling Time ISO 21501-4Size calibrationFalse count rateSampling flow rateSampling timeVerification of size settingCounting efficiencySize resolutionConcentration limitSampling volume27
#328
Repeatability6 months12 months29
Reproducibility30
Table A.1 — Sample locations related to cleanroom areaA.4.1 Establishment ofsampling locationsDerive the minimum numberof sampling locations, NL,from Table A.1.Table A.1 provides thenumber of sample locationsrelated to the area of eachcleanroom or clean zone tobe classified and provides atleast 95 % confidence thatat least 90 % of all locationsdo not exceed the classlimits.Area of cleanroom (m2) lessthan or equal toMinimum number of samplelocations to be tested 563626100027 1000See Equation A.132
Intuitive User Interface!Test wizard for standardscompliance Wizard to conduct pass/fail test for:– ISO 14644-1– EU-GMP Annex I– FS 209E standards No expertise in standards required.Just a few clicks to compliance The wizard guides an operatorstep by step to sample data,process data and product reports33
2No more manualdata entry!Manual methodsmean lost printouts rework wasted time data entry errorsMET ONE Simply Paperless:Files exported to Excel straight from thecounter via Ethernet, WiFi or USB –eliminates manual data transcription34
3 Built in workflow toolsMET ONE Simply Paperless:Step-by-step directions for EM program.Comments/alarm reasons added via thecounter touch-screen.35
5 Easy integration into LIMS3. Data transferredautomatically via your networkin .pdf, .csv and .xml formats1. Takeparticlecountsample2. Click ‘Export’Options:a) Retain .pdf, .csv and .xmlora) Feed data direct into LIMSAccurate, 21CFR part 11compliant data transfer!MET ONE Simply Paperless increases EMproductivity while improving compliance byeliminating data errors/data gaps.36
MET ONE Simply PaperlessSummary12No more manual data entryNo more scanning printoutsEliminate manual data transcriptions3Built-in workflow toolsEliminate paper print-outs and scanning/photocopyingStep-by-step directions, eliminating data gaps. Includeslocation labels, sample recipes, sample review/commen5Option of full LIMS integrationFully electronic records4 20% productivity increaseSave up to 1½ hours per day37
Impact on- EU GMP Annex 1- PIC/s EU GMP Annex 1- DR Norm 32
None directly !!!But because these reference ISO 14644-1to determine the minimum number ofsample points, there is an effect . . .
EU Annex 1:Latest revision (2009)Classification– Sections 4 through 7Monitoring– Sections 8 through 1740
EU Annex 1 Summary:ClassificationClassification – Sections 4 through 7Section 4:“Classification should be clearly differentiated fromoperational process environmental monitoring.”Section 5:“ For classification purposes in Grade A zones, a minimumsample volume of 1 m3 should be taken per sampleposition.41
EU Grade DefinitionsGradeABCDActivityHigh Risk - filling, open vials, stopper bowlsAseptic preparationsClean area of less critical operationsClean area of less critical operationsat restin operationmaximum permitted number of particles/m3 equal to or above5 µm0.5 µm0.5 µm5 µm3 520203 520203 52029352 0002 000352 0002 0003 520 00020 0003 520 00020 000not definednot defined Zone grades according to risk of product contamination Particle count measurements at 0.5 µm and 5 µm “At rest” vs “In operation”42
EU Annex 1:Latest revision (2009)Limits at 5 microns for Grade A1 per cubic meter 20 per cubic meterAt RestRestAtIn Operation3Maximum permittedpermitted number of particles/m3Maximumequal toto oror greatergreater thanthan thethe tabulatedtabulated sizeequalsizeGrade0.5 µmµm0.55 µmµm50.5 µmµm0.55 µmµm5AA3 50052032013 5005203201B3 500520291352 0003502 000900C352 0003502 0009003 500520 00029 00020D520 00033500000029 00020not definednot defined43
EU Annex 1 Summary:ClassificationSection 5:“For classification purposes EN/ISO 14644-1 methodologydefines both the minimum number of sample locationsand the [minimum] sample size based on the class limitof the largest considered particle size and the method ofevaluation of the data collected.”44
EU Annex 1 Summary:ClassificationSection 5 (continued)“For classification purposes EN/ISO 14644-1 methodologydefines both the minimum number of sample locationsand the [minimum] sample size based on the class limitof the largest considered particle size and the method ofevaluation of the data collected.”Number of locationsSample Volume (B,C,D) Based on lookup table45
EU Annex 1 Summary:MonitoringMonitoring: Sections 8 through 17Section 8:“Clean rooms and clean air devices should be routinelymonitored in operation and the monitoring locationsbased on– a formal risk analysis studyand– the results obtained during the classification of rooms and/orclean devices”46
EU Annex 1 Summary:MonitoringSection 9 “The Grade A zone should be monitored at such afrequency and with suitable sample size that allinterventions, transient events and any systemdeterioration would be captured and alarms triggered ifalert limits are exceeded. “continuous” !!!47
EU Annex 1 Summary:MonitoringSection 12: “The sample sizes taken for monitoring purposes usingautomated systems will usually be a function of thesampling rate of the system used. It is not necessary forthe sample volume to be the same as that used for formalclassification of clean rooms and clean air devices.” It is not necessary to sample 1m3 during verificationor monitoring Particle counters used for monitoring may have thesame or different flow rate from those used forclassification.48
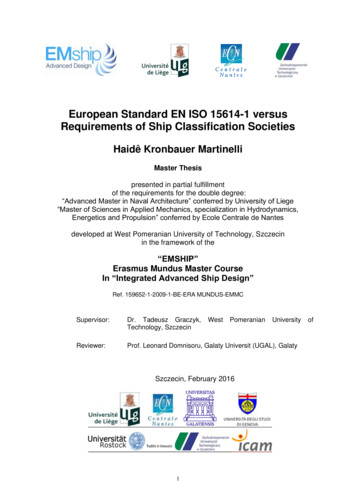
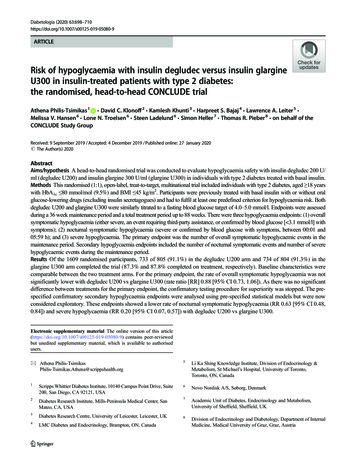
Monitoring Positions:Risk-based Approach4VialSterilizingTunnelLyo 115723Lyo 2 Monitoring must follow the workflow, covering areaswhere product is exposed – Annex 1 (2009) Where open vials exit de-pyrogenation – human interaction (1)6 Where vials are filled (2,3) Surrounding Grade B background (4) Where the vials are partially stoppered (5)Lyo 3 Loading area in front of lyophilizers must be Grade A ifproduct is not fully stoppered (6,7)49
Monitoring Positions:Risk-based Approach4VialWashingSystem123In a filling operation for which thefinal product remains liquid, somepoints established for a lyophilizedproduct would not be needed.50
Measuring Particles: 2 intentionsClassification:ISO 14644-1; Annex 1Monitoring:Your SOP51
Key Points about CleanroomsCleanrooms are dynamic; particle concentrations changewith location and with timeParticle counts can fluctuate considerably but yet be normalStudying the actual particle count values over a long periodof time is often critical to setting good values for ALERT andACTION levelsStrategies for setting ALERT and ACTION levels will likelybe different for continuous PROCESS control versusintermittent EM sampling52
What affects Particle Concentration in acleanroom ?53
Cleanrooms and Clean Zones“Cleanrooms and associated controlled environmentsprovide for the control of contamination of air or surfaces tolevels appropriate for accomplishing contaminationsensitive activities. Contamination control can be beneficialfor protection of product or process integrity in applicationssuch as the aerospace, microelectronics, pharmaceuticals,medical devices, healthcare, food, etc.”ISO 14644-154
Cleanrooms and Clean Zones3.1.1 cleanroomRoom within which the number concentration of airborneparticles is controlled and classified, and which is designed,constructed and operated in a manner to control theintroduction, generation, and retention of particles inside theroom.ISO 14644-155
What can go wrong?A cleanroom or cleanzone usually starts out clean What are my potential sources of contamination?– How can I eliminate, minimize or control them? How does my room or zone remove particles?– In what direction(s)?– How fast?– How many occupants can be in there at one time? Is my cleaning service effective? How can I test or monitor to know I’m OK?
The tionratexRemovalefficiency ExpectedCounts pervolume
Particle Generation: SourcesFiltered AirLeakage into RoomMachineryPeopleDeposition re-circulation58
What can go wrong?Do you knowwhich way thewind blows?Particle events !!
Key Take-away #1Particle concentration varies by:A) LocationB) Time62
63
Effect of Unidirectional Air Control64
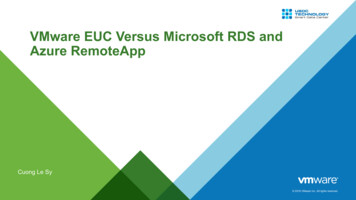
FDA on smoke studies of interventionsCompany XCompanyXCompanyX65
FDA’s Inspectional Observations (483’s) on Air Flow Pattern Visualization1. Smoke studies in ISO 5 hoods were not conducted under dynamic conditions.2. There has been no air flow pattern (i.e smoke study) evaluation studyperformed to determine the acceptability of the horizontal air flow, that is,the air flow is not compromised (i.e air turbulence/air eddies) duringthe aseptic operations that are performed in the ISO-5 area.3. There has been no air flow patter
Revised Table for ISO Classes; Classification Limits: ISO 14644-1:2015 ISO 0.1 µm 0.2 µm 0.3 µm Number of Particles per Cubic Meter by Micrometer Size 0.5 µm 1 µm 5 µm 1 10 237 102 35 2 100 24 10 4 10,000 2,370 1,020 352 83 3 1,000 8,320 293 5 100,000 23,700 10,200 3,520 832 352,000 83,200 6 1,000,000 237,000 102,000 35,200 2,930 8 .